

Mutual Funds
Zooming Out to See the Full Picture of Mutual Fund Performance
We started with a very basic question.
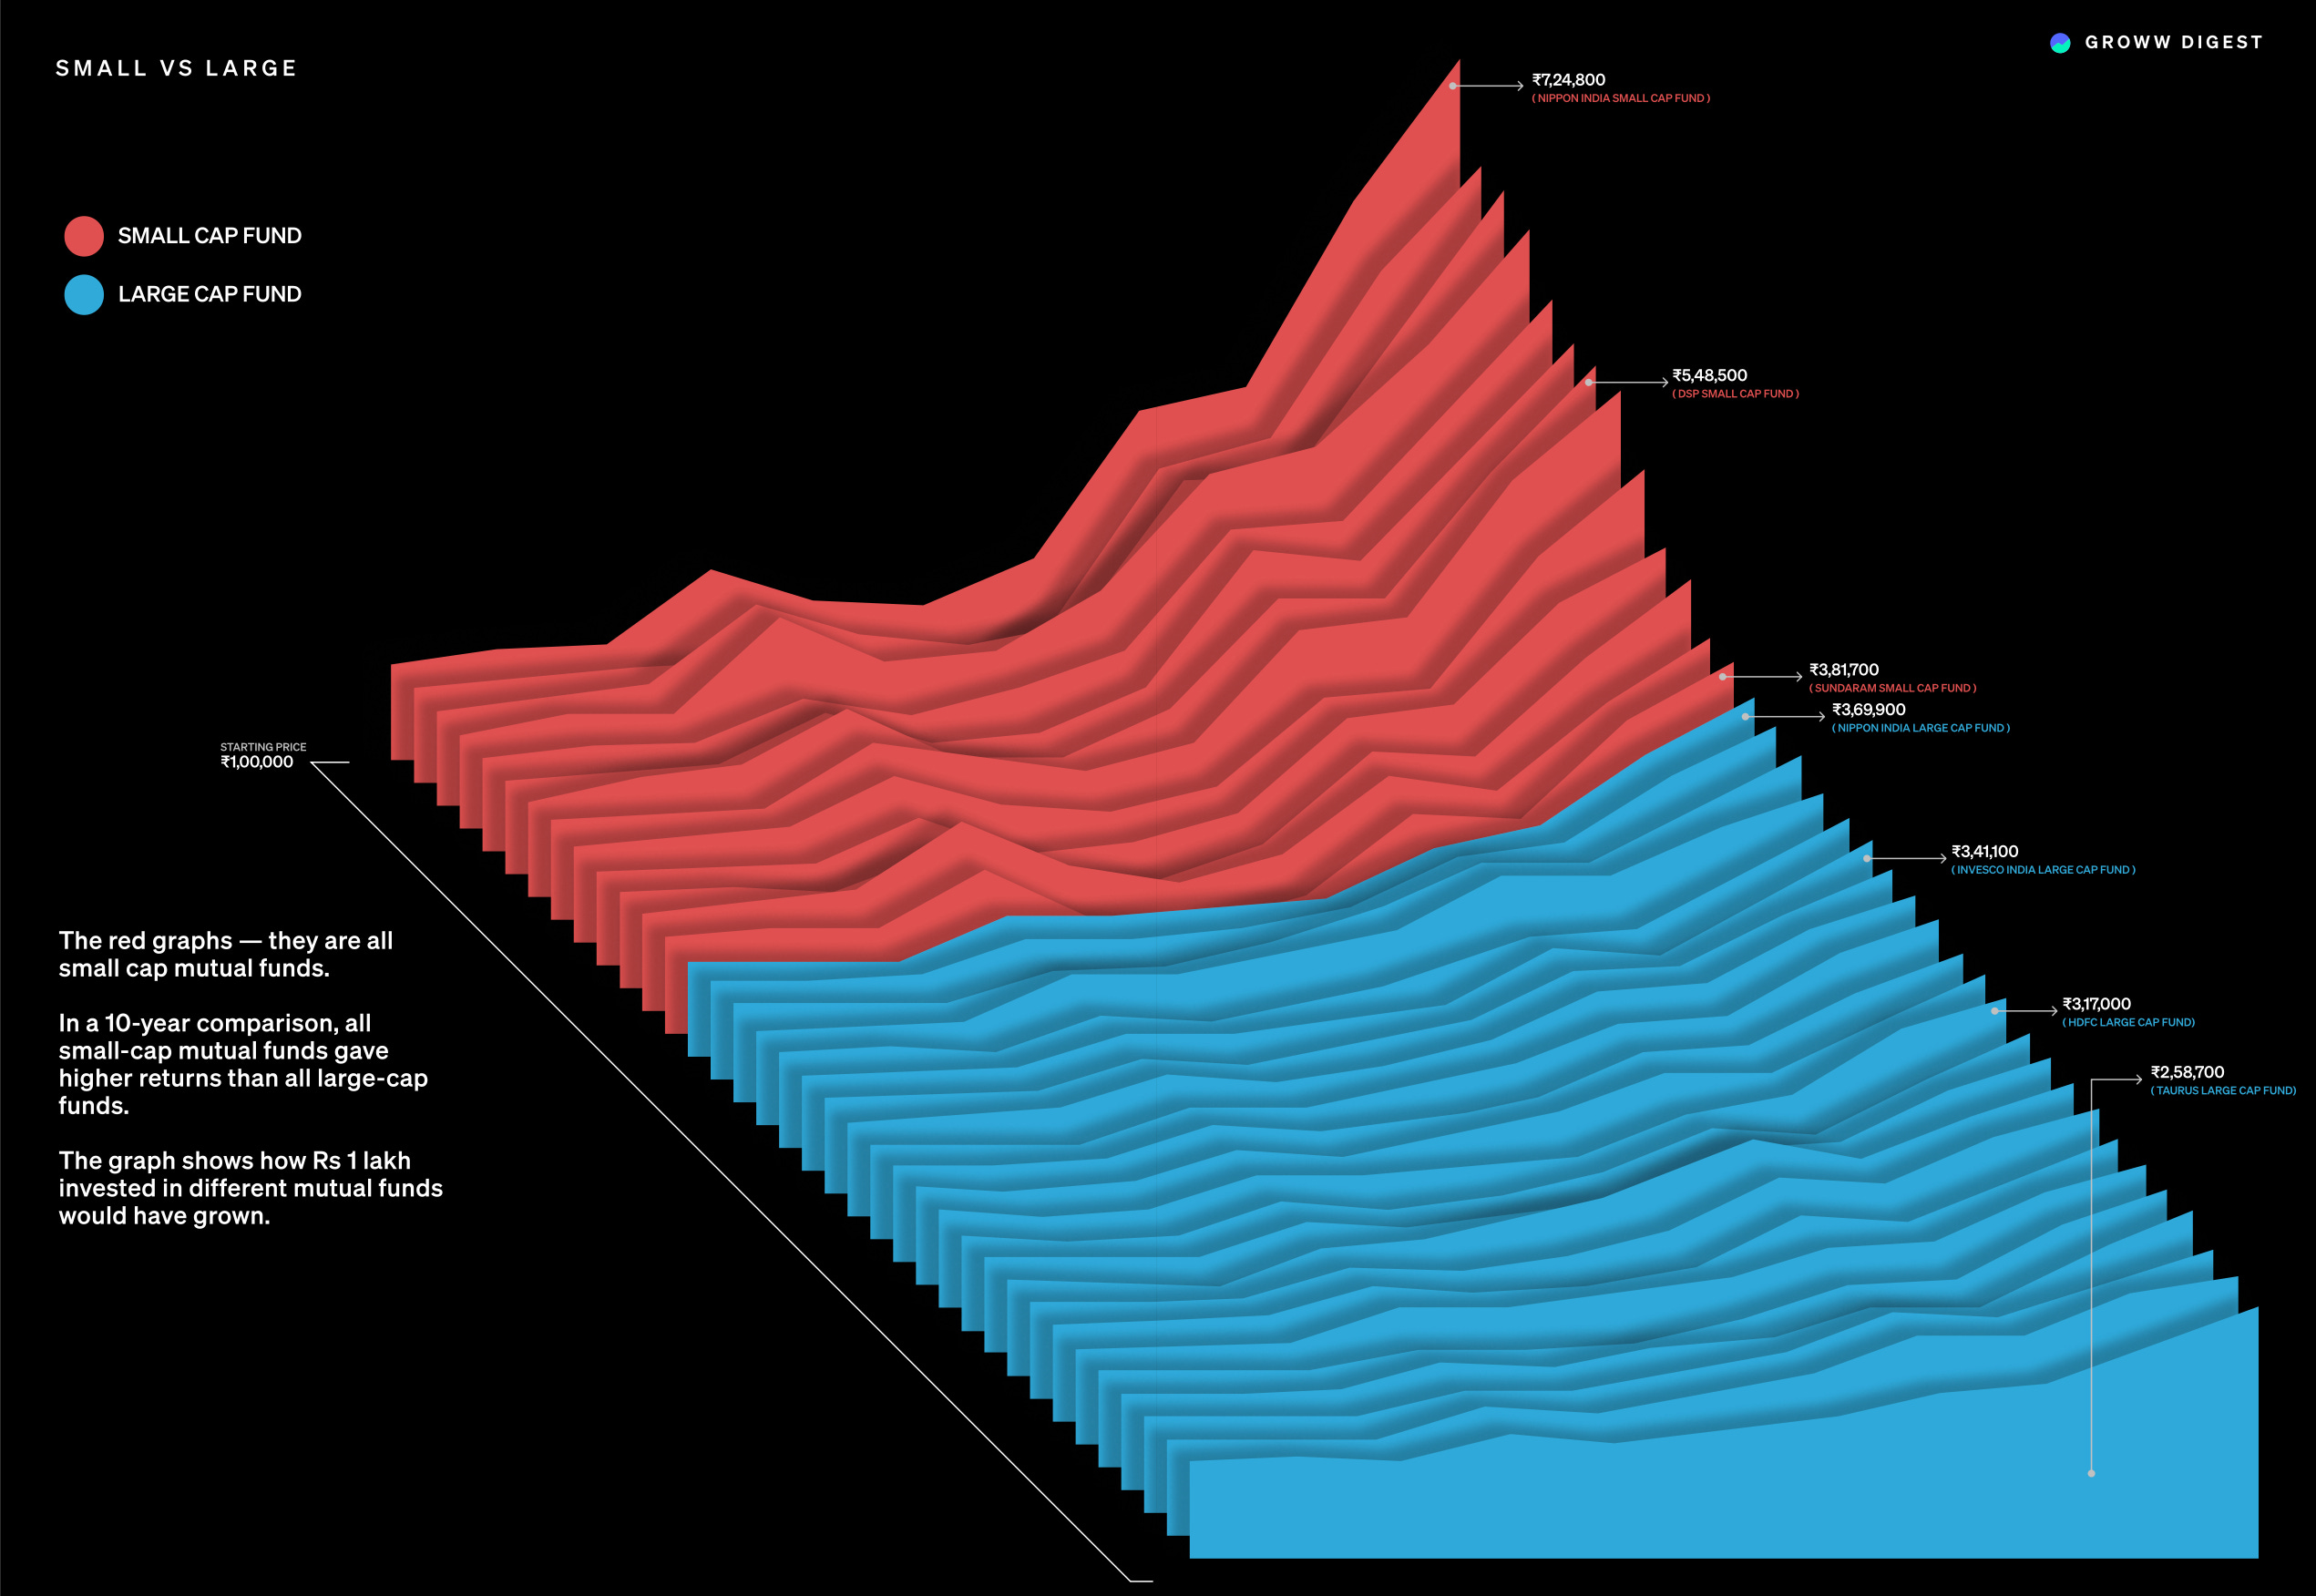
What if someone had invested Rs 1 lakh in a small-cap fund, 10 years ago? How would it grow?
While it sounds simple, it tells us how investing in a mutual fund really works. Because most of us don’t constantly jump in and out of funds. We invest, we wait, and we hope it grows.
So we took that Rs 1 lakh example and applied it to different categories of mutual funds: small-cap funds, large-cap funds, mid-caps, flexi-caps, multi caps.
This is where things got interesting.
The numbers tell that small-cap funds won the race by a good margin.
Some small-cap funds even gave twice the returns. Even the poorer-performing small-cap funds were ahead of large-caps funds.
We often hear about volatility in small-caps. They are known to rise sharply and fall just as fast. But what happens if you stay invested through those ups and downs? The data showed that the recovery from those lows often pushed final returns higher over time.
So why does large cap still capture all the attention? To understand that, the missing part of the story needs to be understood.
Because most investors panic when they see their portfolio in red, and think, “This isn’t working. I need to get out.”
That’s human. But it’s also the exact moment when patience matters the most.
The problem is — most people never see the full picture.
Returns — especially over a long stretch like 10 years — can often be misleading if viewed without context. They only show you the final destination, not how wild the journey was.
That’s the part we now need to explore. There’s a reason large-caps continue to be the default choice for many. And there’s a reason small-caps often come with a stronger warning.
This chart gives us a starting point, not a conclusion. From here, we’ll understand not just how much return each category gave, but how it got there.
“As I said, mid cap, small cap can be much more volatile as compared to their large cap peers. So the longer your investment horizon is, the better it is for small and mid cap categories.”
- Mr. Rupesh Patel (Nippon India AMC, Fund Manager)
Okay, so we saw something — small-cap funds didn’t just perform well. They outperformed. Over the decade, most of them created more wealth than large-cap funds did.
That seems pretty rosy.
But that’s also just one piece of the story.
Anyone who has ever opened a mutual fund screener already knows this: mutual funds aren’t just divided into small and large. The universe of mutual funds is much broader than that.
There’s a whole middle ground — with mid-cap funds, multi-cap funds, flexi-cap funds, and a few hybrids.
Each fund has its own personality.
Some shift their portfolio as the market moves.
Some stick to a style.
Some try to do a little bit of everything and just chase opportunities wherever they pop up.
So, just to be fair to everyone, we decided to zoom out.
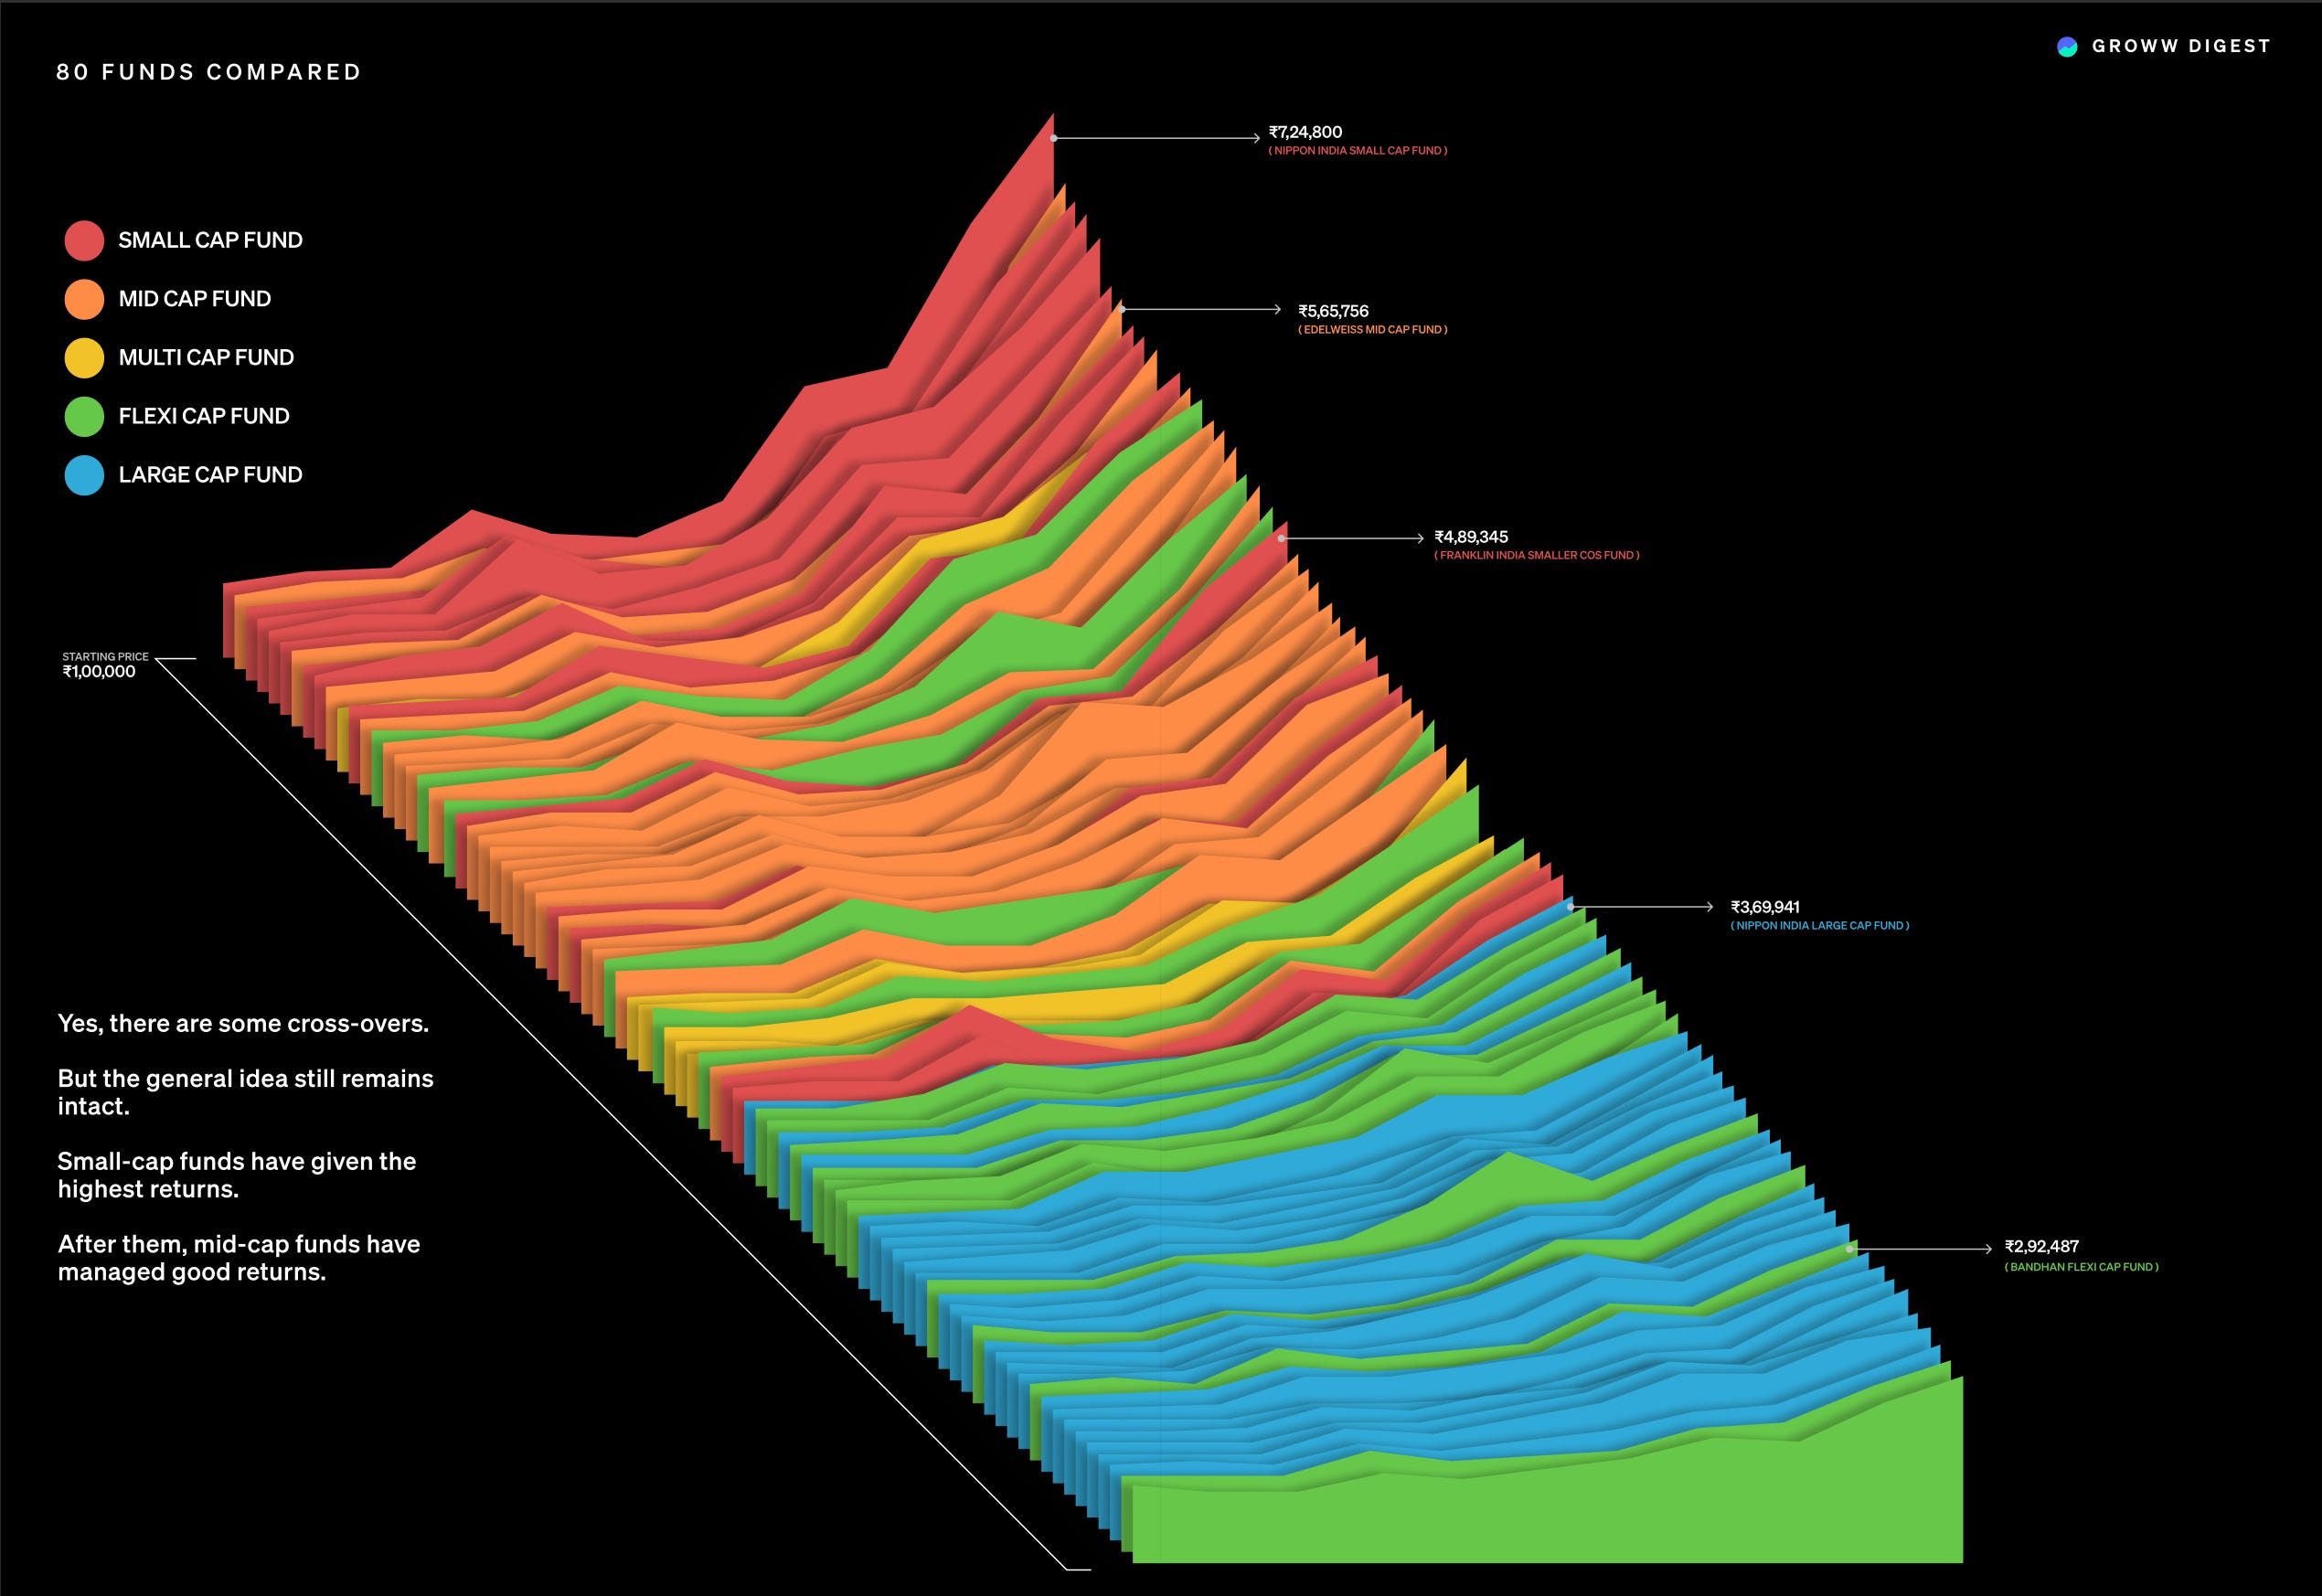
We took 80 mutual funds across all these categories and applied the same method:
A hypothetical Rs 1,00,000 invested in each fund, held for 10 years, with no switching, and no timing.
Then, we stacked the results fund-by-fund next to each other, from the best-performing to the least-performing one.
Here we see something interesting.
If we look closely, we’ll see that a few mid-cap and flexi-cap funds have made their way into the list of top performers.
It showed us that strong returns weren’t limited to just one category.
On the other end — the bottom of the chart. As expected, many large-cap funds ended up there.
Not because they performed badly, but because they just didn’t grow the money as much compared to other funds.
We also see that some multi-cap and flexi-cap funds are there too — funds that were supposed to have the ‘freedom to move anywhere’.
They have performed quite well — just not as well as small-cap funds.
“Flexi-cap funds by design give the fund manager complete flexibility to adjust the allocation between mid, small, or large-cap stocks, offering significant flexibility to investors as well.”
- Mr. Niket Shah (Motilal Oswal AMC, CIO)
Rolling Returns
A Better Way to Measure Performance
Point-to-point returns are very sensitive to entry timing. But in reality, no one can pick the perfect entry date every time. And that’s why these numbers can be very misleading.
Let’s talk about the first thing every AMC or online broker shows when you open their app — the returns. The app typically displays its past 1, 3, and 5-year returns.
Let's say that we are looking at returns for a small-cap fund on 1 Jan 2025, which shows a 3-year return of 18.5%.
On the next day (2 January 2025), we check the same fund and we see that the 3-year return has now increased to 19.2%.
A difference of 0.7% in just one day.
This is because on 1st Jan 2025, the 3-year return is calculated from exactly 3 years before that (1st Jan 2022 to 1st Jan 2025).
On 2nd Jan 2025, it’s calculated from 2nd Jan 2022 to 2nd Jan 2025.
We can clearly see that one day drops off from the past, and a new day gets added. This is how the returns are calculated (like in the above example of a 3-year period).
But, this way of calculating returns has limitations.
What is it, and why does this happen?
The way a point-to-point return is typically calculated is by calculating from the same day three years ago — and that starting day keeps shifting as time moves forward.
Even a one-day change in the start date can make a big difference in what return we see. This big difference becomes especially true for small-cap and mid-cap funds, which tend to move up and down much more sharply than large-cap funds.
This brings us to something every investor has probably felt — the regret of not getting the timing just right.
“If only I had invested last January, I’d be up 30% instead of 12%.”
So how do fund managers and investors deal with this?
They look at something more comprehensive — Rolling Returns.
Rolling returns don’t just look at one start date. They look at all possible start dates. If we want to check 1-year rolling returns for a fund, we don’t just check Jan 1 to Jan 1. We also check Jan 2 to Jan 2, then Jan 3 to Jan 3, and so on — for every single day. This gives us the complete picture, not just one result.
And this is where you start to understand how an investment actually behaved. It’s about understanding all the possible outcomes — from good to bad — over the years.
“So if you look at point to point data, whether it is 3 year, 5 year, 10 year, 15 year, you can see that small and mid caps, as a category, have delivered superior returns as compared to large cap. But mind you, this is point to point data, you should also look at the rolling return data to draw right kind of conclusions.”
- Mr. Rupesh Patel (Nippon India AMC, Fund Manager)
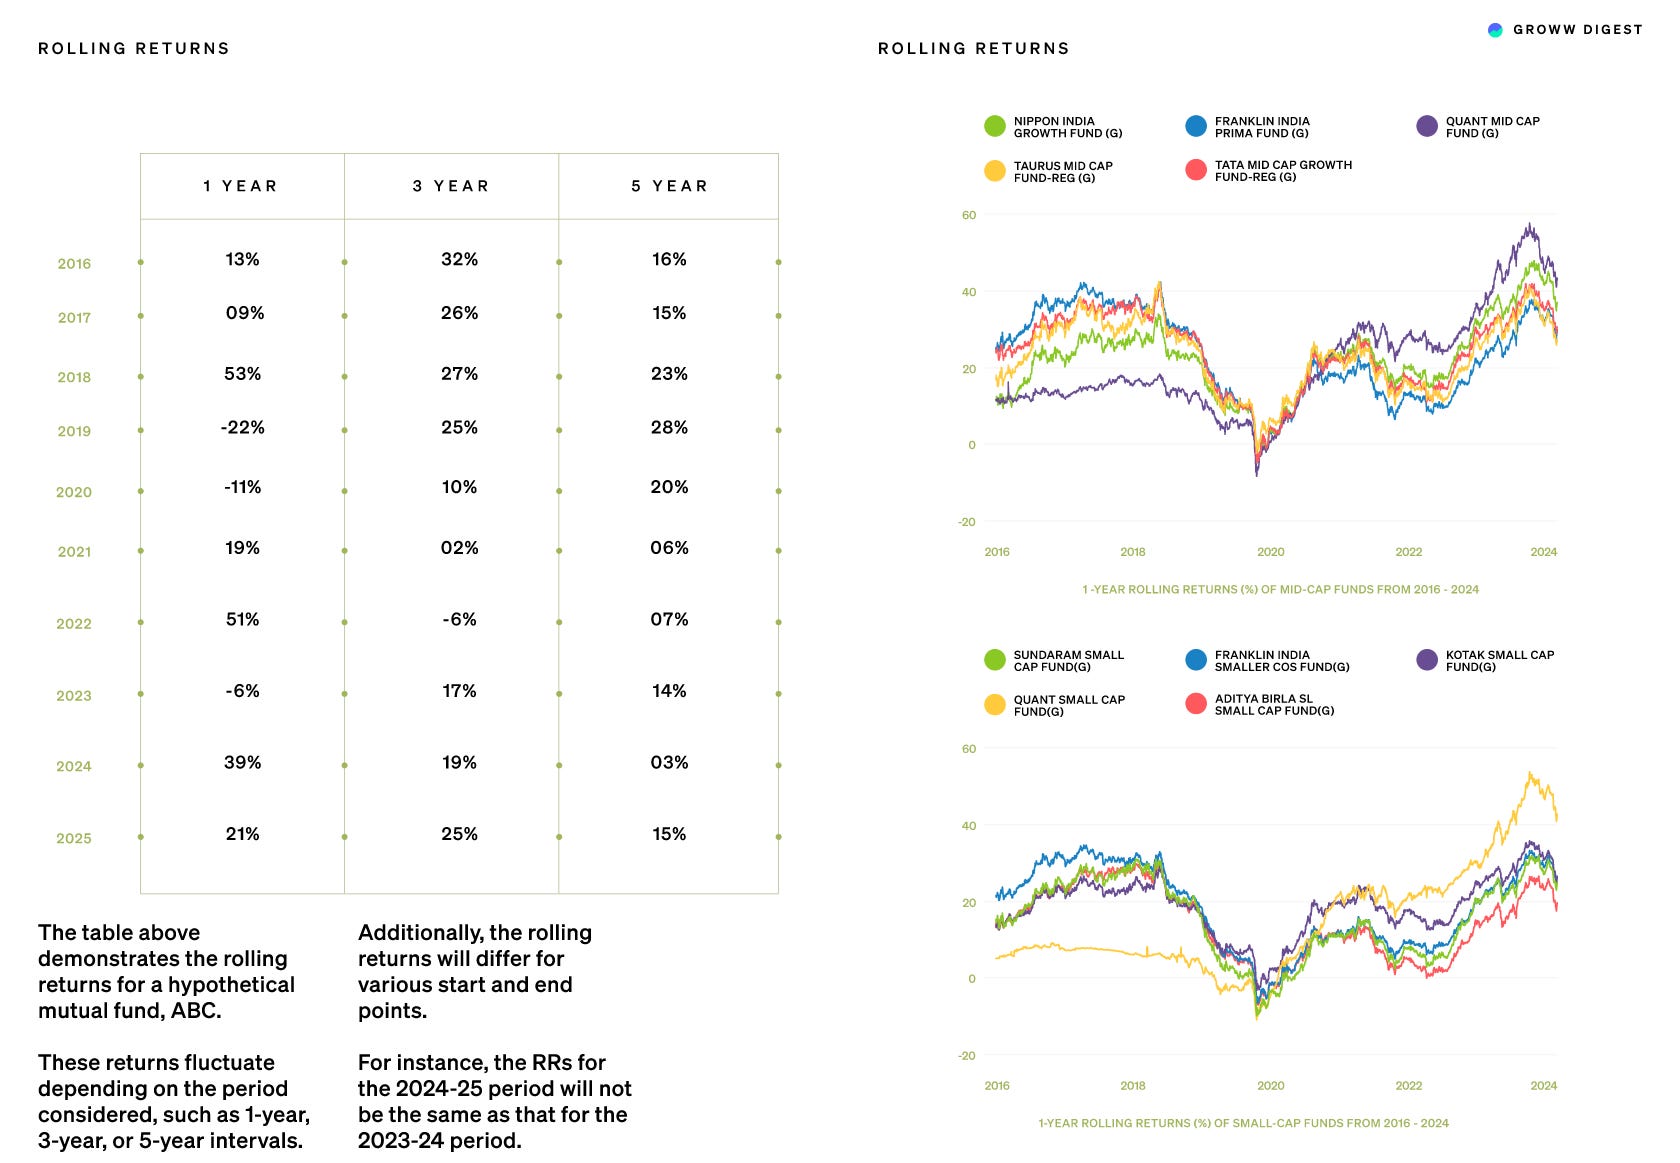
To understand these gaps, we checked the rolling returns of small-cap and mid-cap funds from 2016 to 2024.
For a 1-year holding period, the best return someone could have earned was +53%.
The worst was –22%.
Over 5 years, the best annualized return was around 25%.
The worst was just about 4%.
Even over 10 years, some entry points gave returns above 40% per year, while others barely gave anything.
The key isn’t just entering at any time — it’s entering at the right time.
Rolling returns make all of this evident. What was the best someone could have earned? What was the worst? And what kind of ups and downs did they go through?
So yes — point-to-point returns are what most people look at. But they only tell us one version of the story. Rolling returns help you see the whole picture.
Now that we understand this, let’s move forward.
“Okay, I get the returns. But what does the journey actually look like?” — a valid question.
This is answered by the concept of volatility. Not just the textbook definition — but what it actually means for your mutual fund journey. How smooth or shaky it feels. How much your portfolio moves each month.
Let’s dive into that next.
Because if returns are what we chase, volatility is what we live through.
“Since 2018, the small-cap universe has changed significantly, reducing the extreme volatility that used to be common. Previously, investors faced swings like 80% gains and 90% losses due to young, cyclical businesses. However, in the past five to six years, volatility has decreased, and with these changes, small-cap investments are no longer as risky as before.”
- Chandraprakash Padiyar (Nippon AMC, Fund Manager)
“If you believe a business has long-term growth potential and the valuations are right for investment, the key to making money is to buy when conditions are tough. You mentioned rolling returns, which reflect the volatility of any segment. It's generally true that the rolling return chart for small and mid-caps tends to be more volatile than that of large caps.”
- Mr. Rupesh Patel (Nippon AMC, Fund Manager)