

An explosion led to mass evacuations.
Melvindale, Michigan (USA), 15 Aug 2003.
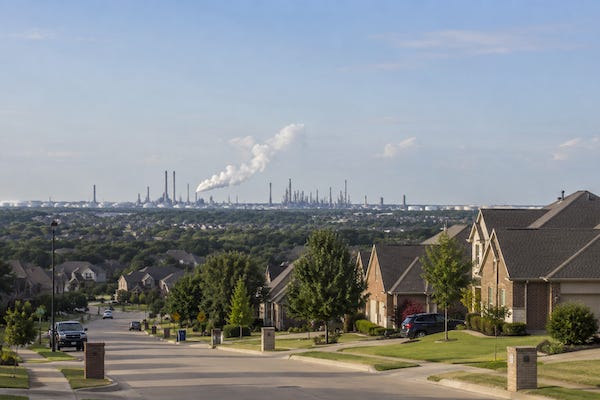
It was at a local oil refinery. The explosion resulted in what looked like smoke or steam rising from the site.
Unsure, the authorities feared the worst. They acted as though some toxic gases had been released.
Not wanting to take chances, they evacuated an area roughly equal to 550 football fields.
A little over 700 km away, in Sudbury (Canada), another accident was making life difficult for local authorities.
170 miners were working at a mine 4,000 ft below the surface. Their hoist lift stopped working. In damp and dark conditions, the lights went out, and miners had no real source of food.
They had water and their battery-powered flashlights still worked. But there was no way for them to leave.
In New York City, all metro trains ground to a halt. 4 lakh passengers were being helped out of the underground metro system.
800 km or so from there, workers at an amusement park were helping riders down a 200-ft tall roller coaster. It was stuck and wouldn’t move.
The water supply was affected in several cities in the Northeast of the USA and Southeast of Canada.
A whole host of systems were failing. Traffic lights weren’t working. Metro rails halted. Elevators trapped people. Cellphone communication became unreliable as many towers failed. Flights were disrupted. Hospitals were struggling.
A very long list of systems failed over a very large area.
Why were things going so wrong in such far-off cities? And that too at the same time?
Because they were linked to one essential system. The power grid.
This particular power grid was called the Eastern Interconnection. And parts of it had lost power on 14 Aug, 2003.
The event came to be known as the Northeast Blackout of 2003.
Even today, it remains the biggest power outage event the USA has experienced.
(In case you’re wondering — the smoke in Melvindale was mostly steam; all the trapped miners at Sudbury were rescued the next morning).
What Happened?
What happened is quite obvious. Power cut.
But why and how?
The summer was upon the region and power consumption was increasing (fans, ACs, fridges, etc).
Hot summers cause the power cables to sag (heat leads to expansion). Further, since more power was being drawn, more current was flowing through each, further heating the power cables.
The grid is connected in an interesting manner. It’s not connected in a straight line. It’s more like a web of connections.
So if one line goes out, power still reaches via the other lines.
And to deal with sudden issues like touching trees or even overcapacity, there are safety mechanisms in place.
Circuit breakers kill sections of the grid to protect them.
On 14 Aug, the hot power cables expanded and sagged. And at some locations, they touched untrimmed trees.
Immediately, those sections went off.
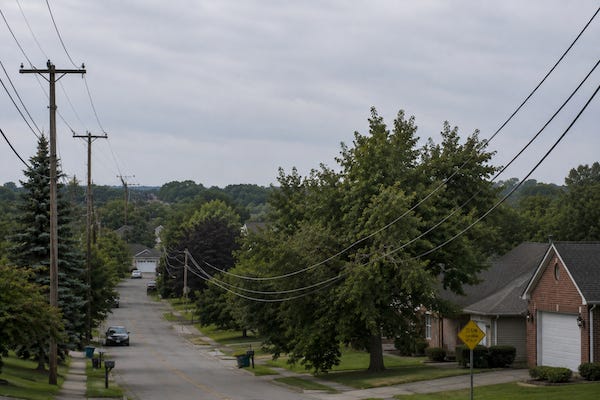
As soon as one cable touched some trees, it went off. A cascade of events was set off. A large part of the Eastern Interconnection grid was shut off.
There were many existing issues in the grid. But the trees sort of started the domino effect.
Events like these highlight the extreme importance of grids in our lives. They also make us curious about a part of the modern economy that we often take for granted.
The Grid
It is a giant net. There is no single point of entry or exit for electricity.
Think of a lake of water. Water is entering the lake from multiple streams. And multiple consumers are pumping water out of the lake.
It’s something like that.
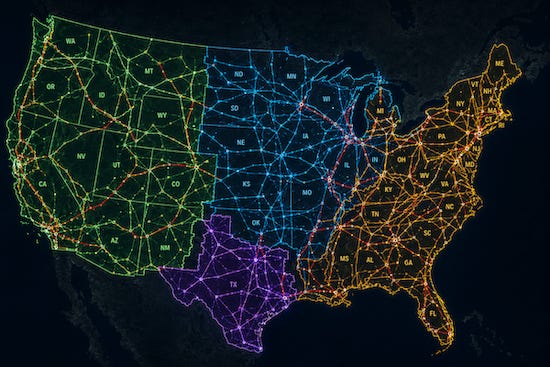
The grid has many different power producers all contributing electricity to the system. And various consumers take out this electricity and consume it.
Electricity is produced at a certain voltage.
Its voltage is increased for sending over long distances. This is done because it is more efficient. Sending low-voltage electricity over long distances results in more power loss.
Then, at the destination, its voltage is lowered because the high voltage is too dangerous to be sent to homes, shops, and offices.
Once the voltage is brought down, it can then be distributed to various consumers.
For the system to sustain, the frequency needs to be within certain limits. If the frequency falls below the limit, there is a power cut.
If it increases above a certain limit, the power is cut or controlled to prevent overwhelming other parts of the grid.
Since there is no storage in the grid system, power consumed must be roughly equal to the power produced.
In recent times, many battery systems are being incorporated in the grid. So grids are starting to add storage (battery).
When demand for power goes up, the frequency starts falling. That’s when power producers start making more power. And vice versa.
This is why whenever there is a drastic change in frequency, parts of the grid automatically shut down (using breakers and relays). It is intended to prevent damage and contain the spread of a disturbance.
The voltage is stepped down in stages since different consumers require different voltages of electricity.
Example: factories need higher voltages than homes and offices.
Parts of Grid: Fuel Supplier
There are many different sources of electricity. Many come from burning some kind of fuel.
Companies that find, gather, and supply the fuel form the very first layer in the grid.
So, coal mining companies, oil and gas companies, uranium mining companies, etc.
Of course this layer of companies does not exist in the case of renewable sources like wind, solar, and hydroelectricity.
The thing to understand about these companies is that they are not dedicated to the grid.
Most companies that are digging for coal or oil & gas are doing so for all sorts of customers, not just power plants.
Parts of Grid: Power Generation
These generate the power.
They run thermal power plants (coal), gas turbine plants, hydroelectric dams, nuclear power plants, wind farms, etc.
This sector has many companies specializing in one kind of power generation. So some companies stick to hydroelectric power only, some stick with coal, etc.
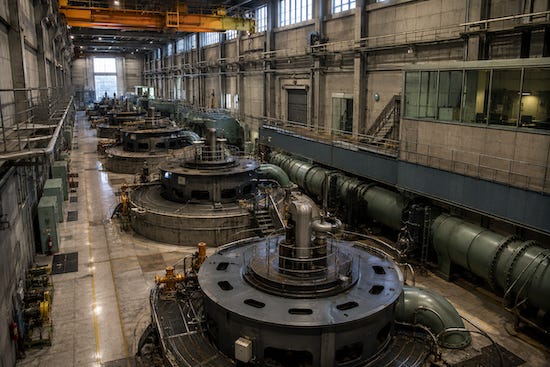
The ability to produce power is measured in megawatts (MW) or gigawatts (GW). Where 1 GW = 1,000 MW.
Power generation companies have something called installed capacity. This is the designed output of the facility.
Many plants produce electricity that is under the capacity. Only during high demand periods does the plant reach full capacity. This is true for thermal plants and gas plants. Many other types always operate at capacity all the time.
Power generation companies often report their total capacity by adding all their plants’ installed capacity. This gives an idea of how big the company’s operations are.
Many companies also report capacity that is under construction or even planned but not started.
MWh (megawatt-hours) or GWh are units to measure the actual electricity generated by a plant over a period.
Plant Load Factor (PLF) and Capacity Utilisation Factor (CUF) help understand how much of a plant’s capacity was actually used.
In each type of power producer, there are metrics that measure the efficiency of the process. Example: thermal power plants use thermal efficiency as a measure of efficiency of the plants.
Then we have power transmission companies.
These companies transmit the power that’s generated over large distances.
So it is their job to increase the voltage of the electricity and send it over long distances.
In India, this field is dominated by one very large government-owned company, though there are other players in the space as well.
In India, distribution of power is primarily done by DISCOMs (Distribution Companies) that are predominantly government owned and operated.
These DISCOMs are responsible for the last mile of power distribution. They maintain the wires, poles, transformers, etc along with taking care of meter installation, billing, etc.
Parts of Grid: Equipment
The list of companies in this space is enormous. Primarily because the equipment list itself is very vast.
Yes, there are companies operating in the space that make wires and cables (which is literally what a grid is made up of).
Electricity meters, fuses, relays, etc are all in this ecosystem.
One crucial link in the equipment list is the transformer. And this space is one to watch out for.
Transformers are the devices that change the voltage of electricity. So they are a part of the grid from the power plant to the end-consumer.
Transformers that increase voltage are called step-up transformers; those that decrease it are called step-down transformers.
This is how the voltage changes across the grid.
+Power generation at plant terminal: Output at 11–25 kV
+Generator step-up transformer: 11–25 kV to 400 kV
+Bulk transmission substation: 400 kV to 220 kV
+Sub-transmission substation: 220 kV to 132 kV
+Regional distribution substation: 132 kV to 33 kV
+Primary distribution substation: 33 kV to 11 kV
+Local distribution transformer: 11 kV to 415 V
+End-consumer supply: 230 V or 415 V
Every time the voltage changes, a transformer is involved.
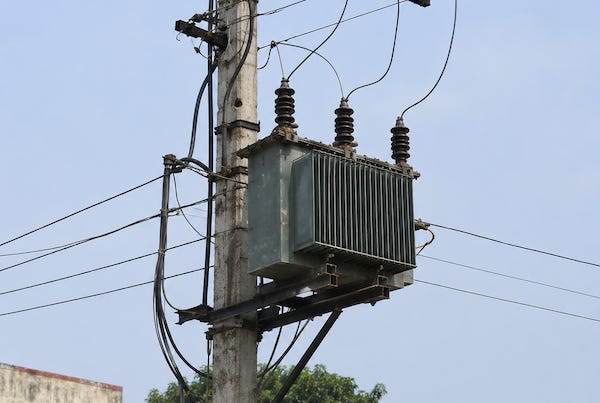
Transformers obviously come in various sizes and shapes.
There are quite a few transformer makers in India. Similar to many industries, the smaller, lower capacity transformers are easier to make. And thus, there’s more competition in that space.
The larger ones are more difficult to make and there’s less competition there.
When we say “bigger” we mostly mean the transformer’s ability to handle more power through it (measured in kVA or MVA). Of course, handling higher voltages requires more complex engineering than lower voltages.
Obviously there are a ton of different equipment involved other than those listed above. Many of them are made by the same group of companies.
These are things like breakers, towers & poles, capacitors, batteries — this list is very long.
India’s Power Game
Why are we talking about this sector?
Well, it started with our research into data centres. Many are being built in India and they’ll need a lot of power.
But then we realised that India is on a mission to expand its power capacity and that this sector needed to be looked at independently.
India’s peak electricity demand as of 2026 was about 270 GW. India is projected to have a peak demand of ~340 GW by 2030, and ~440 GW by 2035.
This is going to require a massive amount of everything.
Those of you who follow this sector closely would be right to point out we haven’t covered many sectors in this report, like the companies involved in building the plants themselves.
Further, each type of power source has multiple layers. For example, nuclear power has tons of different types of companies right from miners, to refiners (not actually called that in the industry), to suppliers, and equipment makers, and so on.
This sector is so vast, it cannot be covered in one write-up.
We’ll keep adding more reports on this sector in the future.
Quick Takes
+ India’s industrial production grew 5.1% year-on-year in May (vs 4.9% in April). Manufacturing production rose 5.5% (vs 6.1% in April).
+ The government has extended the customs duty exemption on key imported petrochemicals until 15 July 2026 to keep supplies stable and help manufacturers and consumers.
+ The government has lifted temporary fuel sale restrictions from 1 July, allowing bulk buyers to resume normal purchases as fuel supplies have stabilised. The restrictions, introduced on 12 June, had capped diesel sales at retail outlets at 200 litres per customer/vehicle per day.
+ Indian Railways has approved three projects: Rs 499 crore for doubling the 44.40 km Mansi–Saharsa section in Bihar, Rs 432 crore for Electronic Interlocking at 27 stations/cabins in Asansol Division, and Rs 200 crore for laying 48-fibre OFC over 1,696.2 route km across South Eastern Railway.
+ The government has kept interest rates on all small savings schemes, including PPF and NSC, unchanged for the ninth straight quarter from July to September 2026.
+ India’s manufacturing PMI fell to 54.2 in June (vs 55.0 in May). This means manufacturing activity rose less in June than in May.
+ India’s gross GST revenue rose 13.9% year-on-year to 1.95 lakh crore in June. Net GST revenue rose 11.2% to 1.62 lakh crore.
+ The government approved Rs 7,145.14 crore for the construction of a 117.7 km access-controlled Kanpur-Kabrai section of the NH-34 greenfield highway in Uttar Pradesh.
+ The government approved Rs 6,969.67 crore for the construction of an 8.1 km, 6-lane road tunnel (NH-148AE) in Delhi.
+ India and Japan signed a Memorandum of Cooperation (MoC) with an investment of $10 billion in AI, semiconductors, clean energy, and economic security.
+ Carlsberg has filed draft papers with SEBI for an IPO through the confidential route.
+ India’s composite PMI fell to 57.1 in June (vs 59.3 in May). Services PMI fell to 57.4 (vs 59.8 in May). This means overall economic activity grew less in June than in May.
+ India’s forex reserves fell by $5.65 billion to $666.93 billion in the week that ended on 26 June.
The information contained in this Groww Digest is purely for knowledge. This Groww Digest does not contain any recommendations or advice.
Team Groww Digest