

In 1989, Berkshire Hathaway began buying shares of Coca-Cola.
Over the next few years, Warren Buffett invested about $1.3 billion into the company. It wasn’t a startup. It wasn’t unknown. It was already a global brand.
So why did he put such serious money into a soft drink business?
Because Buffett wasn’t just looking at sales growth.
He was looking at the economics of the business.
Coca-Cola did not need to constantly pour billions into new factories just to survive. It did not require heavy reinvestment every year to defend its position. The brand, distribution network, and pricing power did most of the work.
For every dollar of capital the company used, it generated strong profits.
Now contrast that with airlines. That is an industry Buffett had criticised for decades. Airlines required massive investment in aircraft, maintenance, and infrastructure. Competition was intense. Pricing power was weak. Even after investing enormous capital, returns were often disappointing.
Both were large companies.
But one turned capital into cash far more efficiently.
And that brings us to a practical question.
Most investors don’t have Buffett’s instinct or decades of experience.
But the principle he used is measurable.
He preferred businesses that earned high returns on capital.
In simple words, companies that could take Rs 100 and reliably turn it into Rs 20 or Rs 25 year after year — without needing more money.
That is what people loosely call “quality.”
But instead of leaving it vague, finance gives us two tools to measure it:
To see how this works, imagine a simple example.
Suppose shareholders have invested Rs 100 into a company.
If the company earns Rs 20 in profit, that means it generated a 20% return on the owners’ money.
That is ROE.
It tells us how effectively management is using shareholders’ capital.
Now consider a slightly different situation.
Many businesses don’t run only on shareholders’ money. They also borrow.
So imagine the company uses Rs 100 of shareholders’ capital and Rs 100 borrowed from a bank. Now it is operating with Rs 200 in total.
If it earns Rs 30 in operating profit, then the relevant question becomes:
How efficiently did it use the entire Rs 200?
Rs 30 on Rs 200 is 15%.
That is ROCE.
ROCE measures how well the business generates operating profit from all the long-term capital it uses — equity plus debt.
Both metrics are trying to answer the same underlying question:
If you give this company Rs 100, how much profit does it produce?
And more importantly, can it keep doing that consistently?
Together, they help investors judge whether a company is merely growing or actually compounding capital efficiently.
To answer that, we needed to define what “high” really means.
Because saying “anything above 15% is good” sounds neat, but it ignores a basic reality: different sectors operate under different economics.
An IT company can scale revenue without building massive factories. An FMCG company benefits from brand power and distribution strength. Naturally, these businesses often earn structurally higher returns on capital.
On the other hand, sectors like telecom, power, oil & gas, and heavy manufacturing require enormous investments in infrastructure. Even well-run companies in these industries may operate at lower return levels simply because of the capital intensity of their business.
So comparing all companies using a single flat benchmark would be misleading.
So we used a sector-adjusted framework.
Step 1: Use the right return metric for each sector.
ROE was used for Financial Services, IT, and FMCG — sectors where equity efficiency is the key driver.
ROCE was used for all other sectors, where total capital employed gives a better picture of operating efficiency.
Step 2: Focus on consistency, not one strong year.
Returns can spike temporarily due to cycles, especially in metals, energy, and commodities.
To avoid capturing short-term peaks, we used each company’s 5-year average ROE or ROCE as the primary measure.
Step 3: Compare against a sector benchmark.
For each sector, we defined a reasonable “healthy” return level based on long-term industry norms.
A company qualified only if its 5-year average return exceeded that sector benchmark.
This ensures a fair comparison.
A power company is not expected to generate FMCG-level returns.
But an FMCG company should not qualify as “high quality” with a return that is merely average for its own industry.
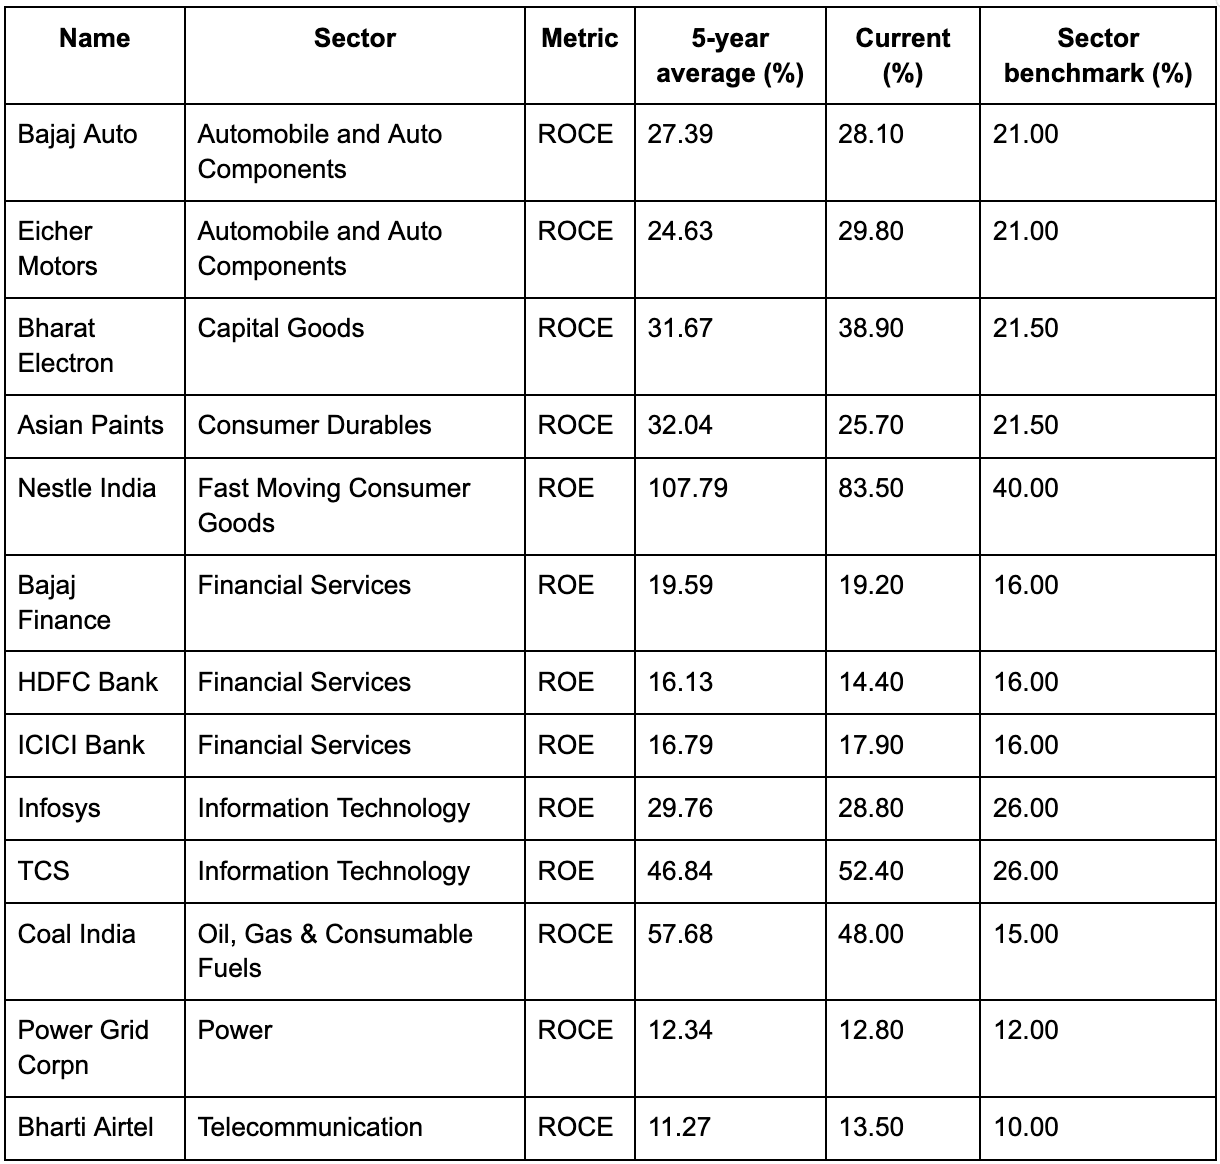
The final shortlist: 13 Nifty 50 stocks that cleared the bar
The 13 companies qualified because they met three strict criteria:
The correct metric was used for each sector — ROE where equity efficiency matters, ROCE where total capital efficiency matters.
We used the 5-year average ROE or ROCE to capture sustained performance, not a one-year spike.
Each company’s 5-year average had to exceed a sector-specific benchmark (benchmarks based on standard finance definitions and historically observed return ranges).
Note: IT and FMCG are capital-light and typically show higher structural returns; telecom, power and other capital-heavy sectors typically show lower structural returns. Only companies that were genuinely strong relative to their sector passed the filter.
High ROE/ROCE shortlist
The Study: What the Numbers Actually Say
Let us put this to the test with real money and real time.
The setup: We ran a fixed monthly SIP of Rs 10,000 in these 13 stocks, split equally per stock, starting from December 2014 and continuing every month until December 2025. That is 133 monthly installments.
On the other side, we ran an identical Rs 10,000 monthly SIP in the Aditya Birla SL Nifty 50 Index Fund (Direct, Growth), which is one of the oldest and most widely tracked Nifty 50 index funds over the same period.
Both portfolios started with the same money, on the same dates, for the same duration. The only difference was what that money bought.
Results across 133 months (Dec 2014 – Dec 2025):
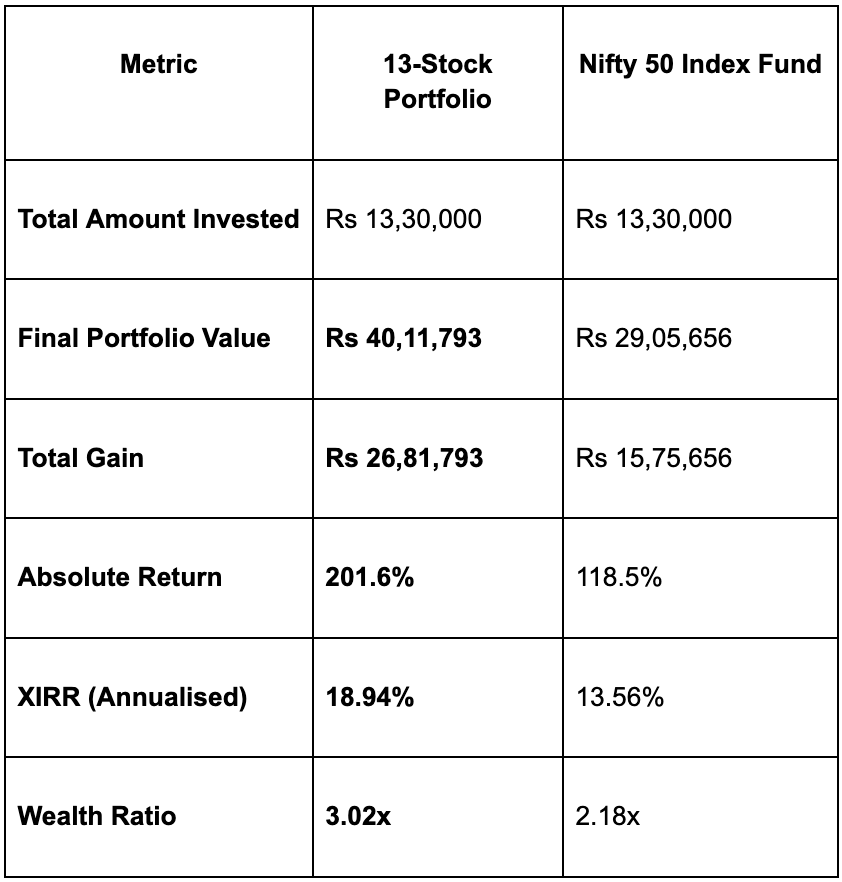
The high ROE/ROCE portfolio turned Rs 13.3 lakh into Rs 40.1 lakh. The Nifty 50 index turned the same Rs 13.3 lakh into Rs 29.1 lakh.
That is a difference of Rs 11.06 lakh in final wealth, from the exact same monthly investment, over the exact same period.
In annualised terms, the gap is 5.38% XIRR. That might not sound dramatic. But compounded over 11 years of SIP, those extra percentage points are the difference between creating Rs 15.7 lakh of wealth and creating Rs 26.8 lakh of wealth.
How did individual stocks perform?
Not every stock was a winner. That is an important thing to say.
Here is how each of the 13 stocks performed on XIRR over the full period, ranked highest to lowest:
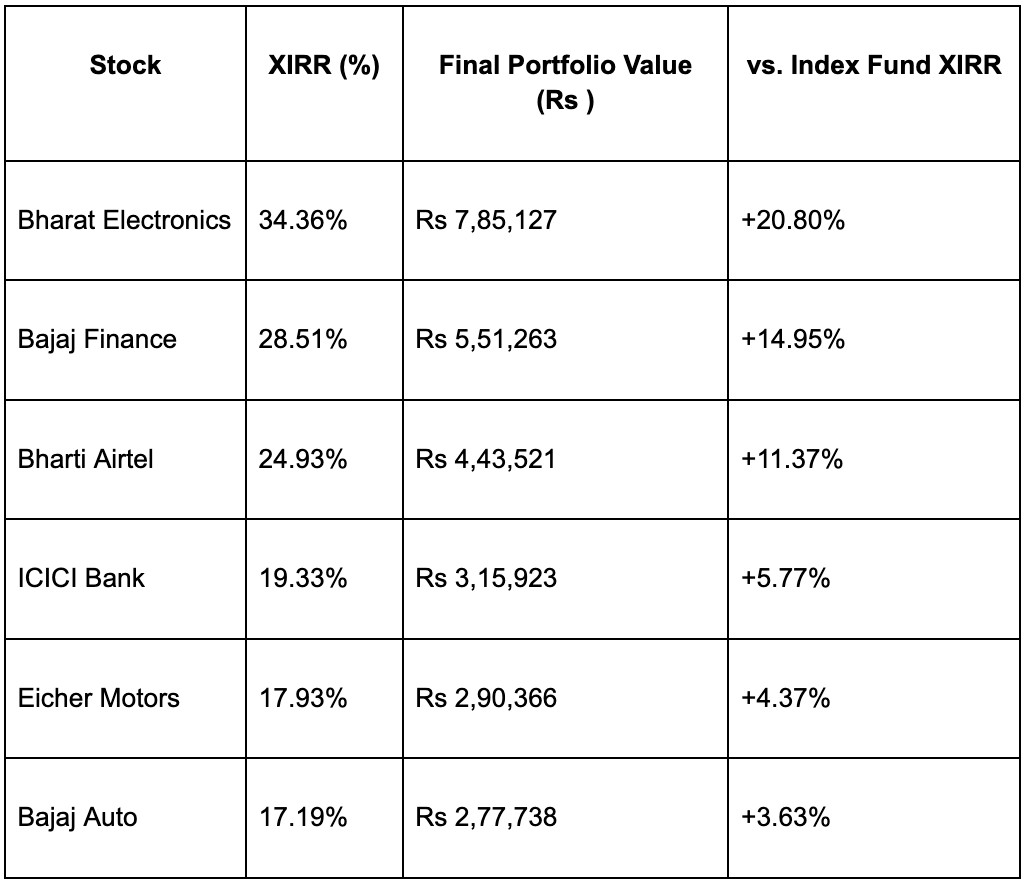
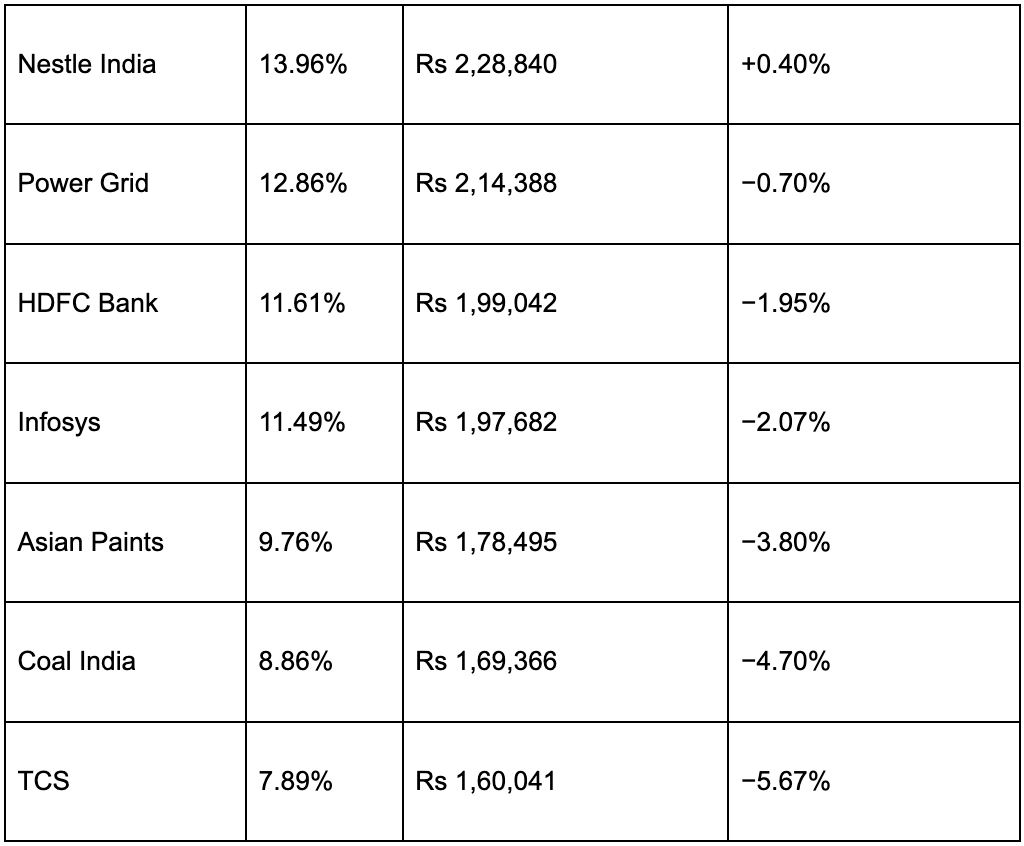
(Each stock received a Rs 769.23/month SIP for simplicity. The “vs. Index Fund XIRR” column shows each stock’s XIRR minus the index fund’s 13.56% XIRR)
A few things immediately stand out.
The top three, Bharat Electronics, Bajaj Finance, and Bharti Airtel, did the heavy lifting. Bharat Electronics alone generated a final value of Rs 7.85 lakh from a Rs 769 monthly SIP. That is a 34.36% XIRR over 11 years, which is exceptional.
Some well-known “blue chips” actually underperformed the index. TCS, Infosys, Asian Paints, Coal India, and HDFC Bank all delivered lower XIRR than the Nifty 50 index fund. This is a reminder that even “quality” companies are not immune to valuation cycles, sector headwinds, and stagnant stock performance over certain periods, even if their businesses remain fundamentally sound.
Power Grid, ICICI Bank, and Nestle roughly matched the index, with modest positive or negative performance.
The portfolio wins not because every stock won, but because the ones that won, won big enough to carry the overall portfolio ahead of the benchmark.
A note on what this study does and does not tell us
This is a backtested, hindsight study.
We are not predicting that the same 13 stocks will outperform the index over the next 11 years. ROE and ROCE are useful filters, but they are not crystal balls.
What this study does tell us is that a simple, rules-based filter, “pick only companies that are genuinely efficient at turning capital into profit, compared to their own sector’s standards” would have given a long-term, disciplined SIP investor meaningfully better results than a passive index over an 11-year period.
Conclusion
The answer, at least over the considered period, is: you do noticeably better.
Not because you got lucky, and not because you picked obscure small-cap stocks. These are all large, well-known Nifty 50 companies. The only thing different was the filter applied before buying.
By insisting that each company in the portfolio must earn returns that are genuinely high relative to its own sector, using the right profitability metric for that sector, averaged over 5 years to filter out one-time spikes, the portfolio delivered an 18.94% XIRR versus 13.56% for the Nifty 50 index fund.
That gap of 5.38% XIRR translated into Rs 11 lakh more wealth from the same Rs 13.3 lakh invested.
There is a deeper lesson here too. “Buy quality” is advice that gets thrown around constantly in investing circles, often without much substance behind it.
Quality means capital efficiency, measured consistently, compared fairly within each sector.
And when quality is defined that way, and when you simply stay invested, the data suggests it might turn out to be worth the extra step of thinking before buying.
Is there a reference for benchmark ratio levels??
This study has surviorship bias as you knew these stocks survived but there were many in Nifty 50 historically since 2014 which are no longer part of the index.