

Many believe that low-debt companies are always safer investments and will deliver higher returns and that high debt means a risky, weak company.
Some refuse to touch high-debt companies. Others believe leverage is how big businesses grow faster.
But does the amount of debt a company has… actually decide how well the stock performs in the long term?
To find this out we ran an experiment.
Instead of relying on assumptions, we set out to see what would have happened if an investor in 2015 had chosen stocks using only one rule — the company’s debt level at that time.
The Experiment
We started by using the Nippon India Nifty 100 index fund as our base universe. This gave us a ready-made, well-diversified list of the biggest 100 NSE-listed companies across all major sectors as they stood in 2015.
From this list, we kept only companies that were listed and traded throughout the full 10-year period (2015-2025).
And excluded companies that were merged, delisted, or no longer existed as separate entities during this period, because their price history could not be tracked consistently.
This process gave us a clean final set of companies that could be studied fairly across the entire decade without ambiguities.
For every company in the list, we collected the debt-to-equity (D/E) ratio.
Debt-to-equity is a ratio used to check how much debt the company uses compared to the shareholder capital.
Low D/E: Company uses little or no borrowings
Medium D/E: Company uses normal levels of debt
High D/E: Company depends heavily on borrowed money
Investors often use D/E as a key rule for judging company debt levels.
Using each company’s debt-to-equity ratio in 2015, we first divided all stocks into 3 categories:
low-debt companies with little or no borrowing,
medium-debt companies using moderate debt, and
high-debt companies carrying heavy borrowings.
Next, we tracked the stock price of all those companies from 1 April 2015 to 1 April 2025 and calculated the 10-year CAGR for each stock to measure its long-term performance.
This let us see clearly whether companies with higher or lower debt delivered better real-world returns.
The Results
When we compared stock performance across all 3 debt groups: low, medium, and high, there was no clear pattern at all.
Every group showed the same kind of results: some companies delivered very high long-term returns, many delivered average returns, and some delivered very low returns.
This mix appeared in every category, regardless of how much debt the companies carried.
The idea that “debt level tells us it is a good investment for the long run, and the company is a good thing to invest in for the long run” completely fell apart when tested against real data.
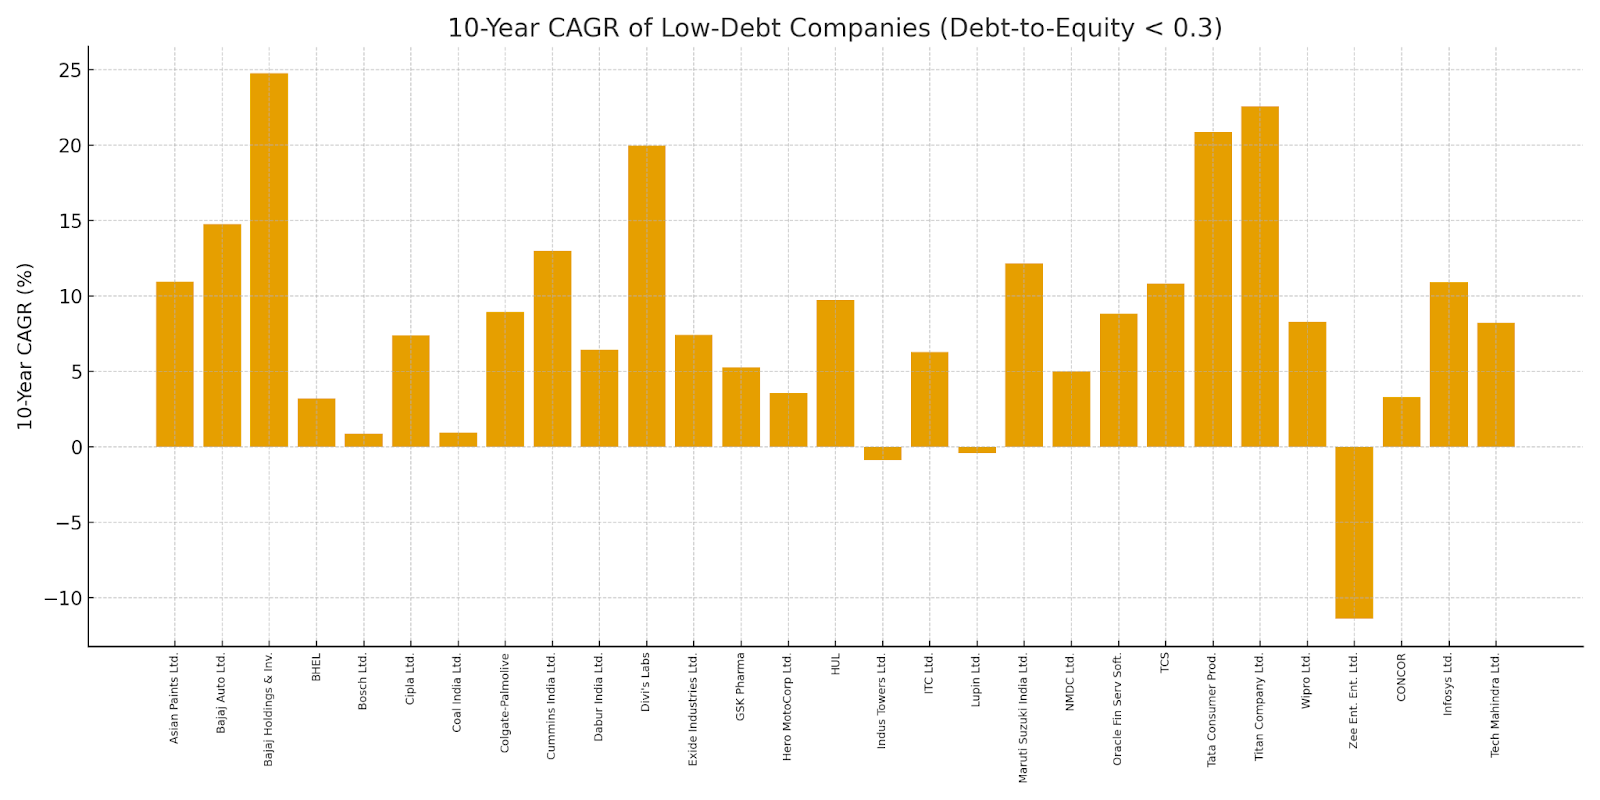
Low-debt group
It showed a very wide range of outcomes. Some companies (like Asian Paints, HUL, TCS, Titan, and Dabur) delivered strong long-term returns and consistent compounding.
But in the exact same bucket, we also found companies such as Coal India, NMDC, Colgate, and Bosch that barely grew over the past 10 years.
So low debt clearly did not guarantee strong returns. The category included both high-return and low-return stocks together.
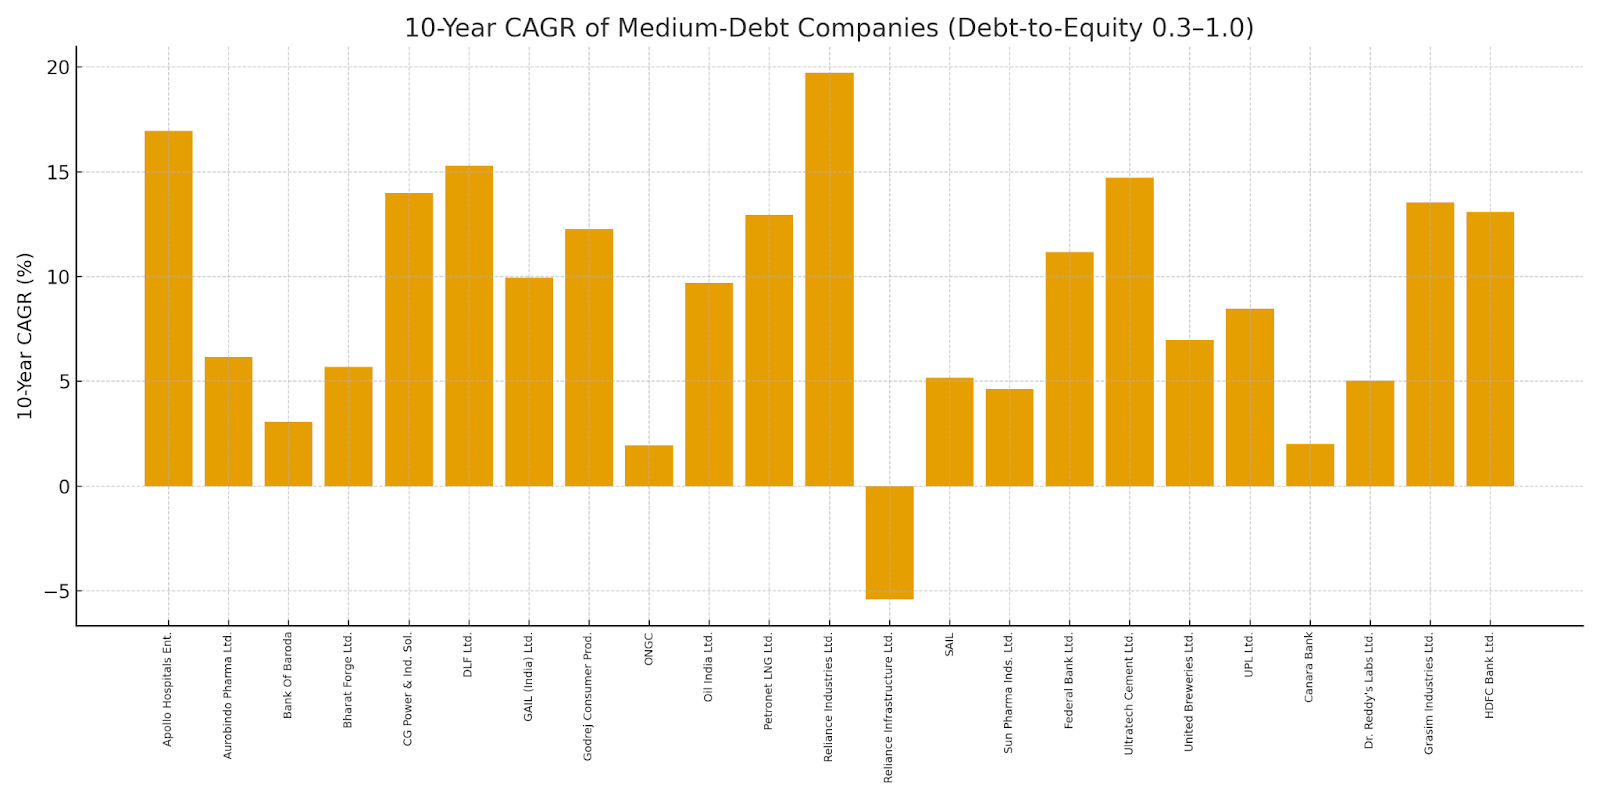
Medium-debt group
This group behaved almost the same way.
Some companies, such as Ultratech Cement, Apollo Hospitals, etc, produced healthy long-term returns.
But others in the same category generated only average or below-average returns.
Once again, this group also included both relatively high and relatively low performers.
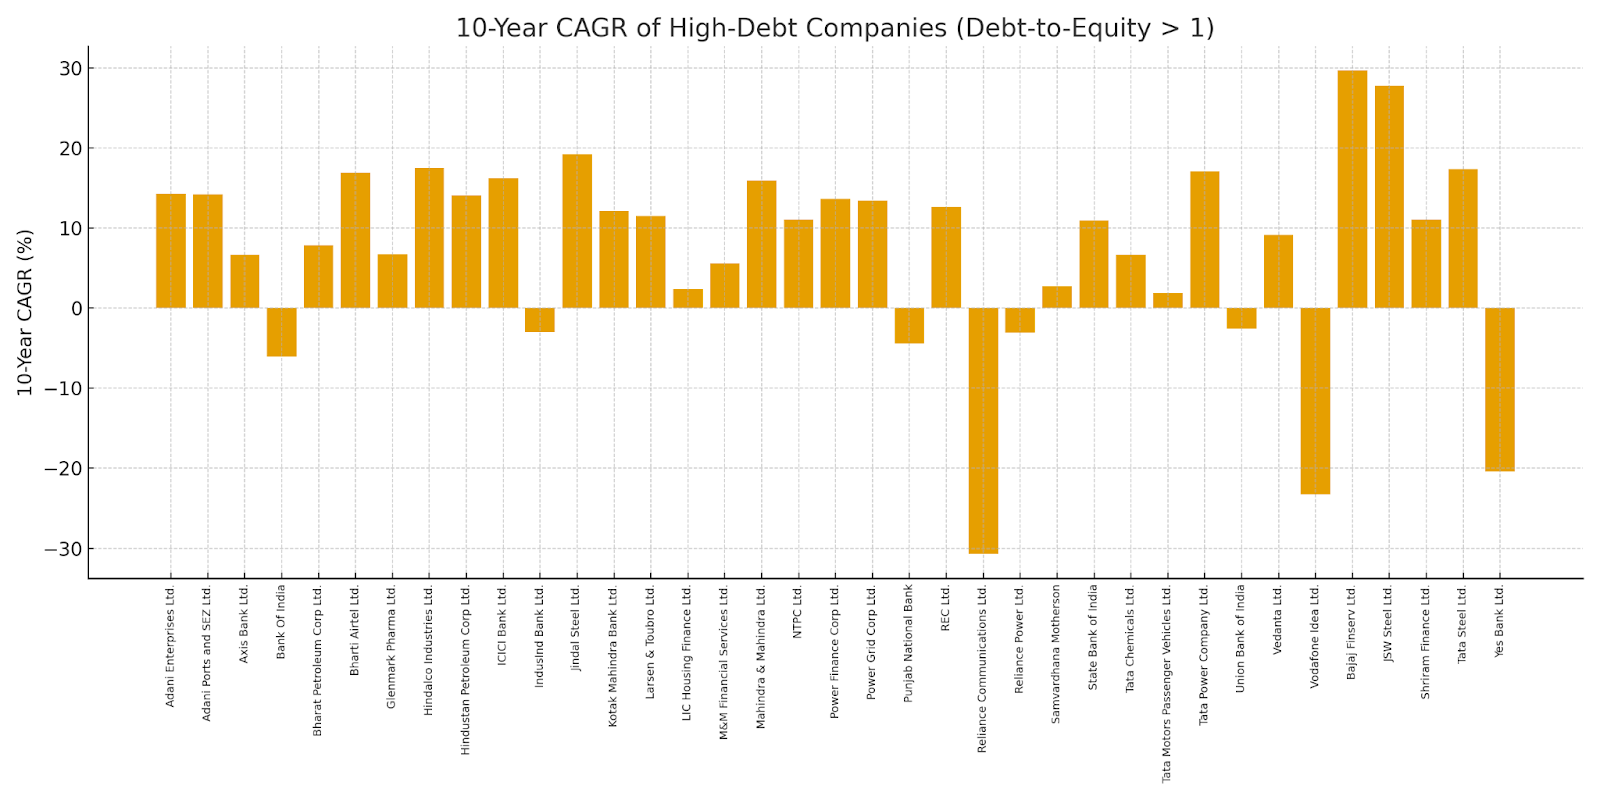
High-debt group
This also produced a mixed outcome.
Companies like Adani Enterprises, Adani Ports, JSW Steel, Tata Motors, and Power Grid showed high growth over the decade.
But this same group also had some of the lowest return outcomes, including Vodafone Idea, Reliance Communications, and Reliance Power.
In other words, high-debt companies showed both very high returns and very low returns.
Conclusion
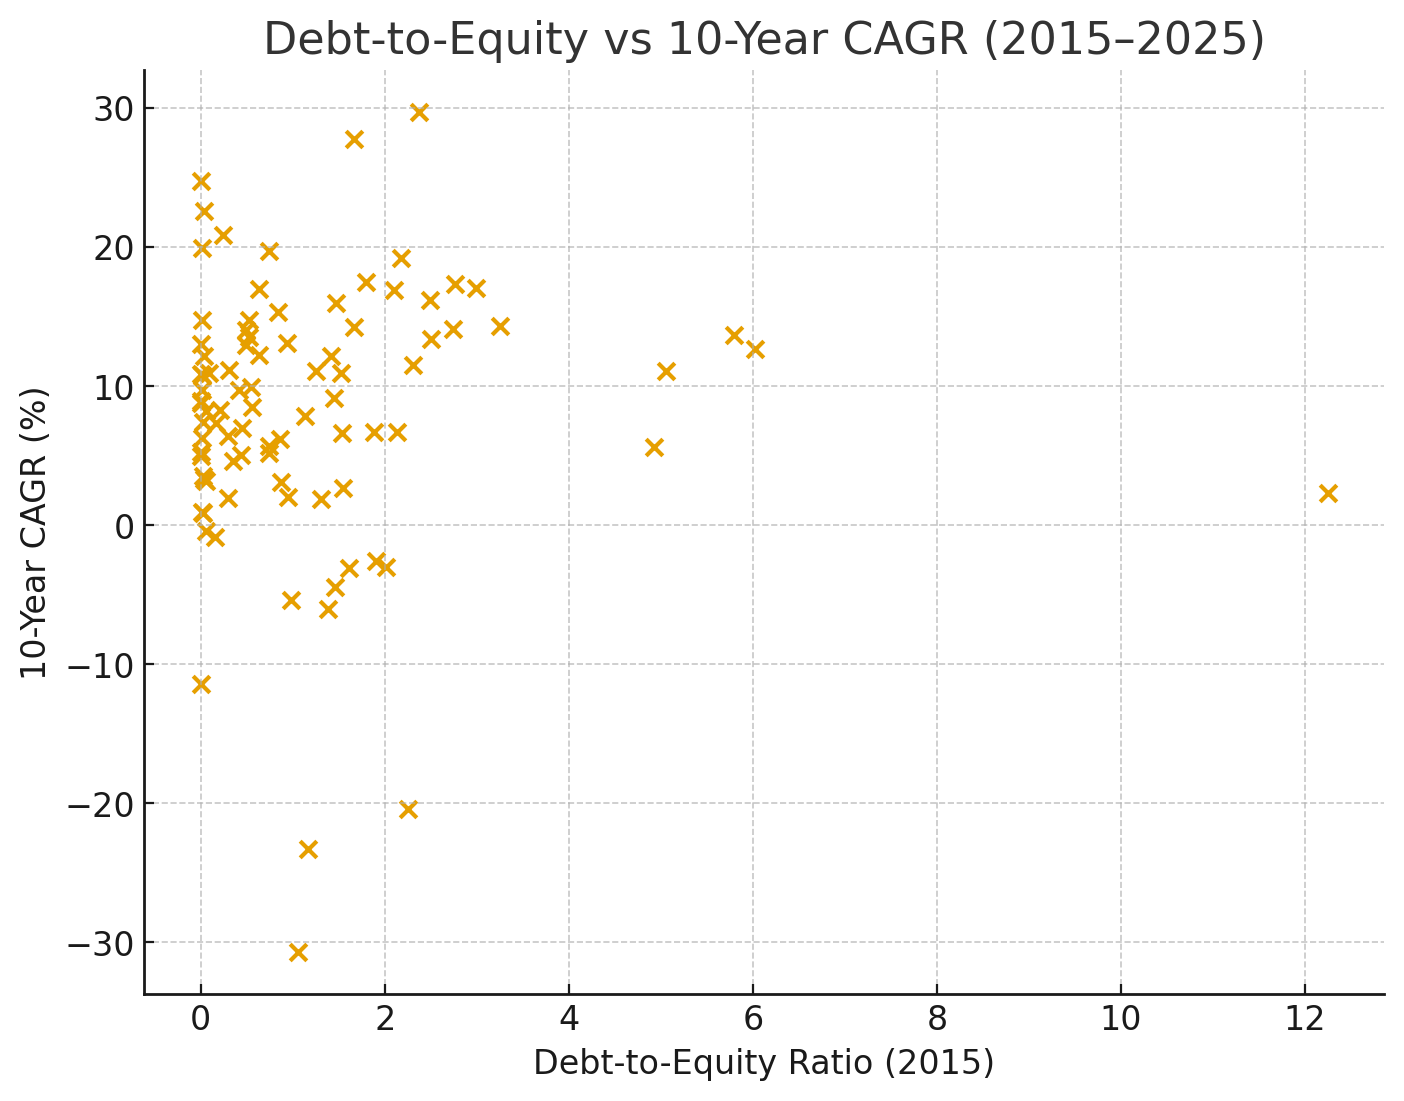
When you put all the companies together in one scatter plot: debt-to-equity on one axis and 10-year CAGR on the other, the result becomes visually clear too.
The dots form a completely random cloud. There is no upward trend, no downward trend, and no clustering at any debt level. Companies with high debt show both very high and very low returns. Companies with low debt also show both strong and weak returns. The same full range appears in the medium-debt group as well.
They remain mixed together with no pattern.
This makes it clear that debt alone doesn’t tell you how a stock will perform.
Any company has to be judged with many factors and investor need to understand the industries of different sectors and their prospect of their current business/es and plans for immediate/future growth in next 3/5 years as well as able to relate them with evolving national policies and international geopolitics. Investment is more complicated for people below the 10% very rich investors and the segment of rich investors.
I invested in a company with 0 debt, surplus cash, continue dividend paying. A biggest mistake in my journey. I still hold this stock - to remind me.
Vakrangee bought 7 year ago.