

Are bigger companies always a safer bet?
Some companies feel like they’ve been around forever. So much so, that they almost feel almost too big to fail.
Companies like Reliance, Tata, and HDFC are not just market players. They have also played a major role in the growth of the Indian economy for decades. Even in the stock markets their long term growth has been strong, with CAGRs above 10%.
Equity markets are often volatile, no doubt.
But for an investor, it’s easy to see why money would gravitate toward these giants. They feel like a safer bet.
Think about it: they are large businesses, strong brands, and have a long track record. They are large cap stocks which also means that they won’t face as much volatility as small or mid cap stocks.
And yet, debt funds exist. Millions of investors still choose this predictable, slow lane.
This leads to a simple question:
When companies this big have stayed in the Nifty 50 for 20 years and have given such strong long-term returns, they should be considered safe, right?
So why do investors still put money into debt funds that have given only around 6% CAGR when equity from these same large companies has historically delivered more than 12% CAGR or more?
Why choose slow and predictable returns when the biggest companies seem both familiar and rewarding?
To understand this, we looked deeper.
The Experiment
Currently the top 5 companies in the Nifty 50 are:
Reliance Industries
HDFC Bank
Bharti Airtel
TCS
ICICI Bank
Predicting the future performance of these stocks is impossible. So, we looked at the historical returns using adjusted prices (accounting for bonuses, stock splits and dividends) of the current top 5 Nifty 50 companies over a 15-year period (January 2011 to December 2025).
To see if ‘big’ stocks mean ‘consistent’, we compared them to a debt fund: the ICICI Prudential Gilt Fund.
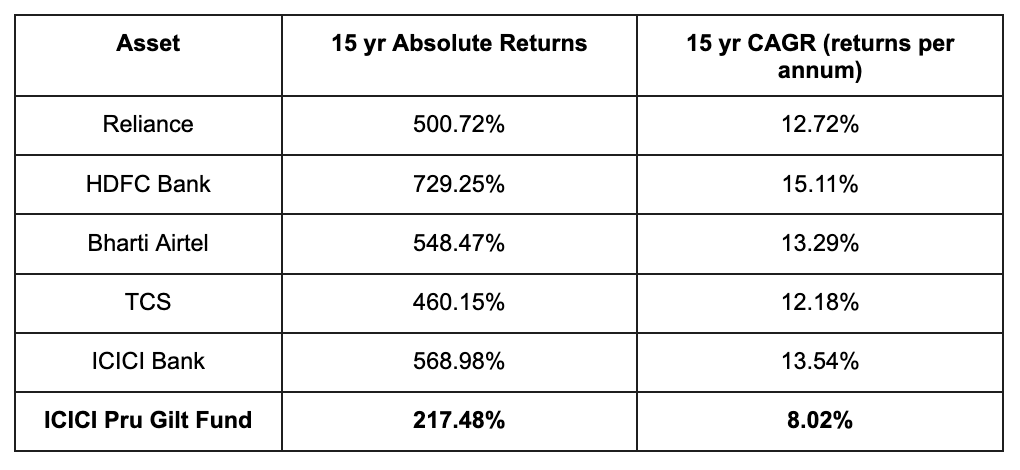
If an investor bought these stocks in 2011 and let the money grow for 15 years, the returns are significant. Over the long haul, the ‘giants’ did exactly what they were supposed to do — they built massive wealth, giving a steady return of 12-15% CAGR.
On a 15-year chart, equity crushed debt, by quite a significant margin.

But not all investors stay invested for 15 years.
Let us look at smaller timelines too
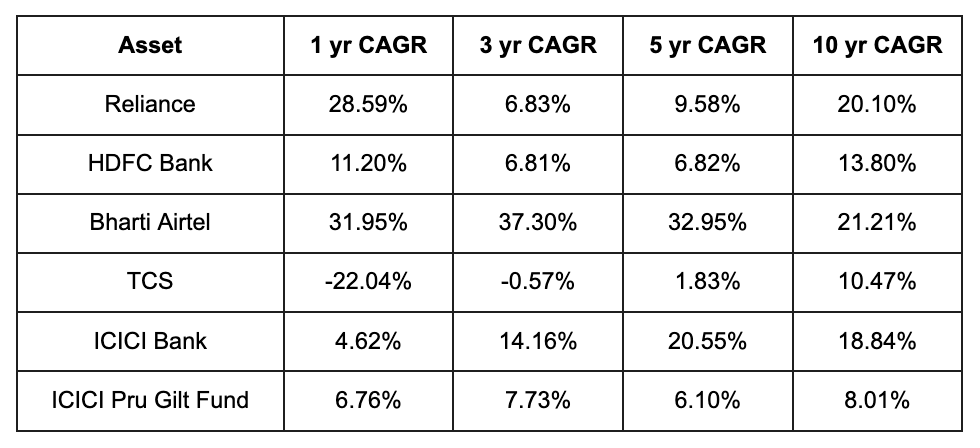
The picture looks a bit different here. Returns over smaller time horizons have varied massively.
Reliance looks impressive at first glance, especially over the last year. But its returns over the 3-year and 5-year periods have been muted compared to its 15-year CAGR.
Airtel is the outlier in this table, having given great, consistent returns over almost all these recent time periods.
Both banks, HDFC and ICICI, have the lowest 1-year returns on the list, likely due to shifting interest rate cycles and banking sector headwinds. While ICICI has been a star over the 5 and 10-year marks, HDFC seems to have struggled to keep that same pace.
Despite being a global IT giant, TCS delivered negative returns over 1 and 3 years and barely moved across 5 years. For an investor who put money into TCS in 2021, their wealth grew just 1.83% annually, less than a basic savings account.
On the other hand, for the debt fund, returns have stayed lower than equities but always steady around 6-9% over all time periods.

Equity Returns are never Smooth
Equity market returns don’t grow linearly.
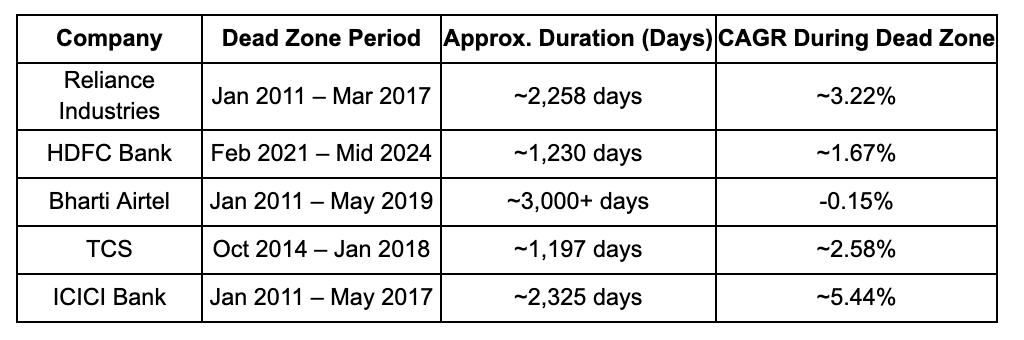
If you look at the history of these current top Nifty 50 companies, every single one of them has gone through a ‘Dead Zone’, a period where the stock underperformed for years.
For our study, we defined this as the longest period where the stock’s CAGR stayed below 6%, roughly what a basic debt fund or fixed deposit would deliver.
Here’s what 15 years of data reveals for the current top Nifty 50 companies:
Reliance Industries
Between roughly 2009 and 2017, the company famously went through what analysts call a ‘Lost Decade.’ The stock stayed trapped in a horizontal range.
This period coincided with massive structural shifts and the incubation of ventures like Jio and Retail, where the company invested heavily.
For our analysis, we focused on data from 2011 onwards. From Jan 2011, to March 2017, Reliance spent 2,258 consecutive days in a Dead Zone, delivering a CAGR of just 3.22%.
These returns were lower than what a simple debt fund or an FD would have given annually.
But once the Dead Zone ended in 2017, Reliance’s returns exploded. The stock, which has stayed in a similar price range for such a long time, doubled in value in less than 2 years and has been growing significantly since then.
HDFC Bank
HDFC Bank has a long-standing reputation of being a safe stock. While not entirely wrong, this too faced a period of horizontal movement after the 2020 pandemic. From around Feb 2021 to mid-2024, a period of almost 1,230 days, the stock gave a mere 1.67% CAGR approximately.
This reflected the market digesting the massive merger with HDFC Ltd and concerns over loan-to-deposit ratios.
Bharti Airtel
From Jan 2011 to May 2019, over 3,000 days, Airtel delivered a CAGR of -0.15%, essentially hovering around the same price for a long time. There were ups and downs in between, but the CAGR remained low.
The reasons were a mix of regulatory fees, and the Jio-led price war and the then ongoing 2g scandal.
After years of stagnation around the same price (Rs 300), Airtel broke out and surged, growing massively in the last six years.
Tata Consultancy Services
From Oct 2014 to Jan 2018, around 1,197 days, TCS delivered a CAGR of just around 2.58%.
IT stocks in general have been facing a lot of volatility ever since the 2020 Covid 19 Pandemic as well as the global shift in the nature of IT services.
ICICI Bank
Between Jan 2011 and May 2017, a period of around 2,325 days ICICI Bank delivered a CAGR of just 5.44%.
This stagnation was largely driven by the Indian banking sector’s NPA crisis and RBI cleanups.
But after 2020, the stock broke out and has given good returns in recent years.
Remember, for the purpose of the study, we have taken into account the CAGR. This means, any occasional rise or fall in the stock price during these ‘dead zones’ have been smoothened over. We have tried to find out the longest period where the CAGR was below our threshold of 6%.
Focusing on these periods might seem like nitpicking, but that’s the point. Even the best stocks can deliver low returns for extended stretches. That doesn’t make the stock ‘bad’, but simply illustrates that equity growth is not linear.
Debt funds on the other hand, do not have this type of volatility. They do not give sky-high returns like a stock would, but they also don’t have periods of uncertainty.
Conclusion
Over the long term, equities clearly outperform debt. But the journey is rarely smooth.
With the giants of the Nifty 50, wealth is often created in short bursts following long stretches of slow growth. Those quiet periods test an investor’s patience and resolve. Even top-performing stocks can lag behind a simple debt fund or FD during these phases, and any urgent need to sell could lock in losses.
Debt funds provide stability and steady compounding, acting as a buffer during these flat phases. They preserve value.
Size can offer a safety net for the business, but not necessarily a shortcut for the investor. So while bigger companies can generate huge wealth, their size alone doesn’t guarantee short-term safety. For those who cannot stomach 2,000 days of low growth, debt funds prove to be a necessary anchor.
Limitations
Survivorship Bias: This study looks at today’s top 5 Nifty 50 companies. Historical returns may seem higher than if we had analysed the top 5 from 2011.
Adjusted Prices: Returns account for splits, bonuses, and dividends (Total Shareholder Return). Actual bank balance may vary if dividends weren’t reinvested.
Tax & Inflation: Returns don’t consider taxes. Real returns would be lower after adjusting for inflation.
Dead Zone: Defined here as CAGR <6%. Different investors may use other benchmarks.
Past Performance: Past returns don’t guarantee future results; structural challenges vary across companies and time.
Market Timing Risk: Returns shown assume the investor stayed invested continuously. Attempting to time the market could lead to very different outcomes.