

In March 2020, as news of a virus spreading across continents began turning into a global emergency, something unusual started happening.
Airports closed. Offices shut down. Stock markets fell. People were scared and unsure about what would happen next.
But even during all that chaos, some things did not stop.
Pharmacies stayed open. Grocery stores kept running. Trucks continued delivering food and supplies.
In fact, during times like this, people often buy even more essential items because they want to be prepared. They stock up on medicines, toothpaste, cooking oil, and packaged foods.
This shows something important.
When the economy slows down, people delay big purchases. They postpone buying houses. They avoid upgrading cars. They cancel travel plans. They cut down on extra spending.
But they don’t stop buying basic necessities.
The demand for essential goods might change a little, but it does not fall sharply. And this difference can also be seen in the stock market. Companies that sell essential products usually remain more stable compared to companies that depend on optional or luxury spending.
Over time, investors began grouping such businesses into what are commonly called “defensive sectors”
Defensive sectors are about needs, not wants.
People might skip buying a new phone or delay purchasing a car. But they still need medicines, basic food, hygiene products, and electricity.
Because people continue buying these essentials, companies in these sectors usually do not see a big drop in sales when the economy slows down.
Industries like pharmaceuticals, healthcare services, utilities, and FMCG (fast-moving consumer goods) fall into this category. Whether the economy is doing well or going through a slowdown, people still spend money on these basic items.
In the stock market, these companies are often called “low-beta” stocks.
Beta is simply a measure of how much a stock moves compared to the overall market. If the market goes up or down sharply, low-beta stocks usually move less in comparison.
If a stock has a beta below 1, it usually moves less than the overall market. Defensive stocks often fall into this category.
This means they may not rise as much when the market is going up strongly. But they also usually do not fall as much when the market is going down.
Because of this, many investors think of defensive stocks as a safer choice during weak or uncertain markets. The idea is simple: if markets fall, these stocks should fall less.
To see if this is actually true, we decided to study how defensive sectors behave using real data.
The Data We Studied
We analysed 10 years of daily market data, from October 2015 to December 2025.
That gave us a total of 2,543 trading days.
Out of these:
The Nifty 50 fell on 1,162 days
It rose on 1,373 days
We then narrowed our focus only to the down days. Especially the days when Nifty fell more than 1%, 2%, and 3%, along with the worst 10% of all down days.
Specifically:
Nifty fell 1% or more on 251 days
Fell 2% or more on 56 days
Fell 3% or more on 19 days
Then we checked how often each sector actually rose on those red days.
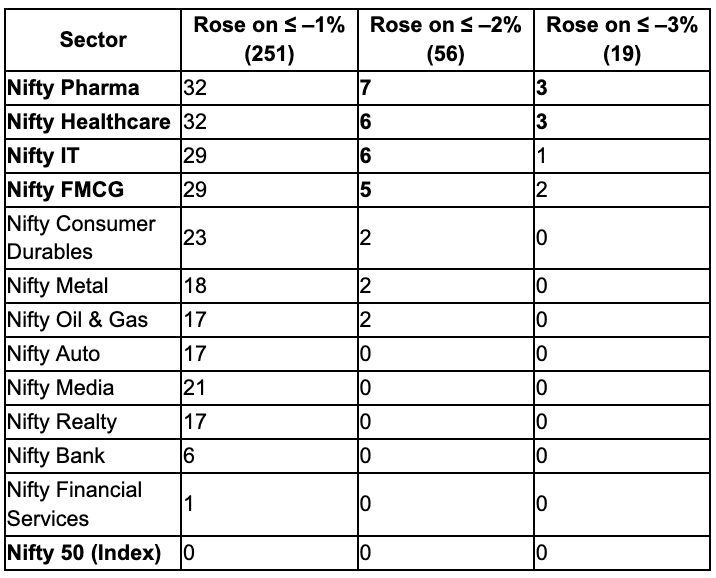
This table shows many times a sector rose (closed positive) on days when the broader market was falling sharply.
Pharma, healthcare and FMCG were positive more often on red days compared to most other sectors.
Banks, financials, realty, and similar sectors almost never turned positive during the fall days. In fact, in the most extreme days (-3% or worse), banks and financial services were never positive.
This suggests that on sharp red days, defensive sectors tend to hold up better than cyclical ones.
That was our first signal. So we decided to go deeper.
Study 2: Looking at Full Market Falls
Daily red days are short-term reactions. But what about full corrections and crashes?
To test that, we studied data from January 2010 to February 2026 (~16 years)
During this period, the Nifty experienced 23 distinct market falls of more than 5%. We labelled each of these as an “event.”
How we defined a “market fall”
We defined a market fall as:
The Nifty reaches a recent high.
Then declines,
And the drop from that high to the lowest point of that decline is at least 5%.
Each event is a clear “high to lowest point” window. Once the market starts recovering meaningfully, the next fall is counted separately.
What We Measured in Each Event
For each of the 23 market-fall windows, we measured 2 things for
Nifty 50 TRI
Pharma TRI
Healthcare TRI
FMCG TRI
High-to-low fall (%)
How much did each index fall during that same correction?Return from Jan 2010 to the lowest point (%)
If someone had invested in 2010 and simply held on, where would their portfolio stand at the worst point of that fall?
This helps us understand two things:
How painful the correction was in that moment
How much long-term wealth was affected
We grouped the 23 events based on how severe they were:
5%-10% falls
10%-20% falls
20%-50% falls
Then for each group, we listed the exact numbers for Nifty and each sector.
This clearly showed us when Pharma, Healthcare and FMCG behaved defensively and when they did not.
5% to 10% Market Falls
Out of the 23 times the market fell more than 5%, it declined between 5% and 10% on 12 occasions.
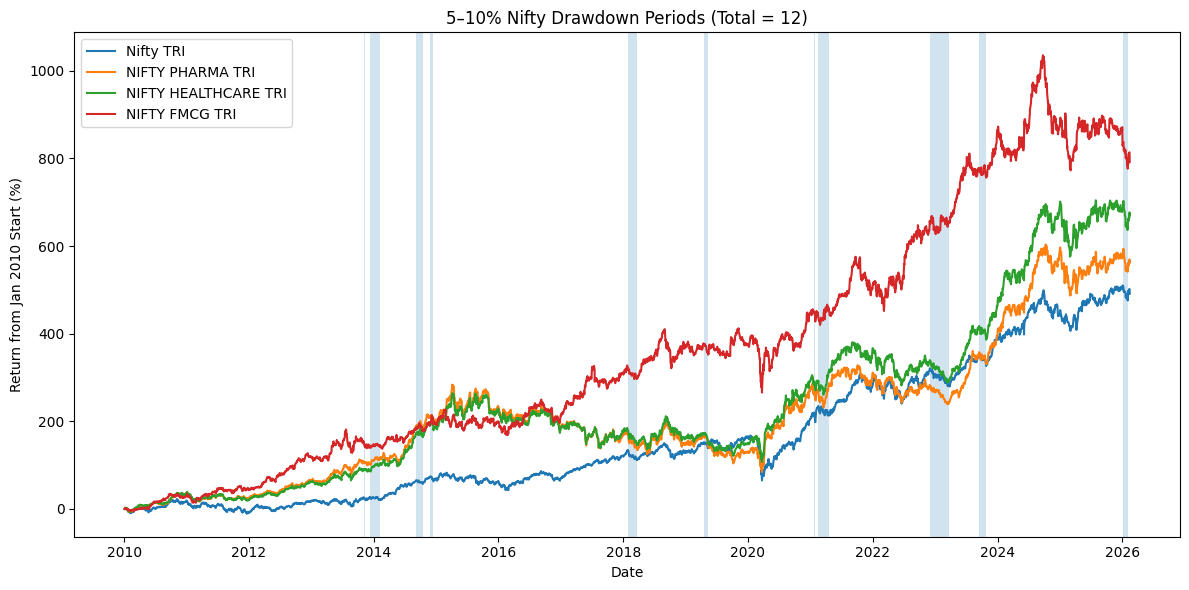
You can see the times highlighted in blue are the times the market fell between the range of 5% to 10%.
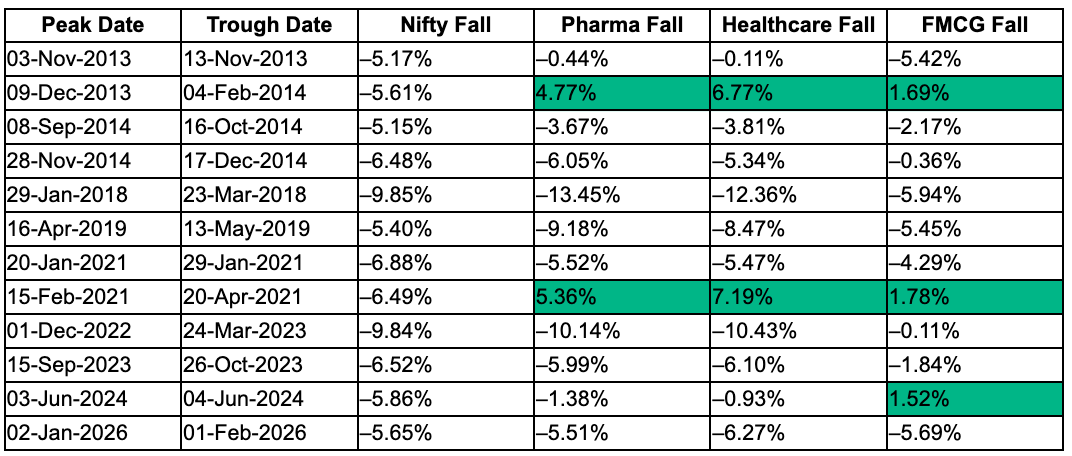
You can clearly see that, when we examine these 12 periods, the behaviour of defensive sectors is mixed but directionally supportive.
Pharma fell less than the Nifty 7 times.
Healthcare fell less than the Nifty 8 times.
FMCG fell less than the Nifty 9 times.
This means that more often than not, these sectors did provide relative downside cushioning during small corrections. In a few instances, Pharma, Healthcare, or FMCG were even positive while the Nifty was falling, indicating that defensive rotation does occur at times.
But the protection was not consistent.
There were periods, such as early 2018 and mid-2019, when Pharma and Healthcare fell more than the broader market. So defensive sectors are not automatically safer during mild pullbacks.
The clear takeaway is that defensive sectors tend to fall less than the market in small corrections more often than not, but the advantage is modest and not guaranteed.
10% to 20% Market Falls
Out of the 23 instances where the market fell more than 5%, it declined between 10% and 20% on 8 occasions.
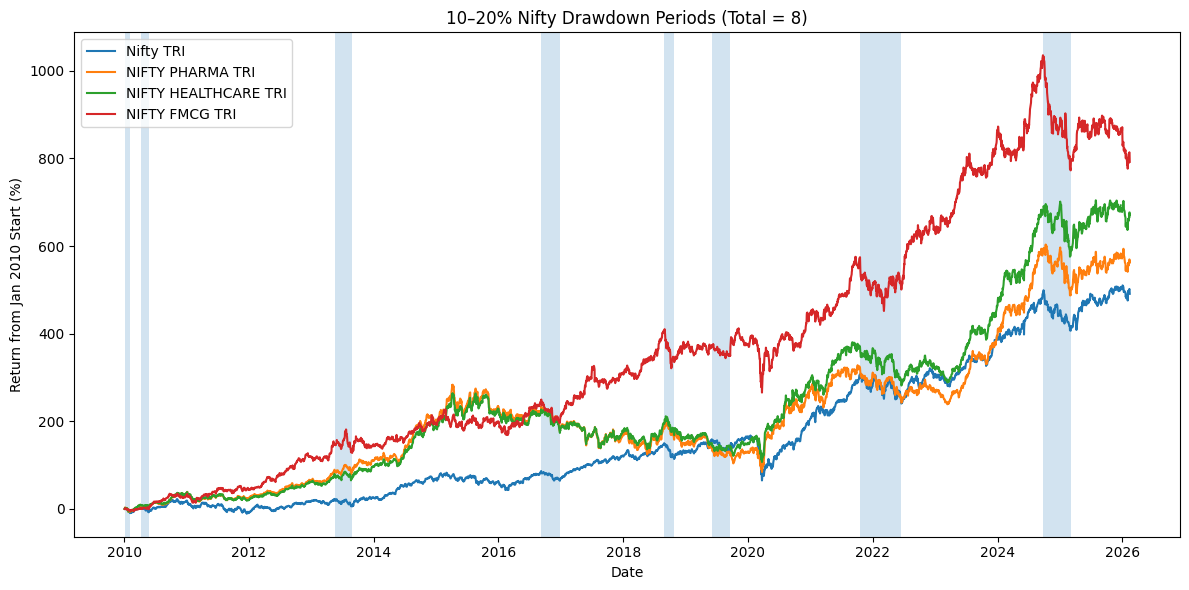
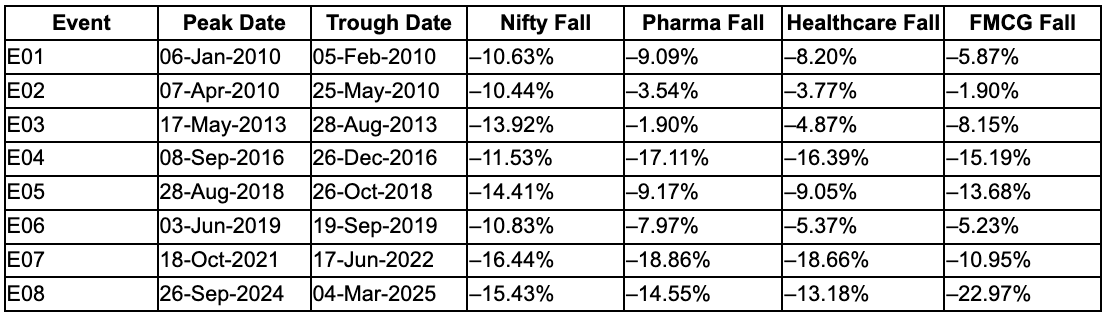
During these periods, no sector remained positive. When markets correct by 10% to 20%, almost everything falls. Defensive sectors are not spared.
However, what stands out is the behaviour we were looking for. In most of these cases, the selected defensive sectors fell less than the Nifty 50.
Pharma fell less than the Nifty 6 times.
Healthcare fell less than the Nifty 6 times.
FMCG fell less than the Nifty 5 times.
So in most medium-sized corrections, these sectors did decline by a smaller amount than the broader market. They were not immune, but they generally fell less.
The key takeaway is that as drawdowns are in the 10-20% range, defensive sectors tend to fall less compared to mild corrections. But they still fall. There is no protection from losses. They fall during market stress, just usually by a smaller magnitude.
Now, what does this actually mean for a real investor’s wealth?”
Let’s look at it from a returns perspective.
If someone had invested in January 2010 and simply held through these 10-20% market corrections, how would their total returns look at the trough of each fall?
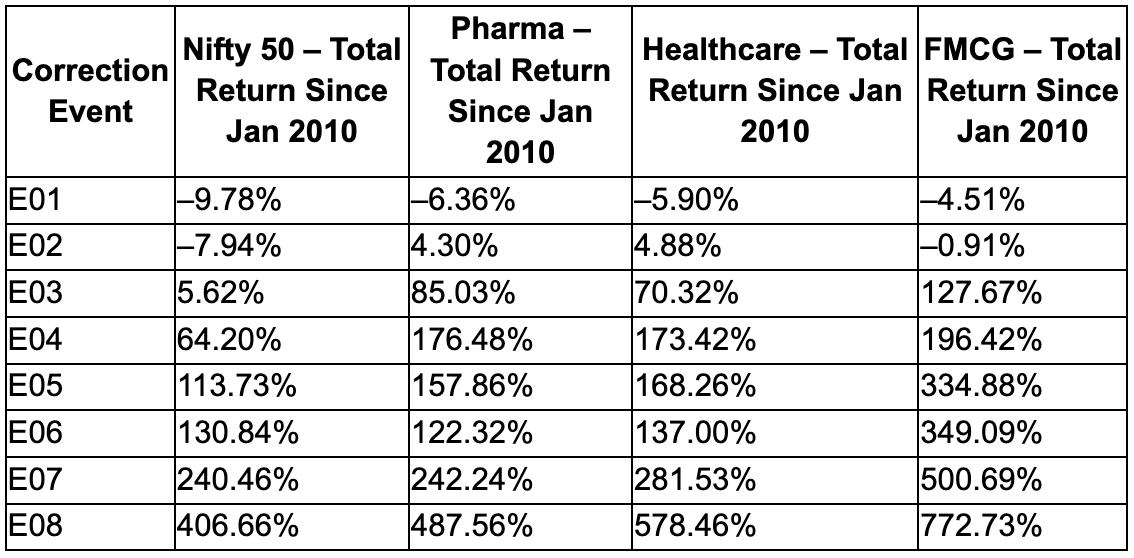
This table shows what an investor would actually see in their portfolio during those 10-20% market corrections if they had started in January 2010.
In the early years (E01 and E02), the market had not risen much yet. So when Nifty fell around 10%, the total returns were still low or even negative. Defensive sectors did not have a large lead at that point either. The fall felt direct.
But from 2013 onwards, things look very different.
During those corrections,
Nifty gave returns of +113%, +130%, +240%, or +406%
Defensive sectors were often at +157%, +242%, +281%, +500%, even +772%
So even though all sectors fell during the correction window, defensive sectors were usually sitting at higher overall return levels from the starting point. That reduces the effective damage to long-term wealth.
This means that even though defensive sectors also fell during those corrections, their overall gains from the starting point were usually larger. So the investor still remained in more returns compared to Nifty.
The simple takeaway is this:
Defensive sectors do fall when markets fall. But over time, they often build higher total returns before those corrections happen. So when the fall comes, the overall portfolio still remains at a higher level compared to the broader index.
20%-50% Market Falls
Out of the 23 instances where the market fell more than 5%, it declined by more than 20% on 3 occasions.
These were the major market crashes since 2010-2011, 2015-16, and the Covid crash in 2020.
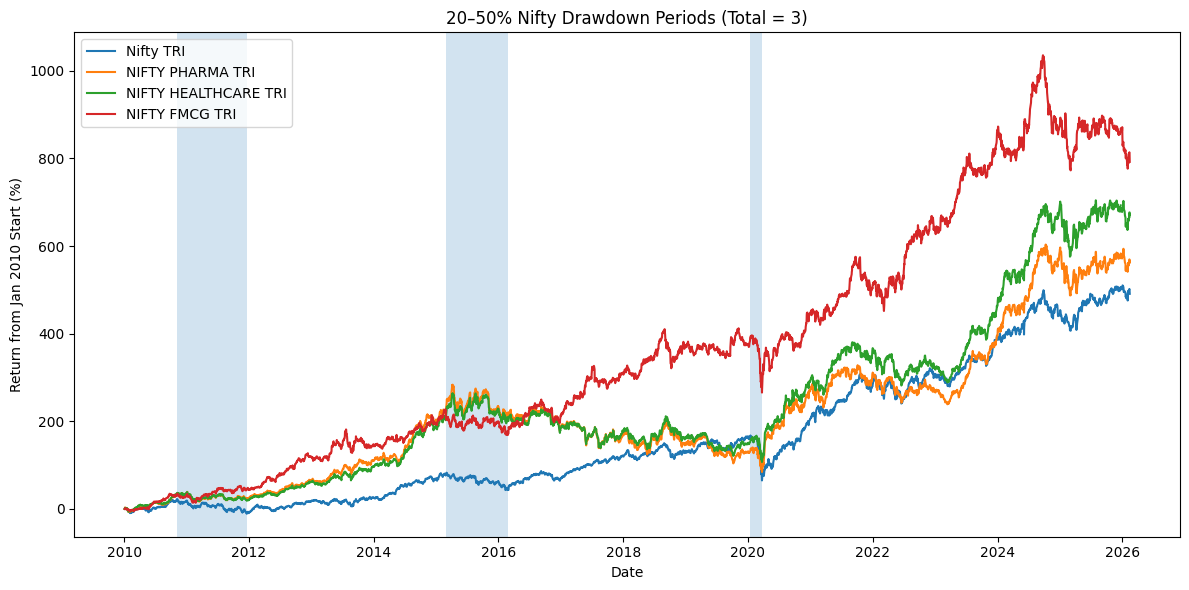
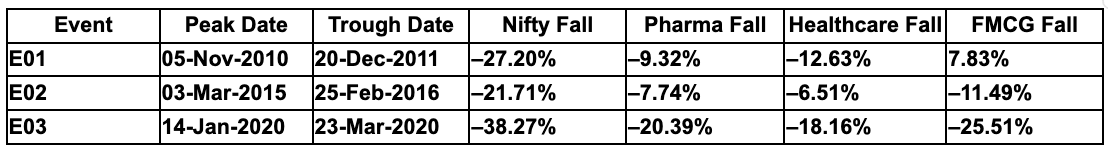
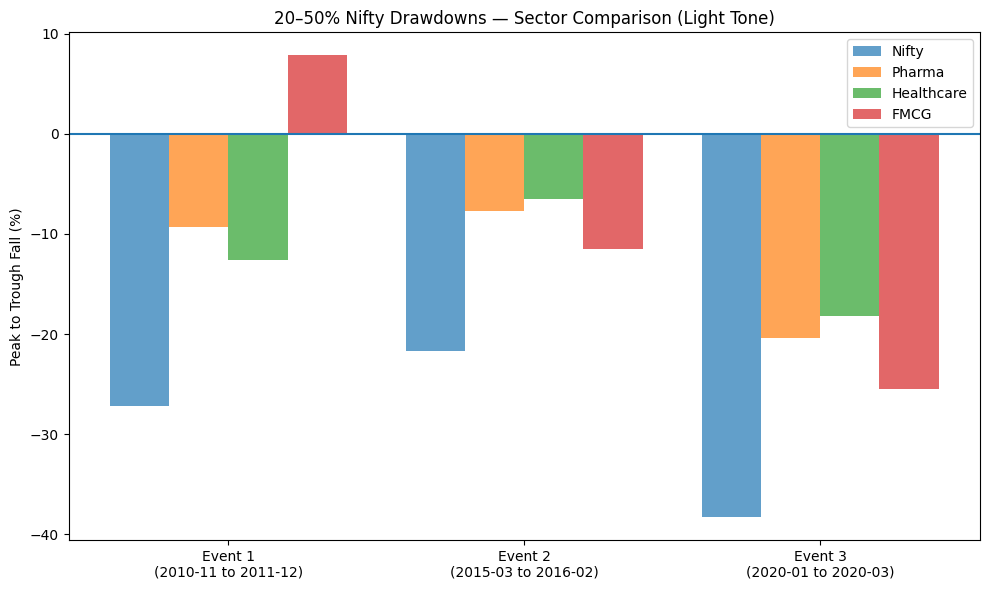
The bar graph makes the pattern much clearer.
Unlike small or medium corrections, defensive behaviour here was consistent across all events. In each of the three crashes:
Pharma fell less than the Nifty — 3 out of 3 times.
Healthcare fell less than the Nifty — 3 out of 3 times.
FMCG fell less than the Nifty — 3 out of 3 times.
In the 2011 crash, when Nifty fell 27%, FMCG actually rose by 7.83%, while Pharma and Healthcare fell much less than the broader index.
During the 2015-16 fall and the 2020 Covid crash, all three sectors declined, but the magnitude of the fall was significantly smaller than that of the Nifty.
This shows that in severe market falls, defensive behaviour becomes strongest. The sectors are not immune; they still fall, but they very clearly fall less than the broader market. The gap in decline is meaningful, often reducing losses by a large margin.
Now let’s look at this from a total returns perspective.
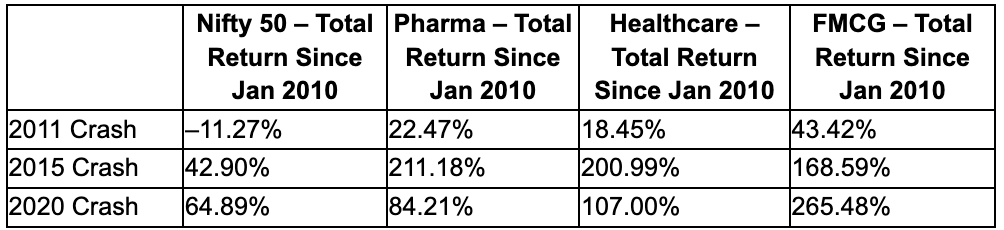
If someone had invested in January 2010 and simply held through these three major crashes (20–50% falls), what would their portfolio look like at the bottom of each fall?
In the 2011 crash, when Nifty had fallen 27% from its peak, the total return from 2010 was –11.27%. In contrast, Pharma was +22.47%, Healthcare was +18.45%, and FMCG was +43.42%.
Even during a deep crash, these sectors were still positive from the starting point.
In the 2015-16 correction, the difference widened further. By then, defensive sectors had already risen much more over the years. So even after a 20% market fall, they were sitting at much higher overall gains compared to the Nifty.
During the Covid crash in 2020, when Nifty fell 38%, the total return from 2010 was still +64.89%. However, Pharma was at +84.21%, Healthcare at +107.00%, and FMCG at +265.48%. Once again, the defensive sectors stood at higher overall return levels despite the panic.
The conclusion here was simple.
In major crashes, defensive sectors not only fall less during the event itself, they also tend to stand at higher overall return levels from the starting point.
For a long-term investor, that means the overall damage to wealth is smaller, and the recovery path begins from a stronger base compared to holding only the broader market.
Conclusion
Based on our study, it is clear that defensive sectors really do what they are supposed to do.
When markets fall hard, they usually fall less. That reduces damage. A 20% fall instead of 40% is not a small difference. It changes recovery time and investor behaviour. The data clearly supports that defensive sectors fall less during crashes.
But markets do not crash most of the time. They spend more time growing. And during strong growth phases, banks, financials, autos and other cyclical sectors often lead. That is where some of the strongest compounding happens. If you stay only on the defensive, your portfolio may feel steadier, but it can also lag when growth accelerates.
So the real learning is not “defensive sector are better.”
It is that they serve a role.
They reduce volatility. They reduce drawdown depth. But they are not designed to maximise upside.
Over long periods, diversification across both defensive and growth sectors has historically produced more balanced outcomes than concentrating entirely in one.
Protection matters. But so does participation.