

Every once in a while, a sector surges ahead in the market, grabbing all the headlines.
Take Pharma, for instance. During the COVID-19 pandemic, companies producing vaccines, medicines, and health supplies saw their valuations soar. These stocks became headline-makers, rewarding investors who held them through the boom.
It makes you wonder: what if you had put all your money there, in one sector, instead of spreading it across the entire market?
Would it have paid off… or backfired?
We decided to see what the data says.
Using Nifty 50 and Nifty sectoral indices as proxies, we analyzed 1, 3, 5, and 10-year returns, looking at both total and annualised growth, and the yearly swings that show how unpredictable sectoral cycles can be.
The Big Picture
First, let’s take a look at the big picture. How have the indices grown over a span of 10 years?
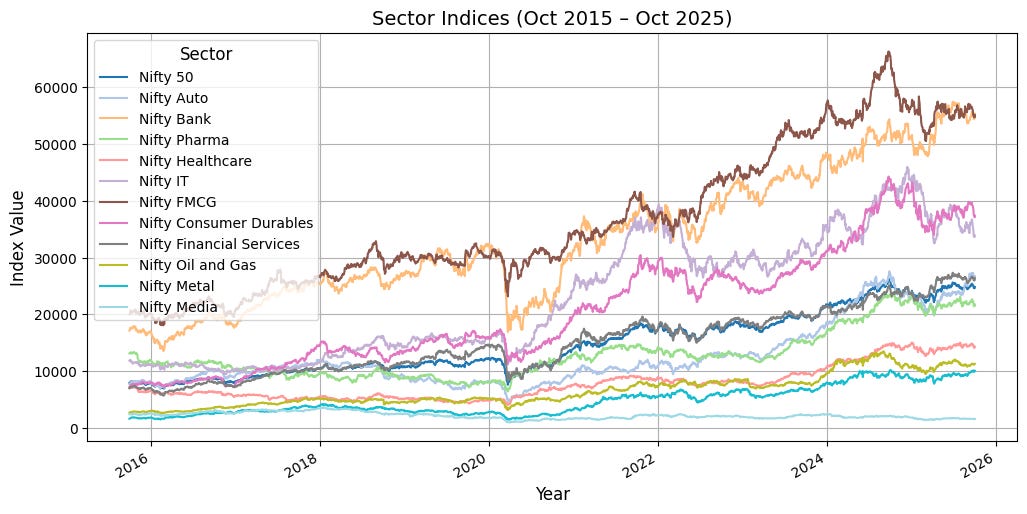
The graph presents some patterns. Over the years, FMCG, Banking, Consumer Durables, and IT seem to have grown in value consistently, showing a strong performance.
The Nifty 50, which is the benchmark, sits in the middle, its value similar to sectors like Auto, Financial Services, and Pharma, also showing steady returns.
Meanwhile, there is one sector that seems flat: Media.
Also, market dips and recoveries often occur across all sectors simultaneously, but their amplitude seems to differ. For instance, the market fell sharply in 2020 during the pandemic and rebounded in 2022. It seems that sectors with higher absolute index value, like Metals and Consumer Durables, experience larger swings, amplifying both gains and losses.
Returns over the years
Now that we’ve looked at the graph, let’s turn to the numbers.
Here, we examine total returns, which measure how much the sector indices themselves have grown over different periods.
These figures give a good approximation of what an investor might have earned if they had invested in a sector through an index fund or ETF tracking that sector. Keep in mind that actual returns could be slightly lower due to taxes, fund expenses, or timing of investments, but the overall trends remain accurate.
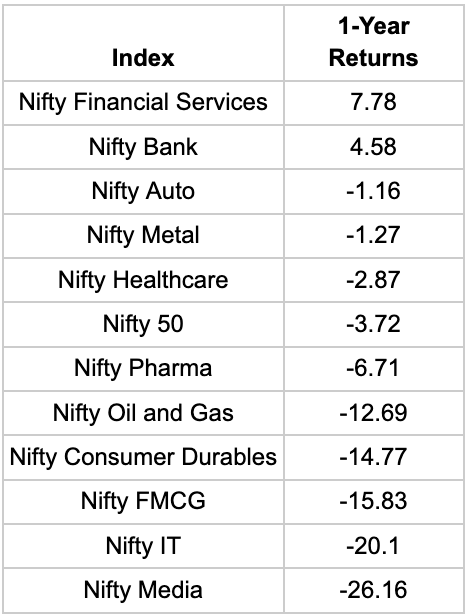
1 Year Returns Ranked
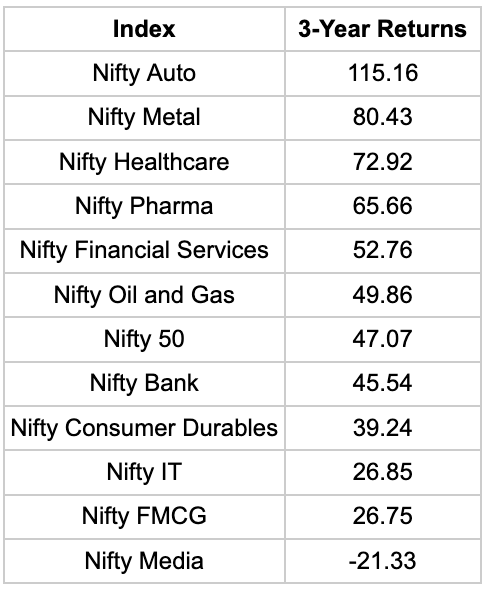
3-Year Returns
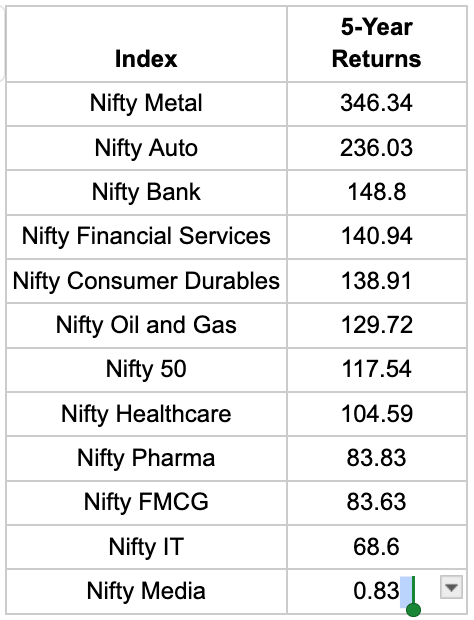
5-Year Returns Ranked
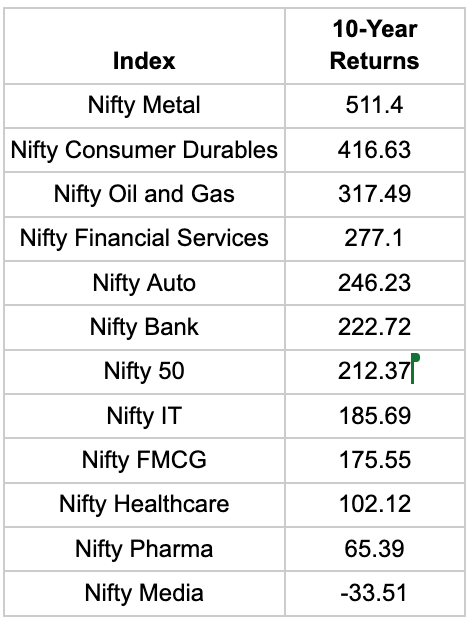
10-Year Returns Ranked
Let’s understand sector-wise.
- Nifty Financial Services:
Returns - 1Y: 7.78%, 3Y: 52.76%, 5Y: 140.94%, 10Y: 277.1%
This sector shows consistent, compounding growth across time frames. Short-term gains were moderate, but long-term performance highlights it as one of the few sectors that’s been reliably strong over the decade.
- Nifty Bank:
Returns: 1Y: 4.58%, 3Y: 45.54%, 5Y: 148.8%, 10Y: 222.72%
Banks too, saw a steady growth over the decade. Banks and financial services are the only 2 indices that showed positive returns in the 1 year period.
- Nifty Auto:
Returns: 1Y: -1.16%, 3Y: 115.16%, 5Y: 236.03%, 10Y: 246.23%
Auto saw negative returns in the 1 year period. Over the larger time periods it has grown consistently. Post-COVID recovery, and EV narratives fuelled 3- to 5-year outperformance.
- Nifty Metal:
Returns: 1Y: -1.27%, 3Y: 80.43%, 5Y: 346.34%, 10Y: 511.4%
Metals dominate the long-term leaderboard. The sector has benefited from global commodity cycles, infrastructure expansion, and periodic demand surges.
- Nifty Healthcare
Returns: 1Y: -2.87%, 3Y: 72.92%, 5Y: 104.59%, 10Y: 102.12%
Healthcare has delivered steady growth, but not spectacular growth. The pandemic temporarily boosted returns, but those gains have since normalised. Over time, the sector has maintained stability without dramatic swings.
- Nifty Pharma
Returns: 1Y: -6.71%, 3Y: 65.66%, 5Y: 83.83%, 10Y: 65.39%
Pharma’s pandemic surge has cooled. While it offered short-term resilience during COVID, long-term returns have lagged, probably settling back to its pre-COVID growth pace.
- Nifty Oil & Gas
Returns: 1Y: -12.69%, 3Y: 49.86%, 5Y: 129.72%, 10Y: 317.49%
This is a cyclical sector — oil prices and policy changes drive sentiment. But despite short term lag, long-term gains are consistent, meaning the sector has its importance in the economy.
- Nifty Consumer Durables
Returns: 1Y: -14.77%, 3Y: 39.24%, 5Y: 138.91%, 10Y: 416.63%
Consumer Durables have created massive long-term wealth, reflecting rising disposable income and aspirational spending. However, short term returns have been weak.
- Nifty FMCG
Returns: 1Y: -15.83%, 3Y: 26.75%, 5Y: 83.63%, 10Y: 175.55%
FMCG has shown steady growth over 10 years without dramatic spikes. The 1-year drop might reflect recent cost pressures and market volatility, but over the medium and long term, the sector has been a reliable compounder with predictable earnings.
- Nifty IT
Returns: 1Y: -20.1%, 3Y: 26.85%, 5Y: 68.6%, 10Y: 185.69%
After years of being a market favourite, has it hit a cooling phase? It’s 1,3, and 5 year returns have been at the lower end in the comparison group. Yet, its decade-long return still stands strong.
- Nifty Media
Returns: 1Y: -26.16%, 3Y: -21.33%, 5Y: 0.83%, 10Y: -33.51%
Media stands out for sustained underperformance. Structural shifts — from TV to digital, fragmented ad revenues, and weak profitability — might have held it back. Unless the business models evolve, this sector may continue to lag behind broader market growth.
- Nifty 50
Returns: 1Y: -3.72%, 3Y: 47.07%, 5Y: 117.54%, 10Y: 212.37%
The Nifty 50 shows steady growth over the long term. It is not the best performing index, but also not the worst. Short-term returns were negative, but over 3, 5, and 10 years, it has delivered solid gains.
If there’s one thing these numbers make clear — no sector stays the hero forever.
Each time frame tells a different story.
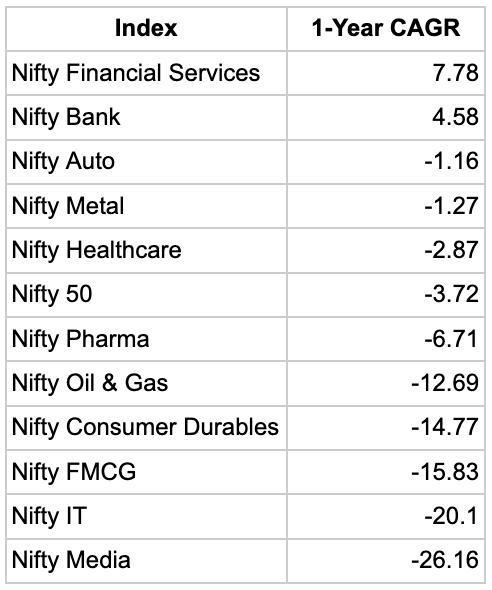
In the past year, most sectors struggled. The few positives, like Financials and Banks, managed to stay afloat.
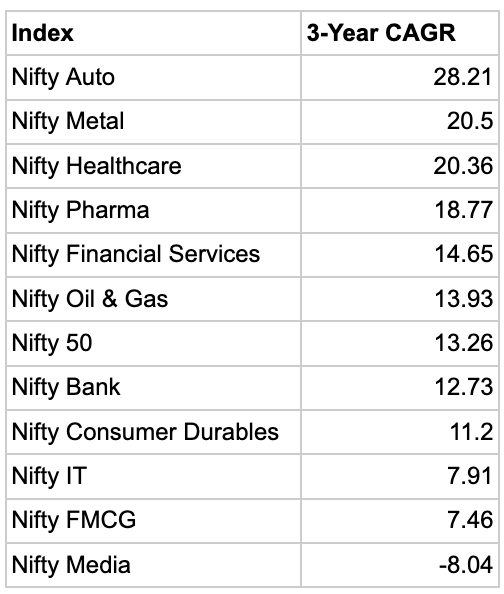
Move to the 3-year window, and the picture flips. This was the recovery phase after COVID, when Autos roared back, Metals surged, and Healthcare quietly outperformed — all riding different parts of the comeback story.
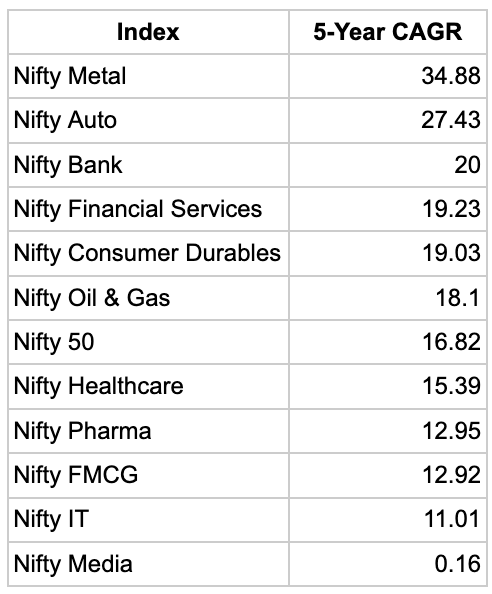
Over five and ten years, the long-term winners look quite different again. Metals and Consumer Durables shine bright, showing the power of cycles and consumption. Meanwhile, pandemic favourites like Pharma and FMCG lose this race.
Another way to look at these indices is annualised returns.
This means the average yearly growth of an investment over a specific period.
Unlike simple cumulative returns, annualised returns smooth out the ups and downs to show how much an investor would have earned per year on average, compounding over time.
It’s a better way to compare performance across sectors or time periods, because it accounts for both the size and the timing of gains.
1-Year Annualised Returns (%)
3-Year Annualised Returns (%)
5-Year Annualised Returns (%)
10-Year Annualised Returns (%)
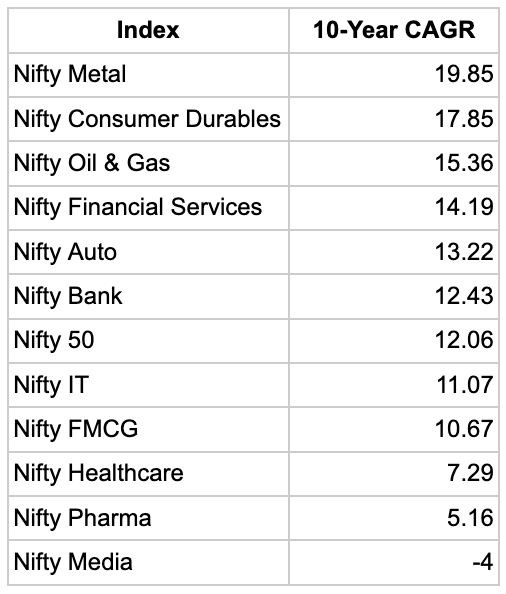
These too reiterate some patterns.
The past year has been rough for most sectors, with short-term CAGR turning negative, and only Financial Services and Banks managing to stay afloat. Step back a little, and the 3- and 5-year picture tells a different story: cyclical sectors like Metals, Auto, and Consumer Durables roared ahead, fueled by post-COVID recovery, rising consumption, and global commodity cycles.
Meanwhile, sectors such as FMCG, Healthcare, and Financial Services showed steady, predictable growth.
Interestingly, the 10-year CAGR is usually lower than the 5-year, even for sectors that have done very well recently. This happens because the 10-year figure averages performance across a full decade, including weak years, market corrections, and sector-specific downturns, whereas the 5-year CAGR captures more recent bursts of growth. Many sectors were boosted in this time period by the post-pandemic recovery.
It’s a reminder that medium-term surges can look spectacular, but over the long haul, weaker periods dilute the annualised average.
Media, has struggled consistently, delivering negative growth even across ten years — a reminder that not every sector participates in the market’s upside. Its underperformance can largely be attributed to structural shifts in the industry, as advertising and viewership move away from traditional TV and print toward digital platforms.
Meanwhile, the Nifty 50 sits right at the market’s average. It’s not the flashiest, but steady. Since it represents the top 50 companies across sectors, its performance naturally balances the highs of booming sectors and the lows of lagging ones. That’s why it usually lands in the middle.
Let’s look at something interesting. How have yearly returns changed over the years?
We look at this because cumulative and annualised returns tell you the long-term picture, but yearly returns show the cycles, swings, and volatility behind those averages. They reveal which sectors boom in a particular year and which stumble, an essential insight if you’re considering putting all your eggs in one basket.

Cyclical sectors like Metals, Auto, Oil & Gas, and Consumer Durables show wild swings. Metals, for instance, fell over 40% in 2015 but surged 56% in 2016, then again 149% in 2021. Autos dipped sharply in 2019 but roared back in 2024 with a 67% gain. These patterns highlight that timing is everything. Investing only in these sectors could produce huge gains or losses depending on when you enter.
Steady sectors like FMCG, Healthcare, Financial Services, and Banks display smaller year-to-year swings. Even when they dipped, the falls were modest compared to cyclical peers. For example, FMCG rarely fell more than 3%-15% in a single year, showing why these sectors are often considered safer, slow-and-steady plays.
Pandemic effects are clear: 2020 saw sharp drops for Banks (-22.56%) and Oil & Gas (-1%), but Pharma and Healthcare surged (+58% and +57%), showing that short-term events can dramatically change sector performance.
Media stands out as persistently weak, with negative or very low yearly returns in several years, reinforcing that structural challenges have kept this sector lagging over the decade.
Conclusion: What if you had invested only in specific sectors?
The data tells a clear story: investing in a single sector could have beaten the Nifty 50 over the long term, but it could also have backfired spectacularly. Metals, Auto, and Consumer Durables show that long-term gains were possible with concentrated bets, yet these same sectors also experienced massive year-to-year swings.
Timing your entry could make you a winner; a misstep could turn profits into losses.
Some sectors, like FMCG, Healthcare, Financial Services, and Banks, were slower, steadier performers. Their returns may not have made headlines, but they avoided extreme dips, showing the power of patience and predictability.
The key takeaway: sectoral investment offers the thrill of high rewards but comes with high risk. Even over the long term, no sector is guaranteed.
For most investors, diversification — tracking the Nifty 50 or spreading across multiple sectors — remains the safest path to steady, long-term wealth creation. Because after all, the Nifty 50 moves with the market as a whole.