

In the early 2000s engineers around the world began testing a radical new technology in transportation — the Maglev train.
Unlike conventional trains, it doesn’t touch the track at all.
It floats on magnetic fields, silently gliding forward at speeds of nearly 600 km/h (almost twice as fast as today’s fastest bullet trains).
Governments poured billions into research, prototypes, and test tracks.
But after years of trials, one surprising truth emerged. On most routes, the total travel time saved was barely noticeable.
The Maglev was indeed faster, but once you added time for security checks, boarding, and city transfers, passengers reached their destinations only a few minutes sooner than before.
All that innovation, precision, and cost. It was for an improvement that most people could hardly feel.
It was a technological marvel but an economic dilemma: if the end result is almost the same, does the extra effort really make sense?
What if the investing style works the same way?
We all have our own “Maglev moments” in investing, trying to find the perfect, fastest, smartest way to grow our money.
Some believe monthly SIPs are perfect.
Others prefer daily or weekly SIPs, hoping more frequent investing will give them an edge.
And then there are those who save up and invest a lump sum once a year, convinced that timing it right matters most.
There are so many ways to invest. But which one actually works best? And more importantly, how much difference does it really make?
If the total amount invested is the same, does splitting it differently — monthly, weekly, or daily — actually change your returns?
We decided to find out.
Simulation — The five investor types
Investor A – Annual SIP Investor
Every month, A saves Rs 10,000 in the bank and lets it sit there earning interest. At the end of the year, the entire Rs 1.2 lakh is invested in one go. The idea is simple — stay safe, earn a bit of interest, and avoid short-term volatility. But it also means the money spends most of the year idle instead of compounding in the market.
Investor B – The Monthly SIP Investor
B sticks to the classic SIP routine. As soon as the salary is credited, Rs 10,000 gets automatically invested on the first trading day of every month.
Investor C – The Weekly SIP Investor
C prefers smaller, more frequent entries.
They’ve set up an automatic debit system that divides the Rs 10,000 monthly amount evenly across all the weeks in that month.
At the start of each week, a portion is pulled directly from their savings account and invested into the fund. The rest of the money stays in the bank, quietly earning interest until its turn comes.
By the end of the month, the total money invested totals to Rs 10,000
Investor D1 – The Daily SIP Investor (Trading Days)
D1 takes consistency to another level. T
They’ve set up an SIP that automatically debits a tiny amount from the savings account every trading day. If markets are open, money gets invested; if not, it doesn’t. By the end of the month, the total money invested totals to Rs 10,000.
Investor D2 – The Daily SIP Investor (Calendar Days)
D2 is the most continuous of them all. Their system debits a fixed amount every single day, including weekends. On market holidays, the money simply earns interest in the bank and gets invested the next trading day.
By the end of the month, the total money invested totals Rs 10,000.
All five start from the same total investment goal: Rs 1.2 lakh per year.
The question was, after 10 years, who ends up with higher returns?
Common Assumptions
For this study, we looked at a 10-year investment period, from January 2015 to the second trading day of January 2025. The investment instrument was the UTI Nifty 50 Index Fund (Direct, Growth), using actual daily NAV data from November 2014 to November 2025.
Each investor committed to investing Rs 1.2 lakh per year, which works out to Rs 10,000 every month.
To make the comparison fair, we assumed that any uninvested money sat in a savings account with HDFC Bank, earning interest according to the bank’s historical rates, gradually moving from 4.0% down to 2.75% over the decade. Interest was compounded daily, while fund returns were based on actual NAV reinvestment.
The simulation ended on the second trading day of 2025, allowing the “year-end” investor to make their final investment and gain one NAV update before closing the period.
Let’s see how the money moves each month.
This graph captures how each investor’s Rs 10,000 monthly investment moves through the bank during a single month — January 2015.
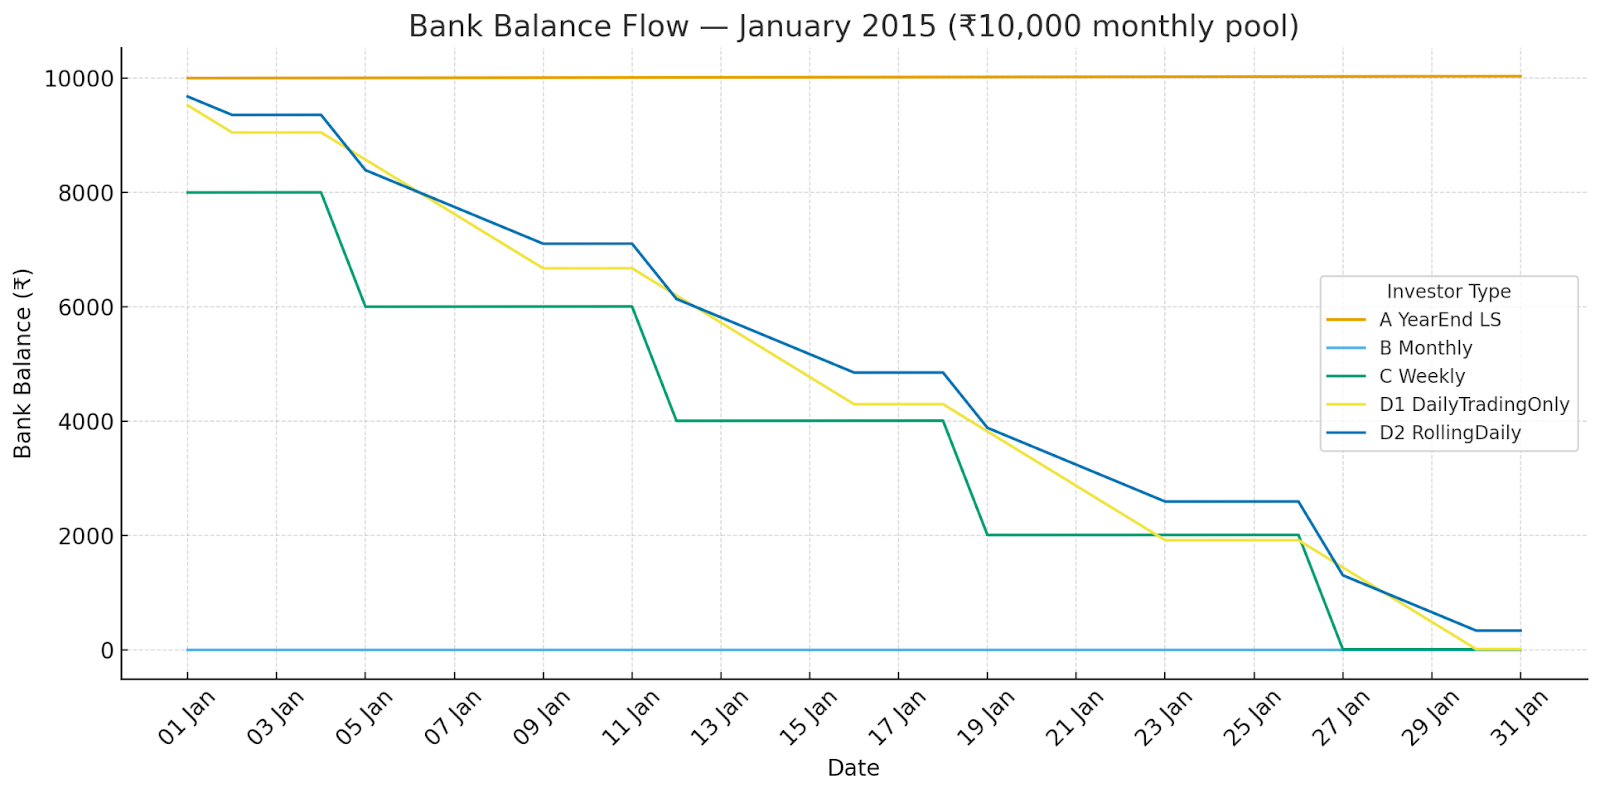
It shows how differently each investing style handles money before it enters the market.
Investor A’s line stays completely flat, as their cash simply sits in the bank earning interest all month.
Investor B’s line plunges to zero on the first trading day — they invest the full Rs 10,000 right away.
Investor C’s line forms small steps, reflecting weekly investments of about Rs 2,000 to Rs 2,500 while the rest waits in the bank.
Investor D1’s line slopes down smoothly on weekdays and flattens over weekends — representing daily SIPs only on market-open days.
Investor D2’s curve is the most even and steady; they invest small portions every single calendar day, including weekend carry-forwards.
Together, these lines visualise how each investor’s cash “flows” through the month.
Now that you’ve seen what happens within one month, let’s zoom out and see how it looks across an entire year.
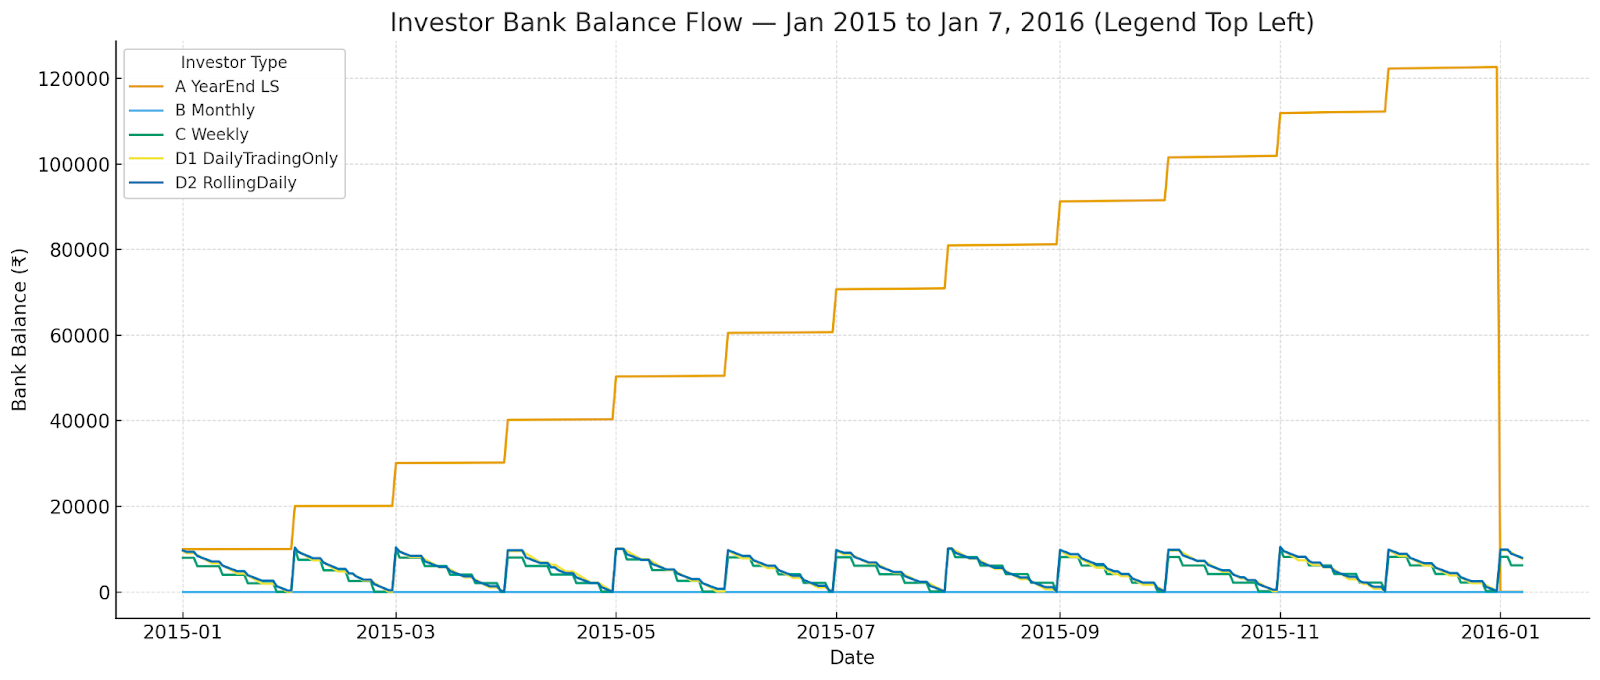
The yearly graph (Jan 2015 – Jan 7 2016) shows how those monthly patterns repeat and accumulate.
Investor A’s line slowly climbs month by month as Rs 10,000 is added to savings. Then, at the start of the next year, the balance suddenly collapses to zero — that’s the moment they invest the whole Rs 1.2 lakh in one go.
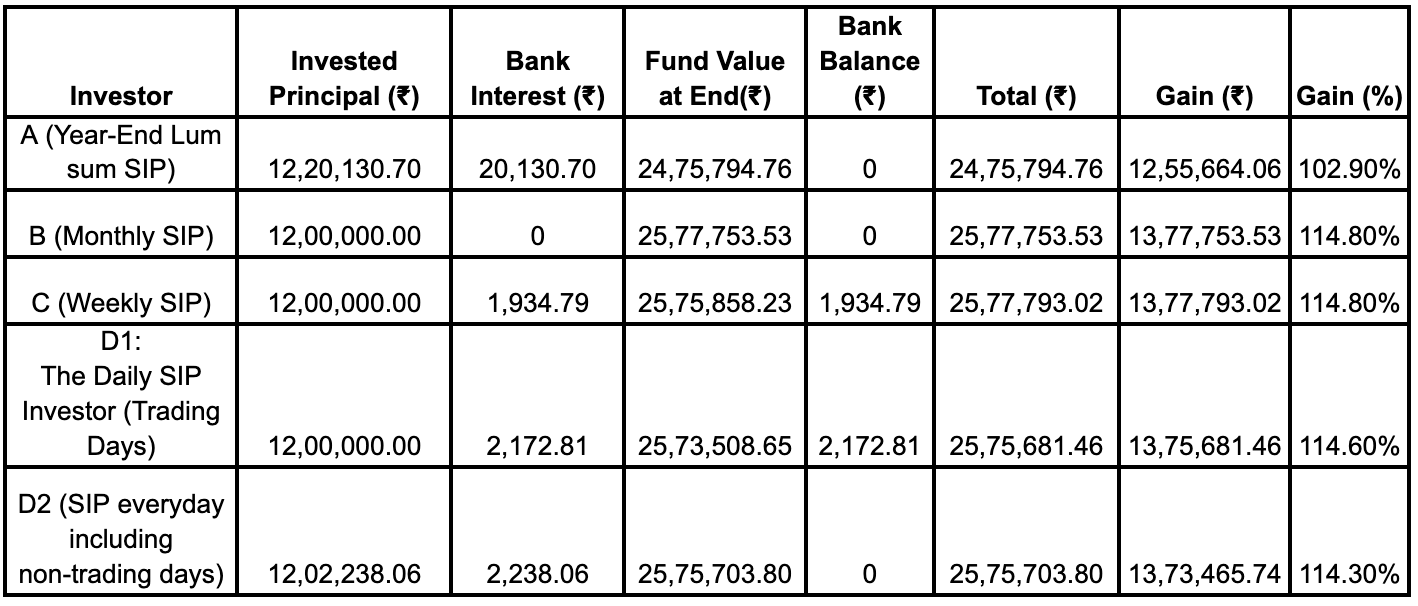
The results:
What happens by the end (2nd Trading Day of Jan 2025) — Full 10 years of investment
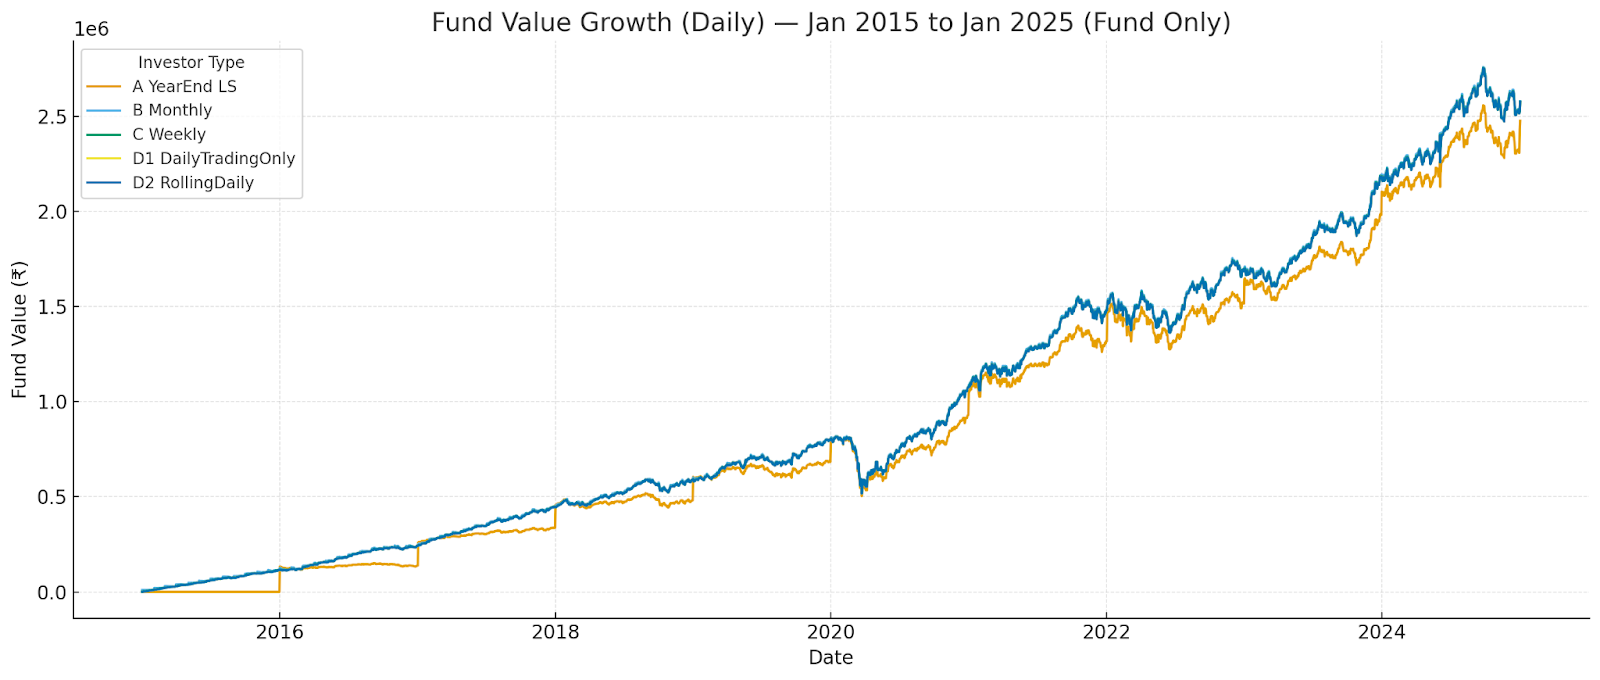
After running the full 10-year simulation, one thing became obvious.
It didn’t make a huge difference.
All five investors, despite using very different investing schedules, ended up in almost the same place.
Whether someone invested once a year, once a month, or every single day — the difference in final returns was surprisingly small.
Over a decade, the Monthly SIP, Weekly SIP, and Daily investors (B, C, D1, D2) all finished within a few thousand rupees of each other — almost identical performance.
The only one who lagged a little was Investor A (the year-end lump sum investor).
Why did the lump sum investment fall behind?
It wasn’t because the fund performed differently for them. It was all about timing.
Investor A’s money sat idle in the bank for most of the year, earning low savings interest instead of compounding in the market.
While others kept adding small amounts regularly and letting those units grow, investor A’s money waited — missing out on the small, steady gains that add up over time.
Even though A earned around Rs 20,000 in bank interest each year, that wasn’t enough to offset the growth lost by being out of the market for most of the year.
So while the others ended around Rs 25.75 lakh to Rs 25.78 lakh, Investor A finished a bit lower at Rs 24.75 lakh — roughly a 1% per-year lag that compounded over time.
Does Frequency Really Matter?
Not as much as most people think.
Investing monthly, weekly, or daily didn’t change the outcome much — all of them benefited from staying consistently invested.
The only real penalty came from delaying market entry, waiting to invest instead of letting money compound.
So yes, timing matters — but only in the broad sense of being in the market early and often, not in micromanaging the calendar.
The Real Takeaway
All five investors reached the same destination, just by slightly different routes.
The smoother paths (daily or weekly) looked nice on paper, but the destination didn’t change much.
In the end:
Monthly SIPs were simple, efficient, and nearly optimal.
Daily investing was overkill, more effort, and no extra reward.
Year-end investing was the only clear underperformer.
So the conclusion is simple:
Whether you invest once a month or once a day, your long-term results will be almost identical — as long as your money doesn’t sit idle for too long.
What if? I like momentum. Hence if we Invest in top 20 stocks of Nifty 200 what is the lumpsum investment return and SIP (Quarterly on Rebalancing Day) for last 10, 5 and 3 years? Rule 1) Rebalancing every 1st Monday of each Quarter. 2) Stocks should be there in the index for minimum last three months 3) Calculate the Return for the last one month, two months and three months ending on previous open market day (Friday or Thursday or Wednesday as the case may be) of Rebalancing day 4) Based on the previous calculation, get an average return [(one month return + two months return + three months return) / 3] 5) Based on the previous step, we select top 20 stocks. 6) All twenty stocks are invested equally 7) In next rebalancing day, we will sold outperforming stocks and buy those new stocks which are included in top 20 stocks (slight confusion is there - whether we have to invest the amount which is arrived from sale proceeds, equally in new stocks or sell all twenty stocks and reinvest them equally in new top twenty stocks or rebalance individual stock which are continue in the portfolio for next period by selling excess or buying shortage of stocks for removing brokerage burden and purchase newly entered stocks )
This is such a great takeaway! Consistency beats timing — whether you invest daily, weekly, or monthly, staying in the market matters far more than micromanaging the schedule. The real “Maglev moment” is just showing up and letting compounding do its magic!