

Airlines are flying more people than ever before.
In 2026, the International Air Transport Association expects a record 5.1 billion passengers to travel by air. Planes were also very full, with about 84% of seats filled on average, the highest level ever.
At first, this sounds like great news for airlines.
But it isn’t that simple.
Fuel prices went up because of the war in the Middle East. At the same time, Boeing and Airbus were not able to deliver enough new, fuel-efficient planes, so airlines had to keep using older ones that cost more to run. On top of that, low-cost airlines kept ticket prices low because of competition.
So even though more people were flying, airlines were not necessarily making much more money.
IATA eventually cut its expected industry profit margin for the year from 3.9% to just 2%.
In other words, more activity did not automatically mean more profit.
This brings us to a belief many investors naturally hold about the economy and the stock market.
When India’s GDP grows quickly, it simply means more activity is happening in the economy. People are spending more, companies are selling more, factories are producing more, and businesses are expanding.
So the logic feels straightforward.
If the economy is doing well, companies should do well. And if companies are doing well, their stock prices should rise too.
But the real question is, does it actually work like that?
Does faster GDP growth really mean better stock market returns?
We decided to test this.
And we looked at the relationship in two simple ways: first, whether GDP growth and Nifty returns actually move together year by year, and second, whether the companies in the stock market even reflect the same parts of the economy that GDP is measuring.
The Study
We looked at 21 Indian financial years, from FY06 to FY26, and compared two numbers for each year: the Nifty 50’s annual return and India’s real GDP growth.
Then we asked a simple question:
How often did GDP and the Nifty move in the same direction?
But there was one problem.
The Nifty goes up in most years anyway. So even if stocks rose in most years when GDP grew, that alone would not prove that GDP was a useful signal.
So we also compared the result with the Nifty’s normal base rate — how often it went up regardless of GDP.
This helps us see whether knowing that the economy was growing actually told an investor anything extra about what the stock market would do.
What We Found
1. At first, GDP and the Nifty seem to move together
In 14 of the 21 years, GDP and the Nifty moved in the same direction. In the other 7 years, they did not.
At first, that looks like a solid relationship. But it is also important to know that the Nifty rose in 15 of the 21 years anyway.
GDP grew in 20 of those 21 years, and the Nifty rose in 14 of those 20 years. That is a 70% success rate.
The Nifty’s normal base rate was 71%.
So knowing that GDP grew did not really improve your chances of predicting whether the Nifty would rise.
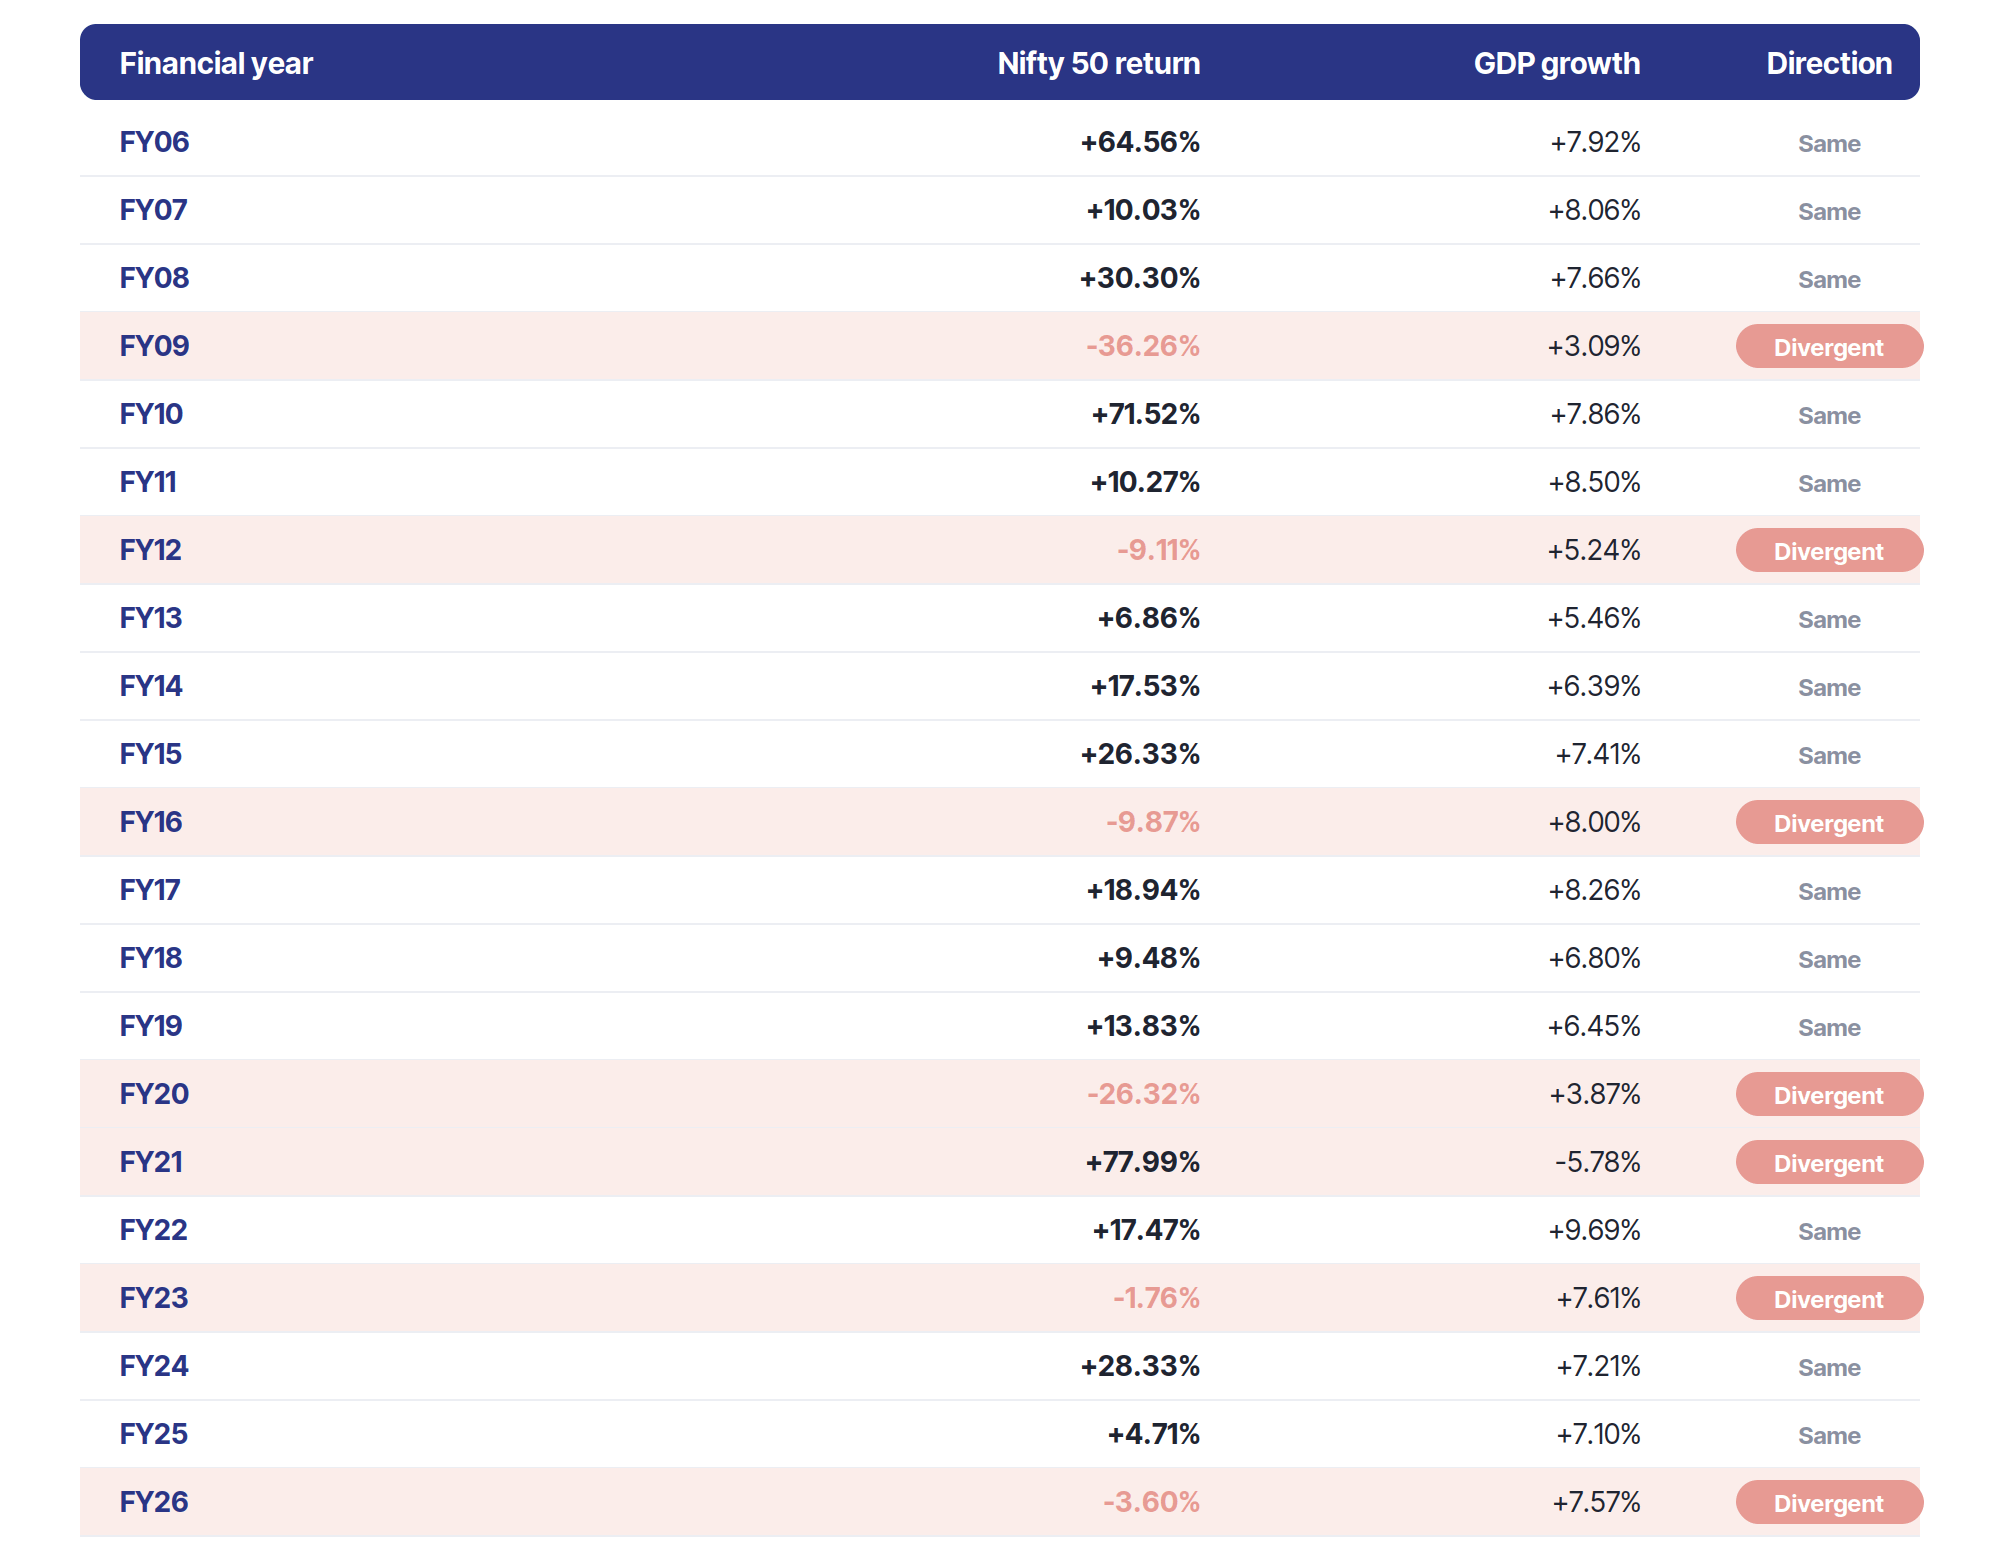
Most years look like they support the idea that a growing economy goes with a rising market. But the highlighted years show why that relationship is not dependable and FY16 and FY21 are the clearest examples.
2. Some years showed a very different picture
FY16 is a good example.
India’s economy grew by 8%, but the Nifty fell 9.87%.
One reason was that the market had already risen 26.33% in the previous year, partly because investors were expecting strong growth. By FY16, concerns about China’s slowdown and weak corporate earnings became more important.
FY21 showed the opposite.
India’s GDP fell 5.78% because of the Covid lockdowns.
Yet the Nifty rose 77.99% during the same financial year.
The market had already crashed when investors feared the worst in March 2020. It then started rising as investors expected the economy to recover.
This highlights an important difference.
GDP tells us what happened in the economy. The stock market tries to price what investors think will happen next.
3. GDP is only one of many things that move stocks
Stock prices also depend heavily on company profits.
For example, during the mid-2010s, India’s GDP was growing at around 7–8%, but earnings of listed companies barely grew as banks dealt with large bad loans.
Then, in 2019, the government cut corporate tax rates. That directly improved company profits even though GDP growth did not suddenly jump.
Valuations also matter.
A company’s share price depends not only on how much it earns, but also on how much investors are willing to pay for those earnings.
That can change because of interest rates, foreign investor flows, wars, crises and other market developments.
So even when GDP is growing strongly, another factor can become more important for the stock market in that particular year.
What the Market Is Made Of vs What the Economy Is Made Of
There is another reason GDP and the Nifty may not move together, and it comes down to a basic but important point: they are measuring two very different things.
GDP is designed to capture the entire Indian economy — everything from farming and manufacturing to services, government activity and informal work. If you break India’s economy into broad buckets, it usually comes down to three parts: agriculture, industry and services.
Over the last two decades, this structure has been fairly stable. Services have consistently been the largest share, contributing around 60% of total output, while agriculture and industry have each stayed roughly around 20%.
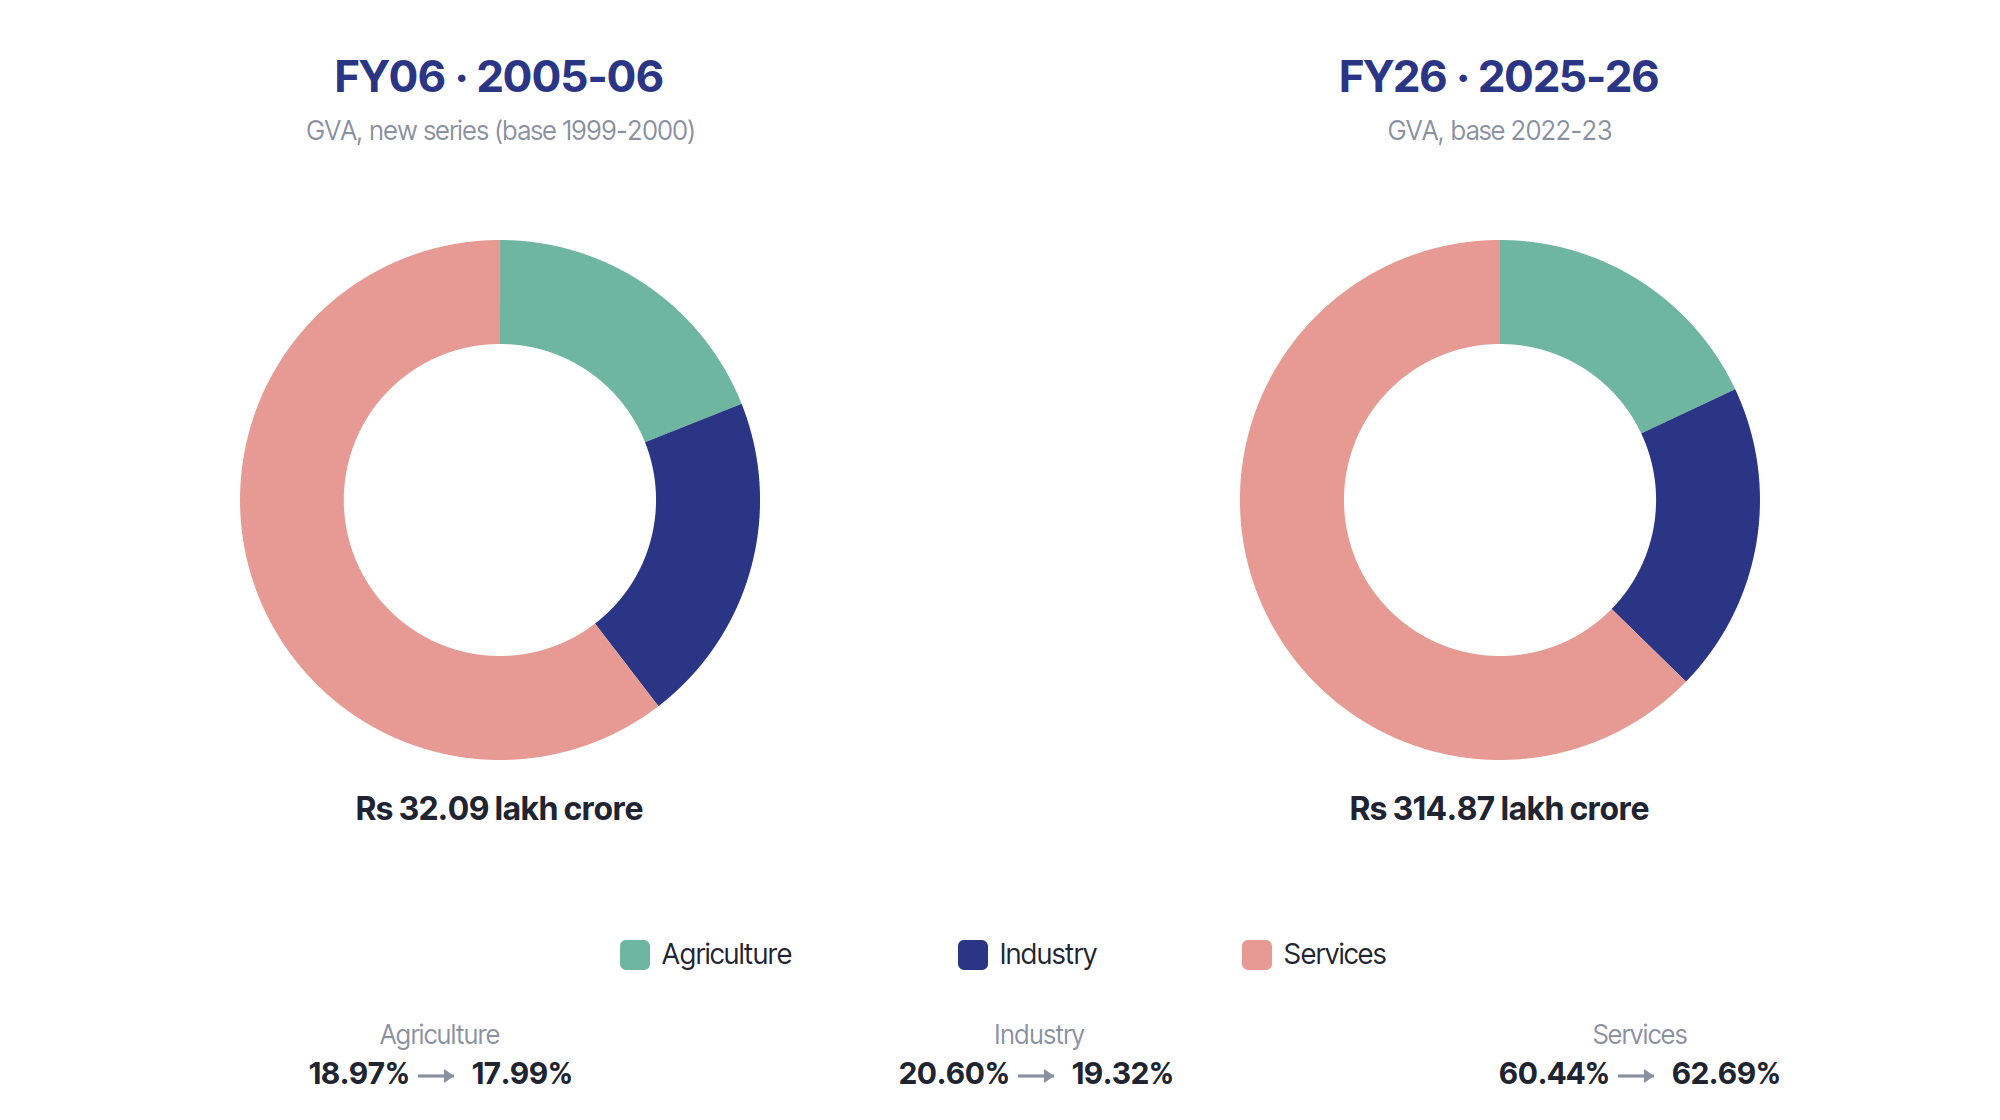
India’s GVA by broad sector, FY06 vs FY26. The economy’s shape barely changed. Source: MoSPI National Accounts (series change noted below).
The Nifty, however, is not built to reflect this structure. It is not a miniature version of the economy. It is simply an index of 50 large, listed companies.
And that difference matters.
For example, agriculture still accounts for nearly 18% of India’s economy, but there is no agriculture company in the Nifty 50 at all. In other words, a sector that represents almost one-fifth of economic activity is completely missing from the stock market index.
This is the first clear gap between the two: large parts of the real economy are not represented in the market at all, while some sectors are heavily overrepresented.
Even services mean different things
Services are the biggest part of both India’s economy and the stock market index. So at first glance, it feels like they should move together.
But the important point is this: “services” does not mean the same thing in both places.
In the real economy, services are everything people use in daily life. This includes small shops, local transport, restaurants, hotels, delivery services, and also government services like schools, hospitals, and administration. A large part of this is informal and spread across millions of small businesses and workers.
In the stock market (the Nifty), “services” is a much narrower and more corporate group. It is mostly made up of large listed companies, especially banks and IT companies.
This creates a mismatch.
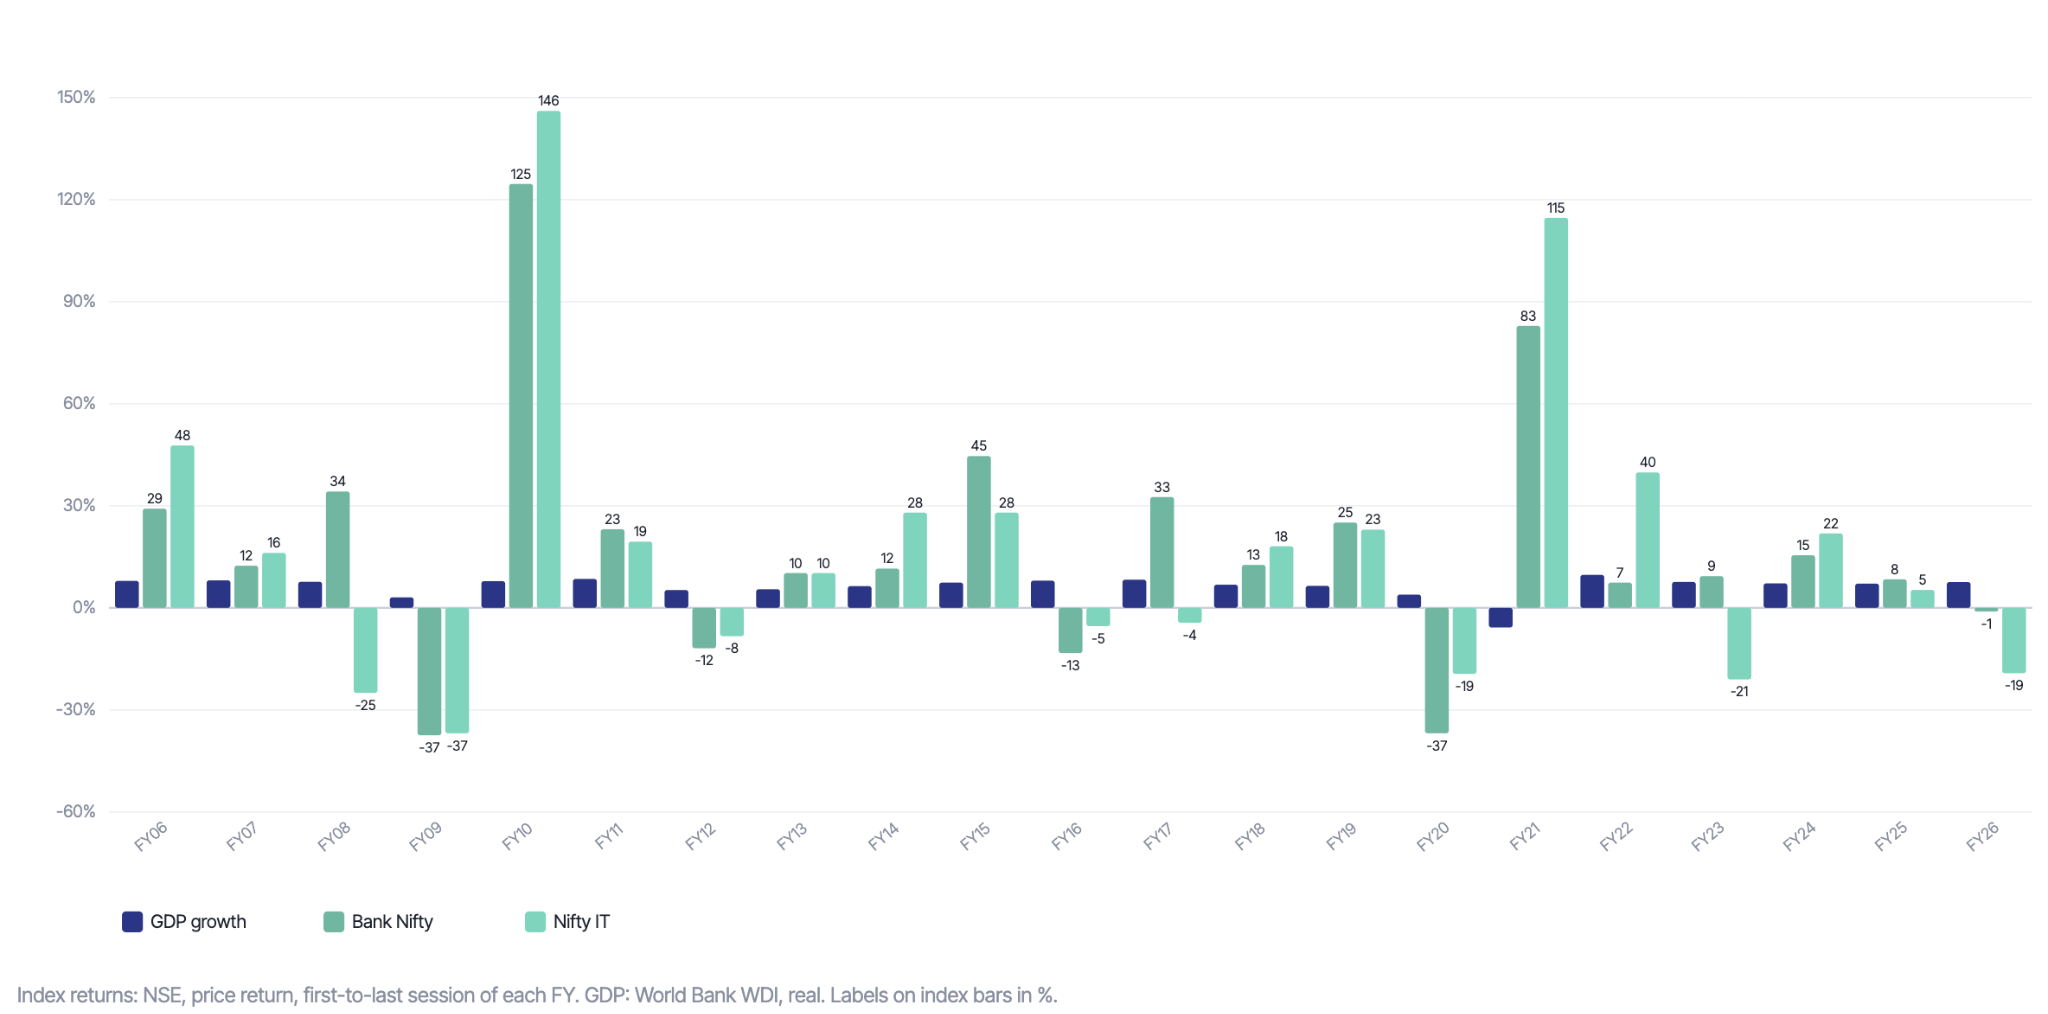
GDP growth vs Bank Nifty and Nifty IT returns, FY06–FY26. Source: NSE, World Bank WDI.
Take IT companies first.
Big Indian IT firms earn most of their money from clients outside India — mainly in the US and Europe. So their performance depends more on global technology demand and the value of the dollar compared to the rupee, rather than how fast India’s own economy is growing. Because of this, there were several years in our study where Nifty IT fell even though India’s GDP was growing.
Now look at banking.
Banks are closely linked to the Indian economy because they lend to Indian households and businesses. So in that sense, they do reflect domestic conditions.
But in the stock market, banks are extremely important because they take up a very large share of the index.
Today, financial services make up about 37% of the Nifty. In comparison, in the broader economy, the entire category that includes finance, real estate, IT and professional services is only about 27% of total output (GVA) — and banking is just one part of that.
So what this means is:
The economy is made up of millions of small and large service activities spread across the country.
The Nifty is heavily influenced by a small number of large financial and IT companies.
Because of this difference, the stock market can move in ways that do not always match what is happening in the broader economy.
The Nifty itself has also changed.
The Indian economy has stayed broadly similar in its structure over time, but the Nifty has changed a lot in what it represents.
For example, in 2005, oil and gas companies made up about a quarter of the entire index, making them the most important part of the Nifty. By 2025, their share had dropped to around 10%.
At the same time, financial companies became much more important. Their weight in the index rose from about 13% to 37%.
IT companies moved in the opposite direction, falling from around 20% to 10%.
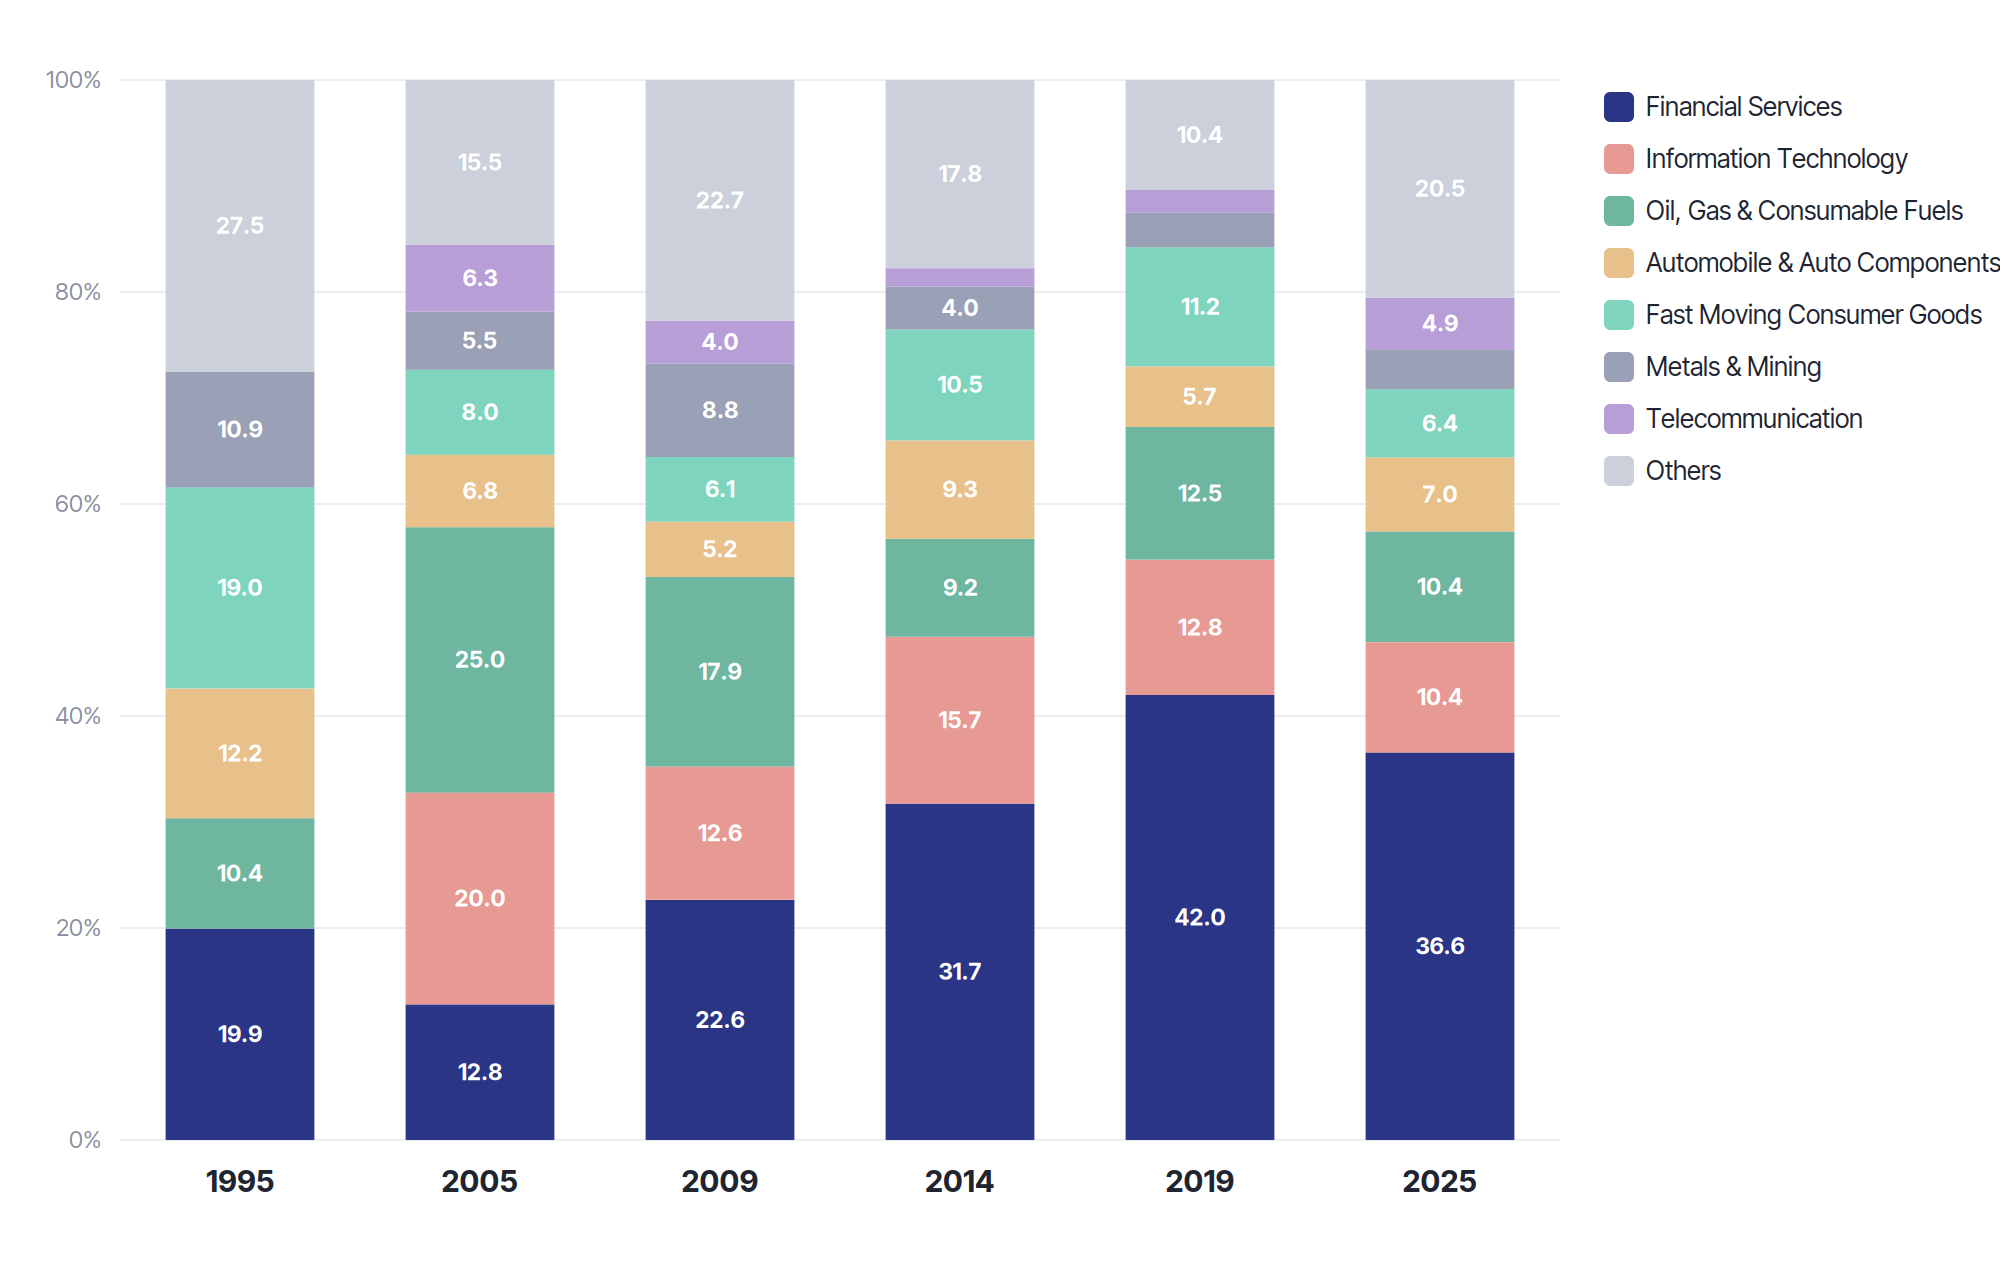
Nifty 50 sector weights, 1995–2025. Unlike the economy, the index reshaped itself completely. Source: NSE Nifty 50 whitepaper.
What this means is simple: the Nifty today is not the same “basket” it was 20 years ago.
So when we compare GDP with the Nifty, we are not really comparing the same thing.
GDP is a picture of the entire Indian economy — everything from farming and factories to shops, services and government activity.
The Nifty, on the other hand, is just a group of 50 large listed companies, and some sectors like banking and finance have a much bigger influence on it than others.
Because of this difference, it is natural that the Nifty and GDP do not always move together.
Note
Nifty returns exclude dividends. This changes the return level slightly, but not whether the market rose or fell.
GDP and Nifty are measured differently. GDP is inflation-adjusted; the Nifty is not.
GDP data comes from the World Bank. FY26 growth is estimated at 7.57%, versus India’s provisional 7.7%.
GVA methodology changed over time. So FY06 and FY26 sector shares are useful for broad comparison, not exact like-for-like comparison.
Nifty and GVA sectors are classified differently. The sector comparison is therefore directional, not exact.
Nifty sector-weight methodology also changed. Older data uses full market cap, while newer data uses free-float market cap.
Moving together does not mean GDP caused the market move. That is why we compare the result with the Nifty’s normal base rate.
A detailed write up.
Suggest if Groww team (expert in Share market) arrange physical meeting with customers spreads across INDIA (particularly in metro cities) on chargeable basis.