

How Indians take part in the market is shifting.
In August 2026, SEBI released a study on individual traders in the equity derivatives market. It found that the number of active individual traders fell about 20% in one year, from 98.1 lakh in FY25 to 78.6 lakh in FY26. The number of first-time traders also fell by around 40%.
So fewer people were actively trading in derivatives than a year earlier.
At the same time, another way of investing kept growing: SIPs.
A systematic investment plan, or SIP, lets you invest a fixed amount into a mutual fund regularly, usually every month.
The mutual fund then pools this money from investors and invests it based on the type of fund. An equity fund, for example, can invest that money in shares, including companies that are part of the Nifty 50.
This is why SIPs are often seen as a steady source of money coming into the stock market.
And Indians are putting more money into SIPs than ever before.
In March 2026, monthly SIP contributions reached a record Rs 32,087 crore. By FY2025-26, AMFI counted around 9.7 crore contributing SIP accounts.
These are SIP accounts, not individual investors. And the people investing through SIPs are not necessarily the same people trading in derivatives.
Still, the broader trend is interesting.
While the number of individual derivatives traders was falling, SIP investing kept growing.
That has also created a common belief about the market.
If thousands of crores keep coming into mutual funds every month through SIPs, there should be some regular buying in the market. So when stocks fall, this steady flow of money should help support prices.
And as SIP contributions become larger, there is more buying happening in the markets. You might expect big market falls to become less common or less severe.
But March 2026 showed why that idea is worth testing. In the same month that SIP contributions hit a record, the Nifty 50 fell 11.3%, its worst monthly fall since March 2020.
One month, however, cannot answer the question.
SIP contributions do not go straight into the Nifty 50. The money goes into different kinds of mutual funds, can be invested at different times, and funds may also be dealing with redemptions or holding some cash.
So the bigger question is what has happened over time.
As SIP contributions have grown, have market falls become less frequent or less severe? And after a fall, has the market recovered faster?
In other words, is there really something behind the idea that SIP money has become a floor for the market?
We tested this using 10 years of SIP contribution data and Nifty 50 returns.
The Experiment
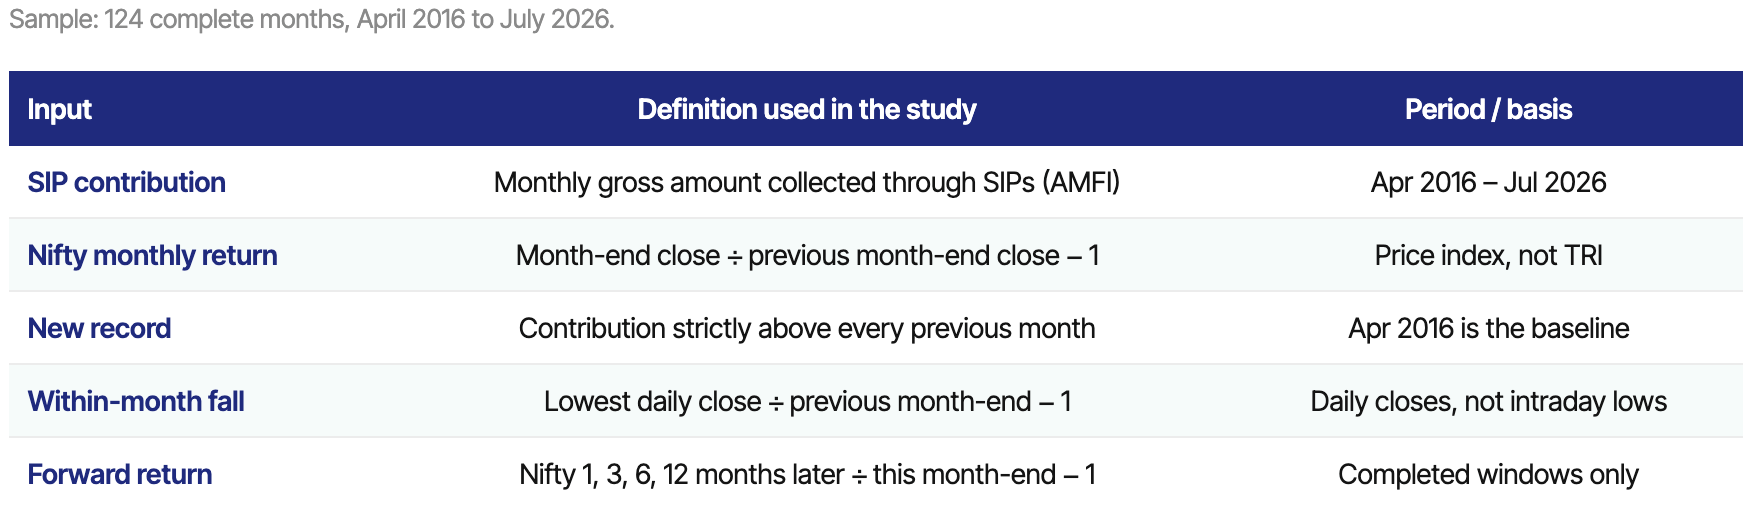
We took AMFI’s monthly SIP contribution data from April 2016 to July 2026 and matched it with the Nifty 50 return for each month.
That gave us 124 months of data.
We then looked at four simple things. First, whenever SIP contributions hit a new record, did the Nifty go up or down? And was that any different from other months?
Second, how often did the Nifty fall by at least 2%, 5% or 10%? We checked both the month-end return and the lowest daily close reached during that month.
Third, when the Nifty fell, did SIP contributions still increase from the previous month?
And finally, when a record SIP month ended with the Nifty falling, what happened to the market 1, 3, 6 and 12 months later?
The first question was our main test, and we decided on it before looking at the results.
The chart shows how SIP contributions kept rising through most of the period, even when the Nifty was going through sharp falls.
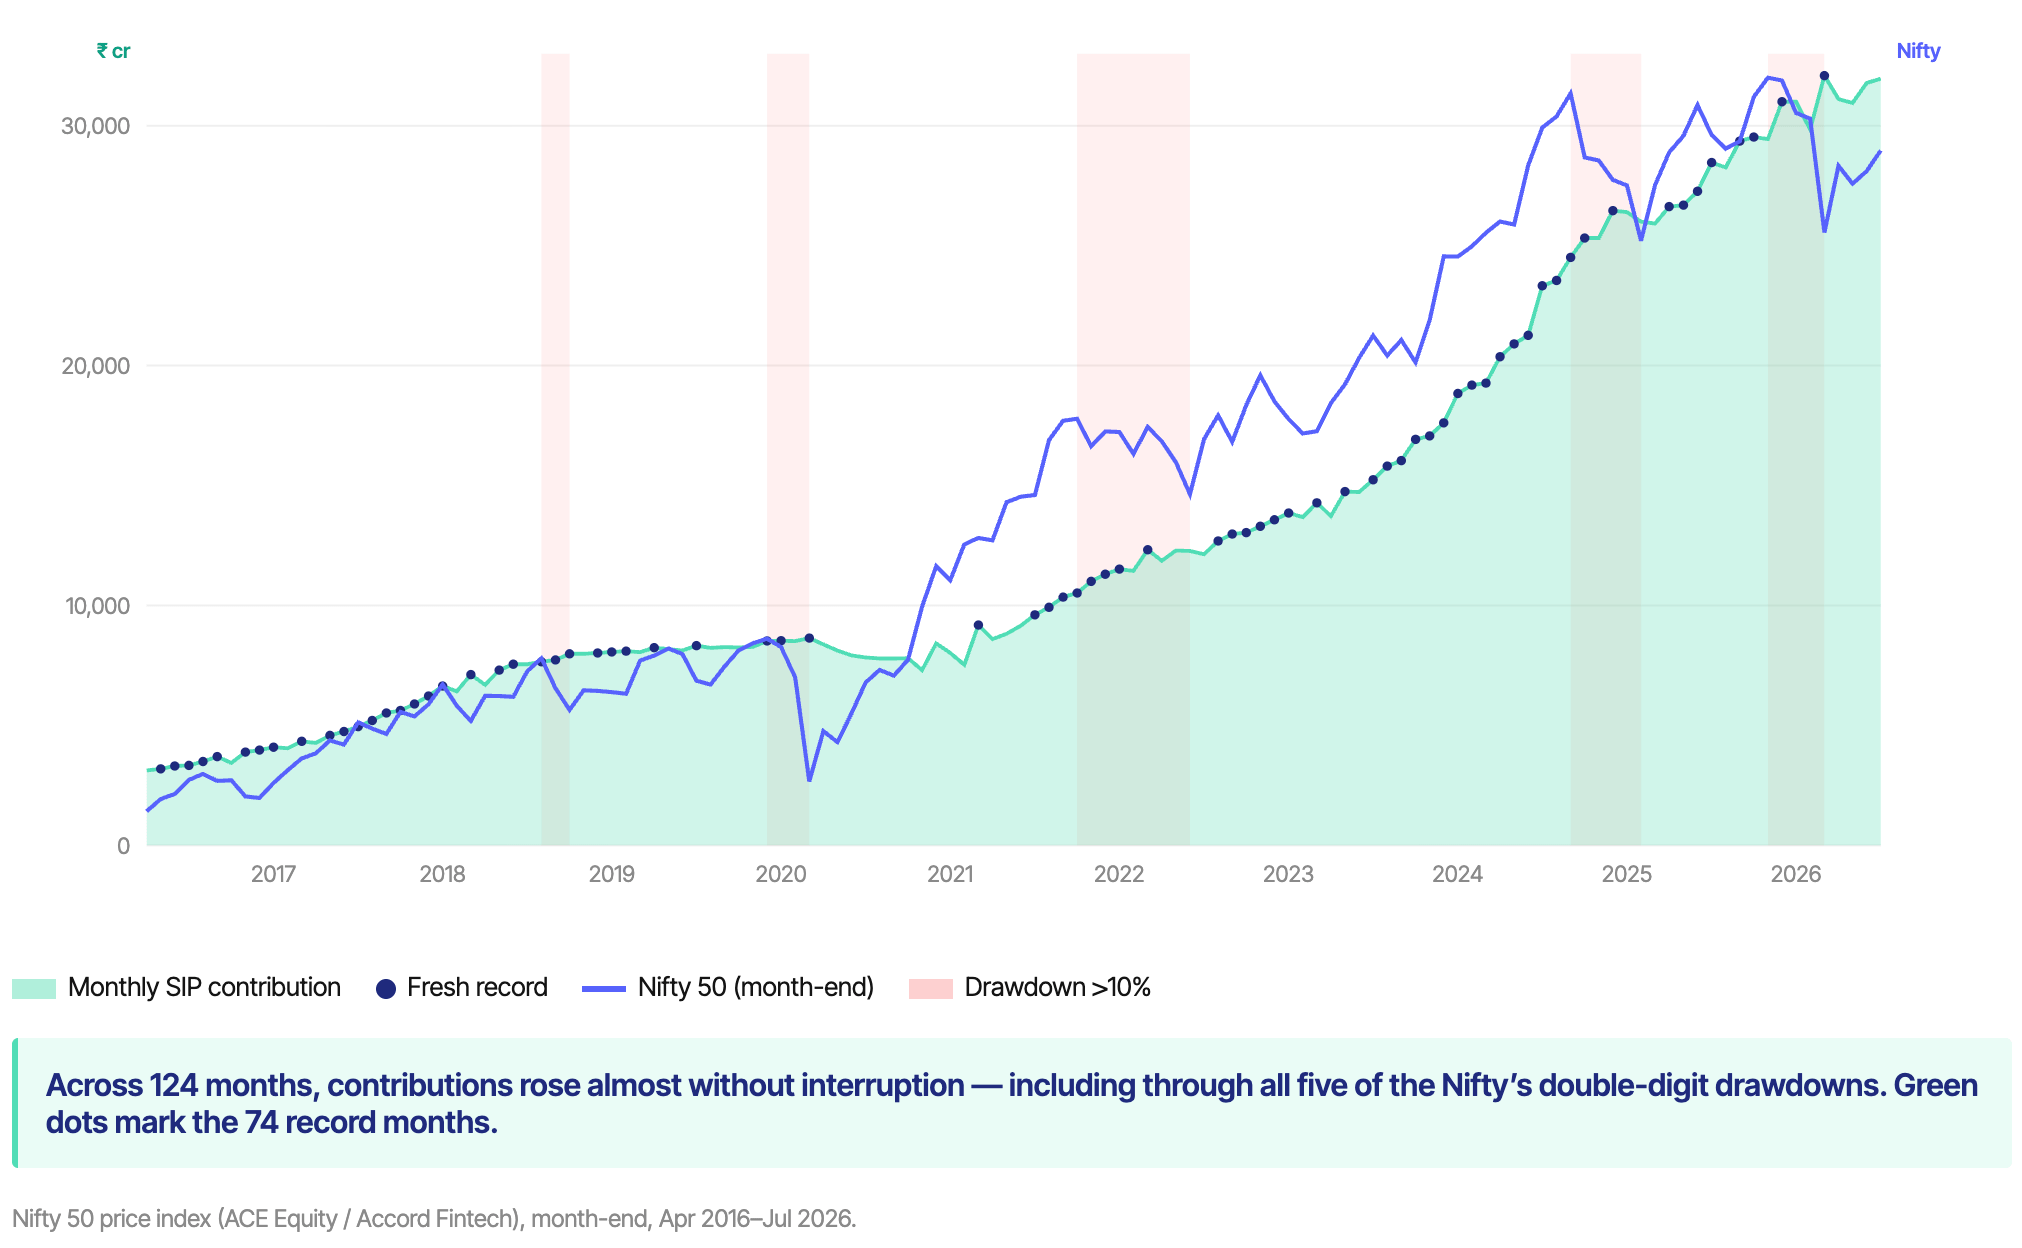
The black dots mark every month when SIP contributions reached a new record. The shaded red areas mark periods when the Nifty was down more than 10% from its earlier high.
Record SIP months were common, but they were not safer
We first looked at every month when SIP contributions reached a new record.
That happened quite often. After April 2016, 74 of the next 123 months set a new high in SIP contributions, about three out of every five months.
So we wanted to see whether the market behaved any differently during these record SIP months.
It did not.
The Nifty fell in 43% of record SIP months, compared with 41% of other months. That is almost no difference.
And the same pattern held when we looked at bigger falls.
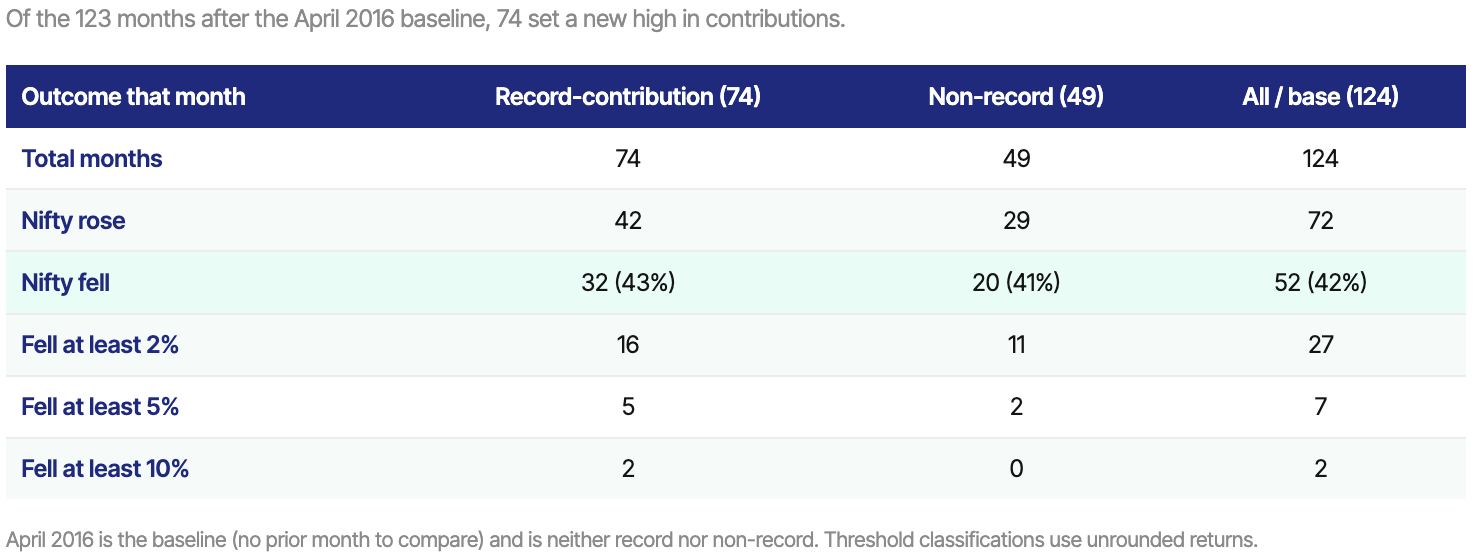
Even when SIP contributions were at a record, the Nifty could still fall sharply during the month. So record SIP contributions were clearly bringing more money into mutual funds, but those months were not noticeably safer for the market.
Simply knowing that SIP contributions had hit a new high did not make a falling month any less likely.
SIP contributions continued to rise during major market declines
Since April 2016, the Nifty went through five declines of more than 10% from a market high to a later low.
In every one of those declines, monthly SIP contributions were actually higher by the time the market reached the bottom than they were when the fall began.
These are multi-month, peak-to-trough moves on month-end closes, a different measure from the single-month returns used elsewhere. Measured on daily closes, the same declines were deeper still.
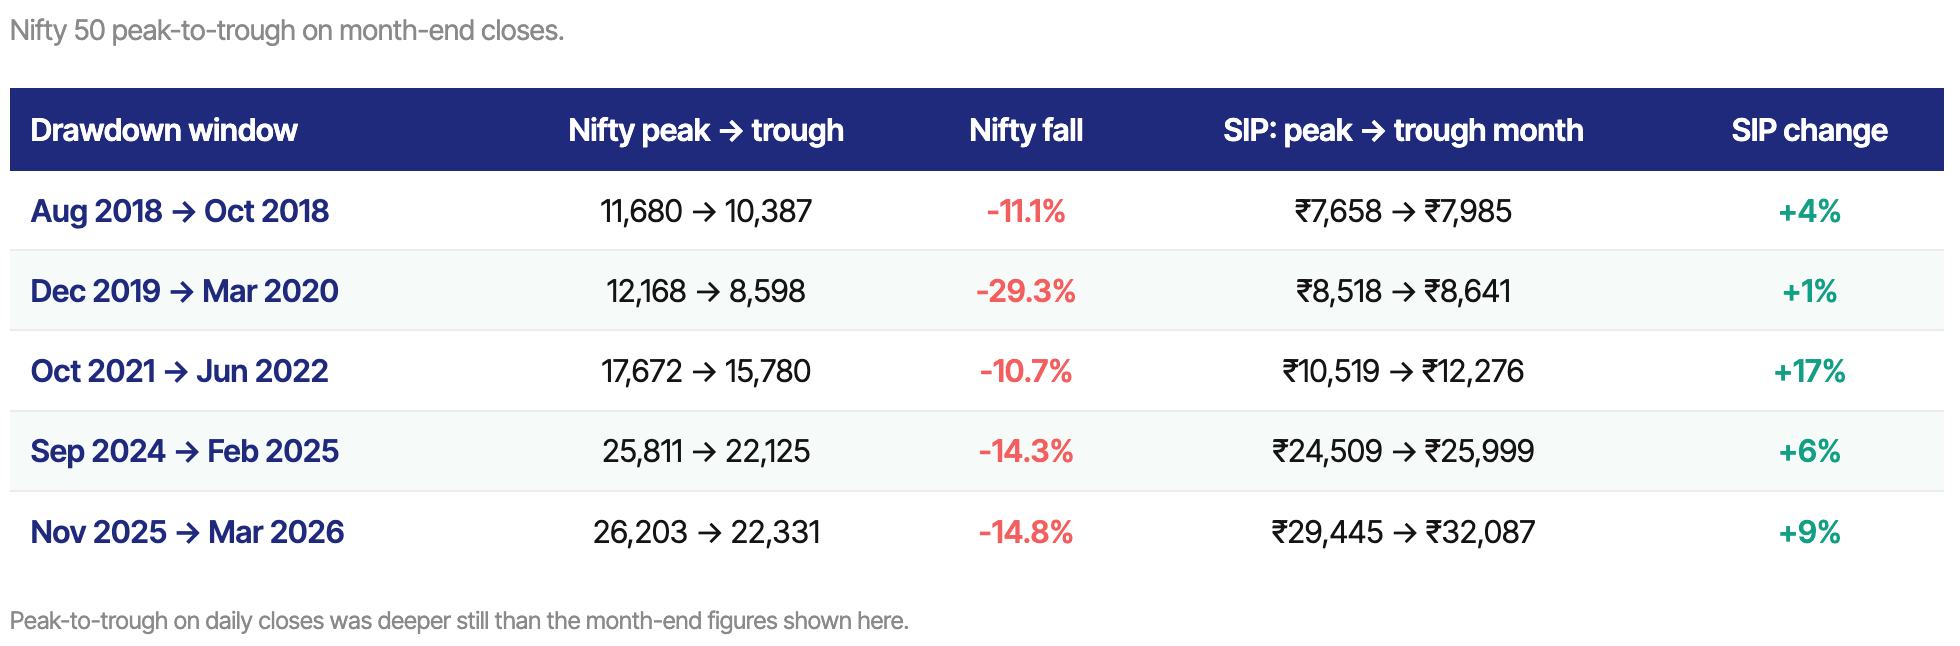
So SIP investors kept contributing even while the market was going through large falls.
Another way to test the SIP-floor idea is to compare months with low and high SIP contributions.
If larger SIP contributions were making the market more stable, then months with the highest SIP contributions should have been less likely to end in a fall.
We divided all 124 months into three roughly equal groups based on SIP contribution levels: low, middle and high.
The Nifty fell in 38% of low-SIP months, 46% of middle-SIP months and 41% of high-SIP months.
So months with the highest SIP contributions were not clearly less likely to fall than months with lower SIP contributions.

Looking at both the larger market falls and the different levels of SIP contributions, the result was similar. SIP contributions kept coming in during falling markets, but higher contributions did not make falling months clearly less common.
There is one limitation to this comparison. SIP contributions generally grew over time, so the low, middle and high groups also roughly represent different periods of the market. That means we cannot say SIP contributions caused, or prevented, any particular market move.
Also, these are gross SIP contributions. They do not include redemptions by other mutual fund investors.
So the data only shows that SIP contributions continued during market falls. It does not mean there was no selling happening at the same time.
SIPs did not stop the fall, but investors kept investing through it
This is where the SIP story becomes more interesting.
The data does not show that SIPs prevented market falls. But it does show that contributions often kept rising even while the Nifty was falling.
Out of the 52 months when the Nifty ended lower, SIP contributions were still higher than the previous month in 33 cases. The same pattern continued during sharper falls too.
That is an important difference.
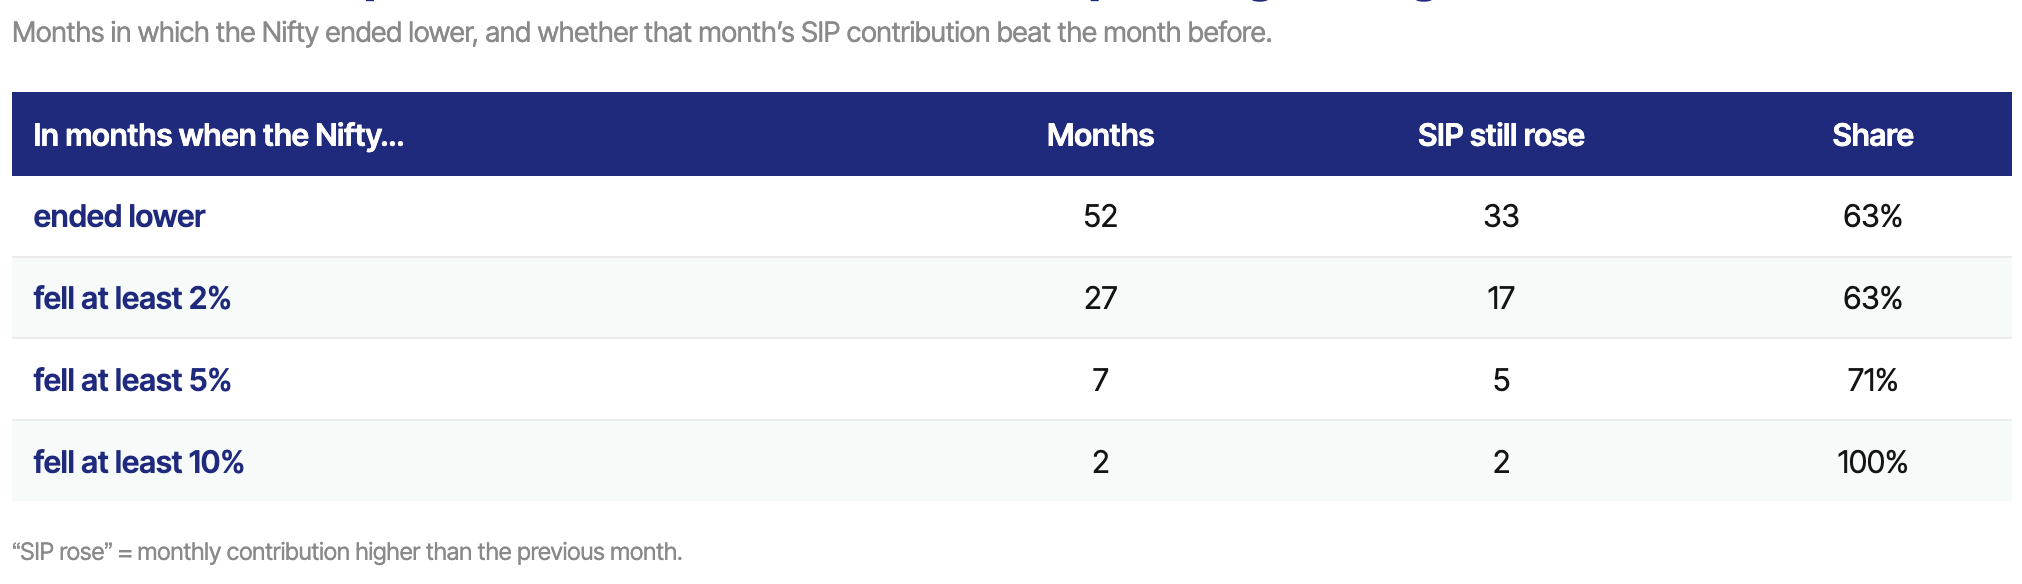
The strength of a SIP is not that it stops the market from falling. It is that the investment can keep happening without the investor having to make a fresh decision every time the market turns negative.
When markets fall, a person investing manually may hesitate, wait for things to improve, or simply stop buying for a while. A SIP keeps following the standing instruction unless the investor actively changes it.
So the clearest evidence of SIP resilience in this data is not a market floor. It is that investors kept contributing even through periods when the market was falling.
After a fall, the Nifty was usually higher later
There is one more part of the SIP-floor idea to test.
Even if SIP money does not stop the market from falling, perhaps it helps the market recover faster afterwards.
So we looked at the 32 record SIP months in which the Nifty ended lower and checked where the index was 1, 3, 6 and 12 months later.
A year later, the Nifty was higher than that falling month’s close in 28 of 30 completed cases, or 93%.
But the result was almost exactly the same when we looked at all falling months, not just record SIP months. After 12 months, the Nifty was higher in 43 of 46 cases, also 93%.
So record SIP months did not show a clearly better recovery pattern.
One thing to keep in mind is that “higher” only means the Nifty was above the close of the falling month. It does not necessarily mean the market had recovered everything it had lost before that month.
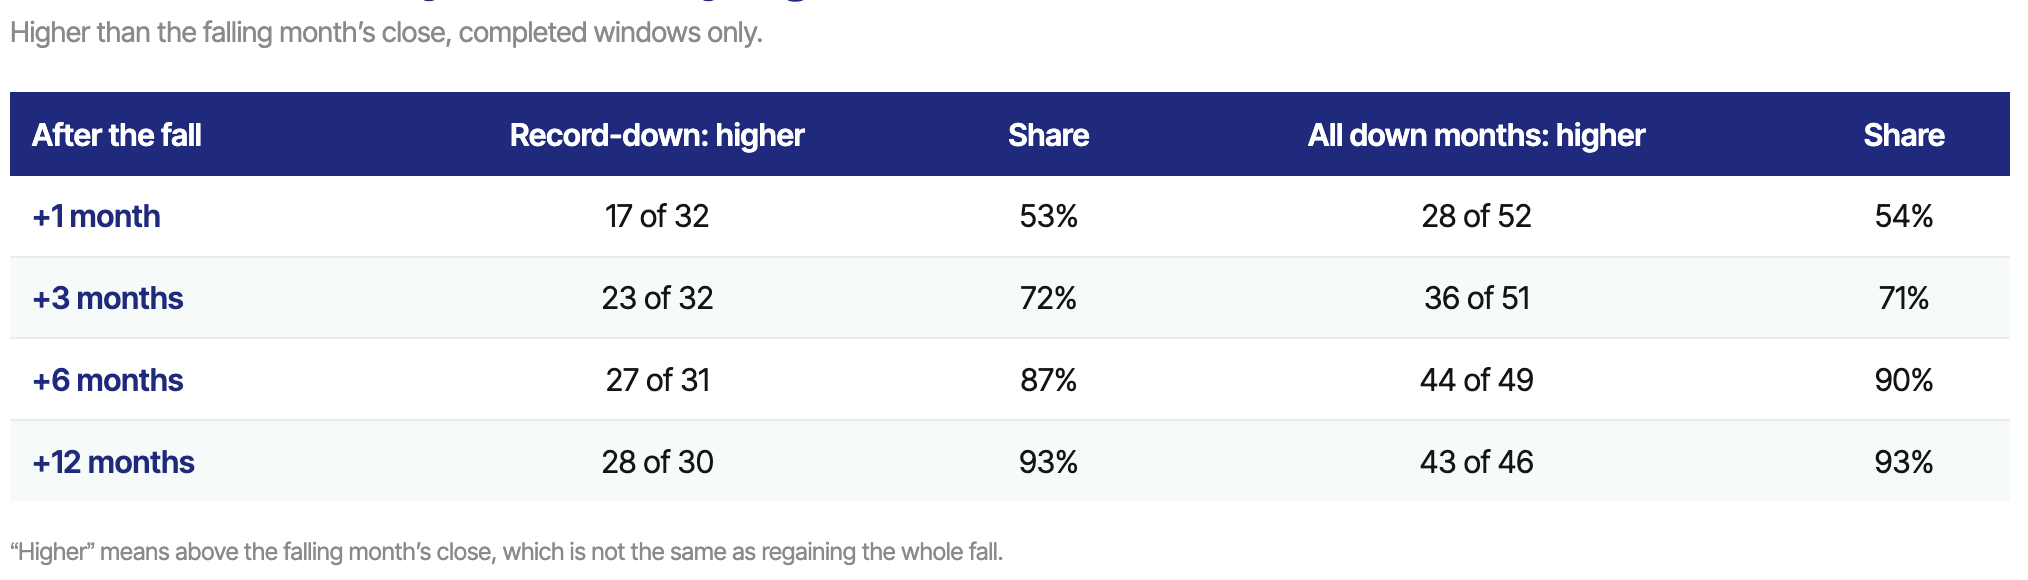
The broader point is that a bad month was often followed by a higher Nifty over the next year. But record SIP contributions did not make that recovery clearly faster.
For an SIP investor, the benefit was different. The investment simply kept going through the fall, even when nobody knew how quickly the market would recover.
So why doesn’t record SIP money stop the market from falling?
The main reason is simple. SIP contributions are not the same as direct buying of Nifty 50 stocks.
The SIP number reported by AMFI includes money going into different kinds of mutual funds, including equity, debt, hybrid, gold and international funds. So the entire monthly SIP amount does not go into the stock market.
It is also a gross contribution number. It tells us how much money came in through SIPs, but not how much other investors withdrew from mutual funds or how much funds actually invested in equities that month.
Timing matters as well. The Rs 32,087 crore contributed in March 2026 did not enter the market on one day. SIP instalments came in on different dates throughout the month, while stock prices were changing every day.
And regular buying does not mean prices cannot fall. If there is enough selling pressure, prices can still move lower. SIP money may provide some support, but it cannot stop the market from falling.
That is also what the data showed. Record SIP months were not clearly safer for the market. Large falls still happened even as SIP contributions kept rising, and the Nifty did not recover noticeably faster after record SIP months.
But that does not mean SIPs do not matter. Their strength is simply somewhere else.
SIP money may not stop the market from falling, but it can help investors keep investing through those falls.
Very good analysis
I appreciate your research on SIPz mindset & it is too worthy *& knowledgeable article 👏 thanks a lot 🙏 sirji