

When the US sneezes, the world catches a cold.
A common phrase implying how greatly the American economy affects the rest of the world.
This is largely true for India as well. After all, the US is one of the biggest buyers of Indian exports.
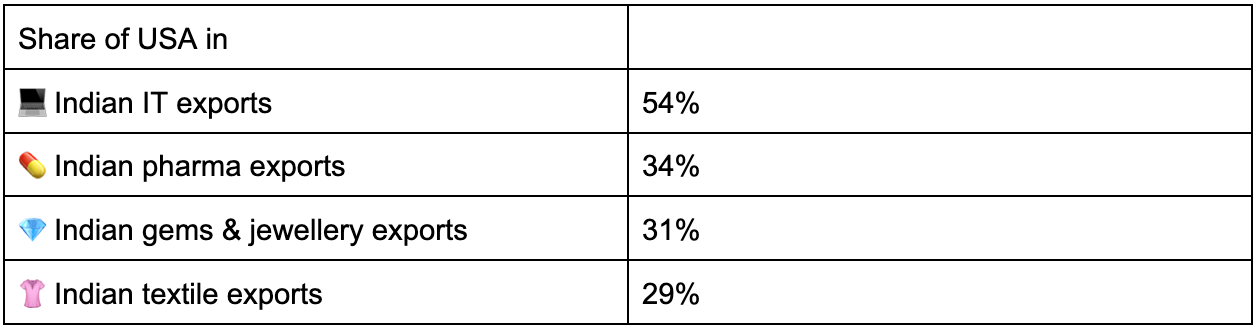
And it is not just about India. In fact, the US is the world’s biggest importer, a true ‘shopaholic.’
In 2023 alone, the country bought $3 trillion worth of goods from around the globe. To put that in perspective, this figure is greater than Italy’s entire GDP and almost five times larger than India’s total imports that year.
Given its sheer size, any movement in the US economy is bound to be felt by others as well.
But the question is, to what extent?
When it comes to the Indian economy and markets, how strongly are we impacted by developments in the US?
To know this, we tried checking how closely India mirrored the mood of the US markets.
We examined the period beginning 2005 to determine the frequency with which the Nifty 50’s daily closing sentiment mirrored that of the US market on the preceding day.
For example, if the S&P 500 closed in the red on 3rd January 2005, did the Nifty 50 also close in the red on 4th January 2005, or did it move in the opposite direction?
If the answer was “yes” for most trading days, it means that US markets play a significant role in influencing Indian markets; if not, then maybe we are just not as intertwined as initially assumed.
So here is what we found:
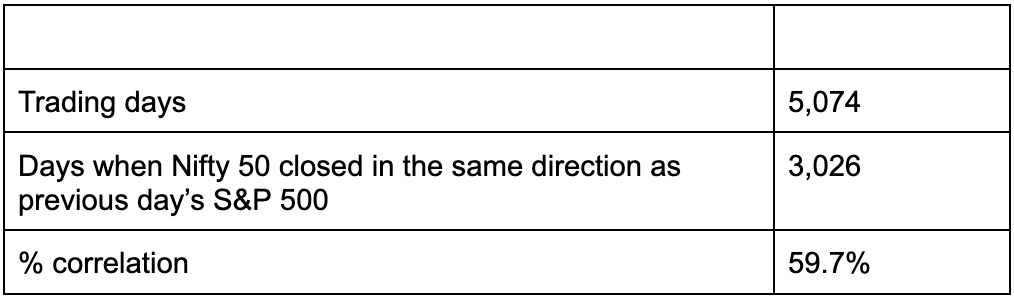
(for period between Jan 2005, to 20 Feb 2026)
So in the last 21 years, 59.7% of the time, or almost 2 out of 3 times, the Nifty 50 followed the footsteps the US left a day earlier.
While this looks like a decently strong link, let us not hurry with any conclusions and look further into.
We further checked how the Nifty behaved every time US markets made big moves (<-1% or >1%) per trading session.
Basically, if S&P went up by more than 1%, or fell -1% or lower, did Nifty 50 also rise or fall with a matching intensity the next day?
Here is what we found by looking at the last 21 years of data:
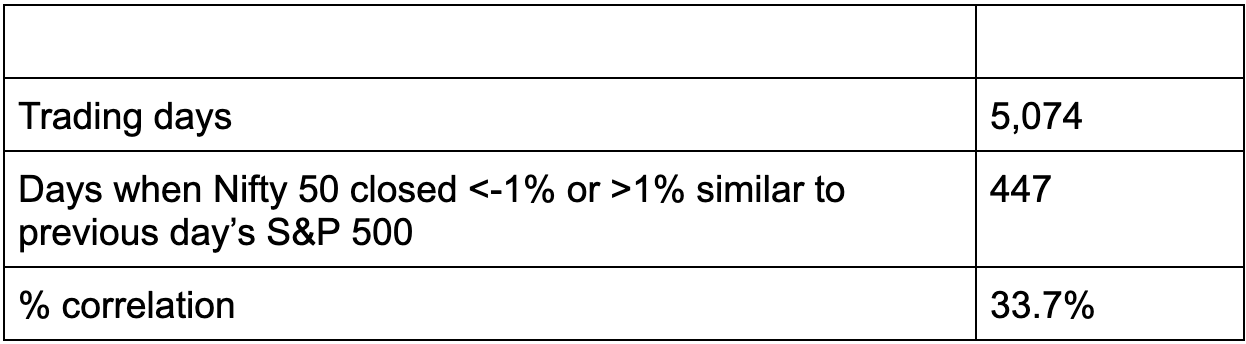
(for period between Jan 2005, to 20 Feb 2026)
Nifty 50 matched the significant market movements (<-1% or >1%) of the S&P 500 in only 33.7% of cases, or approximately one out of three times.
This was lower than the 59.7% directional alignment we found earlier.
It’s interesting to see that while there is a considerable alignment on the overall directional movement of the US & Indian markets, the intensity with which that happens may vary.
We can witness it in some more instances too.
For example, Indian markets did crash alongside the US markets in the 2008 financial crisis, but the Nifty touched the pre-crash peak in a little over 480 days, while S&P 500 took more than 970 days to recover to pre-crash levels.
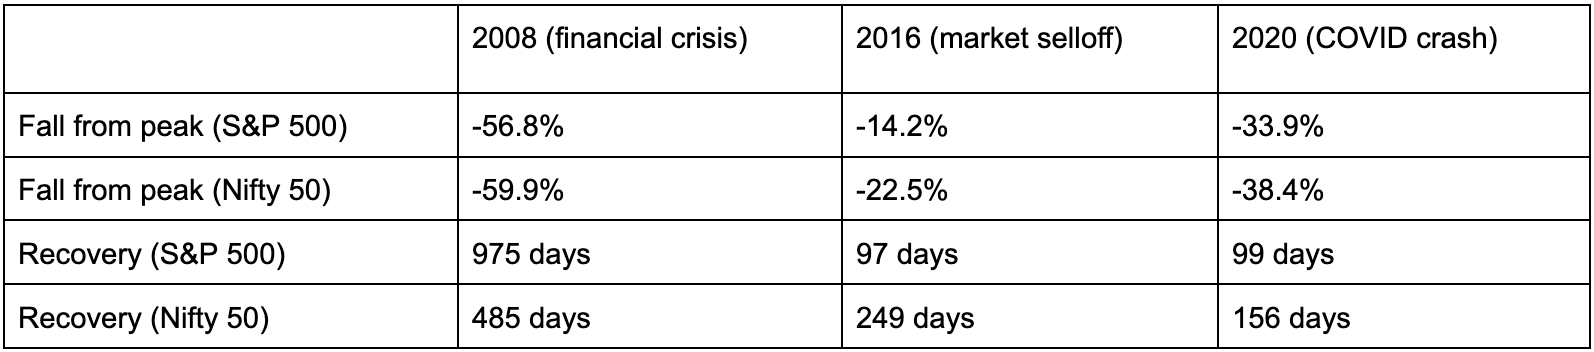
(recovery period in approx trading days, from trough to pre-fall peak)
Hence, although there are notable overlaps between the Indian and US markets, asserting that the Indian markets are a perfect reflection of the US markets would be an overstatement.
Note:
The analysis results may differ if a different timeline, country, or indices are considered.
In the comparison b/w S&P 500 (T) and Nifty 50 (T+1) comparison, for ease of calculation some dates have been omitted due to respective holidays in each market.