

One of the biggest forces affecting Indian markets in 2025 didn’t originate in Mumbai or Delhi. It came from Washington.
The US Federal Reserve had sharply raised interest rates to levels not seen in decades. By 2025, US government bonds were offering yields close to 5%.
That might sound like a small detail. But for global investors managing trillions of dollars, it completely changes the math.
When a risk-free asset in dollars starts offering around 5%, the incentive to take additional risk falls. Investors begin comparing that guaranteed return with the volatility and currency risk present in emerging markets like India.
And that comparison quietly reshapes capital flows.
This is where Foreign Institutional Investors (FIIs) come in.
FIIs represent large global pools of capital: pension funds, sovereign wealth funds, hedge funds, and international asset managers. Unlike domestic investors, they allocate money across multiple countries, constantly shifting capital toward the best risk-adjusted opportunities.
Most importantly, they think in dollar returns, not rupee returns.
So when US yields rise and the dollar strengthens, emerging markets automatically start looking less attractive on a relative basis.
That shift rarely appears directly in headlines about Indian equities. But it shows up clearly in capital flows.
And that is exactly what happened in 2025.
As US yields stayed elevated and the dollar remained strong, FIIs gradually reduced their exposure to Indian equities. Over the course of the year, net selling reached roughly Rs 1.6 lakh crore.
What is interesting is that while FIIs were selling, Domestic Institutional Investors (DIIs) were steadily buying.
Mutual funds continued receiving strong SIP inflows from retail investors. Insurance companies deployed long-term capital. Pension funds and domestic asset managers added liquidity to the system.
The supply created by foreign selling was absorbed by domestic participation.
The result was interesting. Despite heavy foreign selling, markets did not collapse proportionately.
If FIIs sold over Rs 1.5 lakh crore and markets did not crash proportionately, then maybe the relationship is not as simple as we think.
For years, many investors have assumed that FIIs move the Indian market. When they buy, it is seen as positive. When they sell, it is seen as negative.
But is that really true?
Do FIIs actually decide where the market goes?
Or are they reacting to global conditions that also influence prices?
And when they sell, does that automatically cause markets to fall?
We studied the data from 2007 and collected daily FII flows, daily DII flows, and daily Nifty returns. We examined whether FII activity predicted market movement or whether markets moved first and FIIs reacted.
The Experiment
To test whether FIIs really move the market, we went beyond 2025 and studied long-term data.
We collected daily FII flows, DII flows, and Nifty returns starting from 2007. That gave us more than 4,400 trading days across different market cycles
Starting from 12-Nov-2007 to the latest available date
Total observations:
4,402 trading days (Daily data)
221 months (Monthly aggregated data)
Study 1: Same-Day Relationship
We compared FII buying and selling with the market’s movement on the same day.
At the monthly level, we compared net institutional flows with monthly market returns.
This shows whether institutional activity and market movement tend to align in the same period.
Study 2: Who Moves First
We shifted the dataset by one day and checked whether yesterday’s institutional flows were followed by market movement the next day.
This helps see whether flows tend to lead the market or react to it.
Study 3: When FIIs Sell
We examined periods where FIIs were selling while DIIs were buying, both at daily and monthly levels.
This helps show whether domestic investors are absorbing foreign selling pressure and helping stabilise the market.
Results
STUDY 1
We first looked at whether institutional buying or selling on a given day aligns with how the market closes that same day.
The dataset covers 4,402 trading days.
The table below shows what tended to happen when FIIs or DIIs were buyers or sellers on a given day.
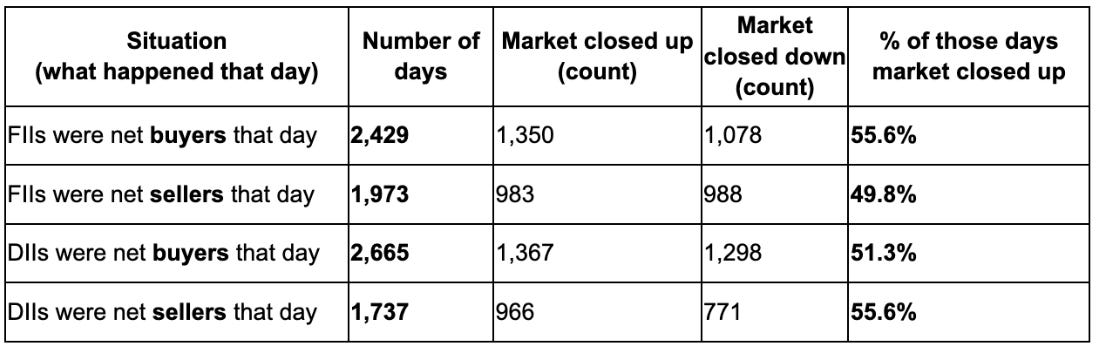
Looking at the daily data, the relationship between institutional flows and market direction is fairly weak.
When FIIs bought, the market went up about 56% of the time. That is slightly better than random, but not strong enough to say FIIs reliably move the market on a given day.
When FIIs sold, the market still went up almost half the time. So daily FII selling does not automatically result in a falling market.
The same pattern appears with DIIs. Their daily buying or selling does not consistently determine whether the market closes higher or lower.
However, once we zoom out to the monthly level, the picture changes significantly.
The table below shows how the market behaved during months when institutions were net buyers or sellers.
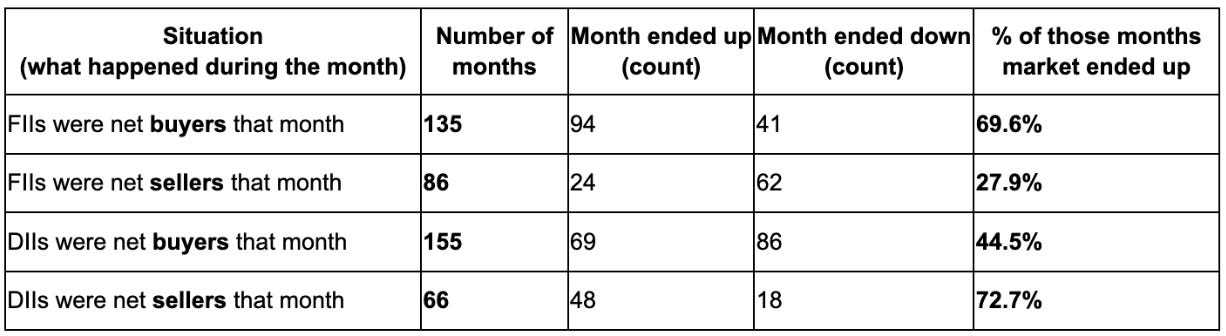
At the monthly level, the pattern becomes much clearer.
When FIIs were net buyers for the month, the market ended the month higher about 70% of the time.
When FIIs were net sellers for the month, the market ended lower about 72% of the time.
This suggests that over longer periods, FII behavior tends to move with broader market trends. They typically buy during strong phases and reduce exposure during weaker periods.
DIIs show almost the opposite pattern.
When DIIs were buyers during the month, the market actually ended down more often than up.
When DIIs were sellers, the market ended up in nearly 73% of those months.
This suggests DIIs often behave counter-cyclically. They tend to buy during weaker phases and sell into strength, effectively providing liquidity when foreign investors are moving strongly in one direction.
Putting both views together gives a clearer picture.
At the daily level, institutional flows and market direction are only loosely related. The numbers stay close to 50%, which means day-to-day movements are mostly noise.
At the monthly level, patterns start to appear.
FIIs tend to move with market trends, increasing exposure during strong phases and reducing it during downturns. DIIs often behave in the opposite way, buying during weakness and selling during strength.
But even here, the interpretation should remain careful.
The data does not mean institutions directly control the market. Instead, both flows and market direction appear to be responding to larger macro forces such as liquidity conditions, global risk sentiment, and economic trends.
The key takeaway from Study 1 is simple.
The idea that “FIIs move the market” is too simplistic.
At the daily level, the relationship is mostly noise. At the monthly level, there is stronger alignment, but it reflects trend participation rather than direct control. Markets and institutional flows tend to move together during sustained cycles because both respond to the same broader forces.
STUDY 2
To test whether institutional flows lead the market or react to it, we shifted the dataset by one trading day.
Period analysed: 12 Nov 2007 onwards
Total observations: 4,401 trading days
This allows us to compare yesterday’s activity with what happens today.
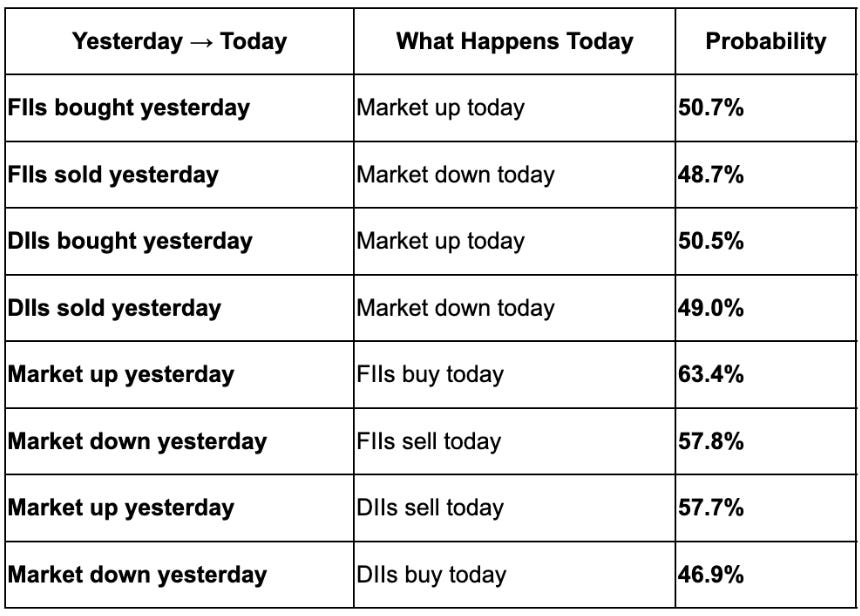
The table below shows how yesterday’s institutional activity and market movement relate to what happens the next trading day.
What it tells us
Yesterday’s institutional flows do not predict today’s market move.
If FIIs bought yesterday, the market went up today about half the time.
If they sold yesterday, the market still went up about half the time.
That is essentially random.
But when the direction is reversed, a pattern appears.
After the market rises, FIIs are more likely to buy the next day. After the market falls, they are more likely to sell. This suggests FIIs often follow short-term momentum.
DIIs show a mild tendency to move the other way. They are slightly more likely to sell after market rises and buy after declines, which is consistent with a liquidity-providing role.
However, even this pattern should not be interpreted too strongly.
The highest number in the table is 63%. This means that after the market rises, FIIs buy the next day about 6 out of 10 times. That shows a tendency, but it is far from a reliable rule. In roughly 4 out of 10 cases, the opposite still happens.
So while the numbers hint that institutions may react to recent market movement, the evidence is not strong enough to make a firm conclusion about causality.
The safest interpretation is that daily movements in markets and institutional flows are loosely related, but neither consistently predicts the other. Both are likely responding to the same broader forces, such as liquidity, news, global markets, and investor sentiment.
STUDY 3
When FIIs Sell
The final study looks at a simple but important question.
When FIIs sell, what do DIIs do? Do domestic institutions absorb the selling? And if they do, does that prevent the market from falling?
We examined this at both the daily level and the monthly level.
Daily data
Dataset: 4,402 trading days
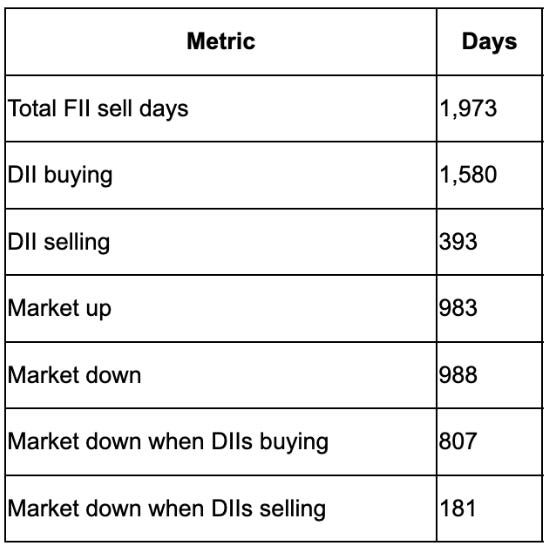
The table below shows what happened on days when FIIs were net sellers.
FII Selling Days
What this shows
On the 1,973 days when FIIs sold, DIIs bought on 1,580 days.
That means DIIs stepped in to buy on roughly 80% of FII sell days. This clearly suggests domestic institutions frequently absorb foreign selling.
However, this absorption does not prevent market declines.
The market still fell 988 times, and 807 of those declines happened even when DIIs were buying.
In other words, domestic buying often reduces imbalance, but it does not necessarily stop the market from falling.
Monthly Data
Dataset: 221 months
The table below shows what happened during months when FIIs were net sellers.
FII Negative Months
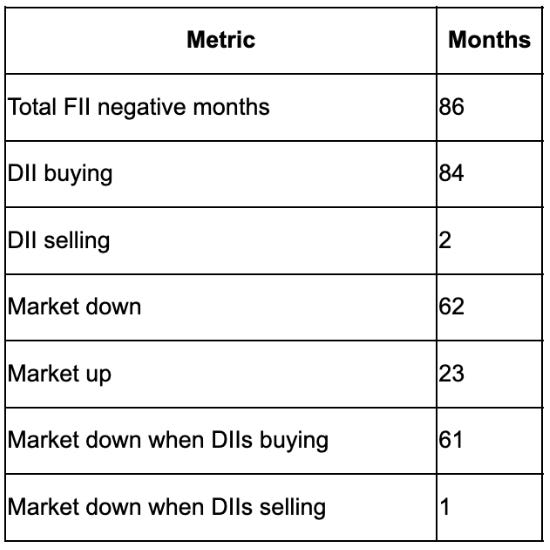
At the monthly level, the absorption pattern becomes even stronger.
When FIIs were net sellers for the month, DIIs bought in 84 out of 86 months. That means domestic institutions almost always step in when foreign investors sell.
But even then, the market still fell in 62 of those months.
So while DIIs absorb the flows, that absorption does not override broader market direction.
This reveals a clear structural pattern.
DIIs consistently absorb FII selling. This happens both at the daily level and the monthly level, and it becomes even stronger during large foreign outflows.
However, absorption does not guarantee market stability.
Even when domestic investors step in, markets can still decline if broader conditions remain weak. Global risk sentiment, liquidity cycles, interest rates, and macroeconomic expectations continue to play a much larger role in determining trend direction.
The deeper takeaway is simple.
DIIs act primarily as stabilisers. They provide liquidity and help prevent extreme dislocations.
But they do not necessarily reverse trends.
When FIIs sell heavily for extended periods, the broader macro environment tends to dominate. Domestic absorption can cushion volatility, but it does not fully offset sustained global capital movement.
In short, absorption helps stabilise markets, but it does not control market direction.
good research topic by GROWW !
no other fund house is participating in such interesting topics !
an eye opener to the myth prevailing !