

In the second half of the 1980s, Japan’s property prices started rising, especially in bigger cities like Tokyo and Osaka.
It was not just property prices. Even the stock markets hit all-time highs.
The Nikkei 225, Japan’s main stock market index, rose to a record high in December 1989.
It was the peak of Japanese markets for the next 34 years. It reached that level again only in 2024.
This rise in land and share prices gave banks more confidence to lend to companies.
The idea was even if the company struggled to repay, the property or other assets it had put up as collateral would be valuable enough to cover the loan.
Companies took advantage of this easy money.
They borrowed more, bought property, and expanded into new businesses. This led to a rise in corporate debt.
This created a cycle.
As asset prices rose, companies could borrow even more. That extra money then helped push property and stock prices even higher.
But the whole system depended on prices continuing to rise.
By the early 1990s, the bubble burst. Property prices fell, the stock market crashed, and the assets backing many loans suddenly became worth much less.
Companies, however, were still left with the large debts they had built up during the boom.
Normally, some of these companies would have gone bankrupt.
But Japanese banks continued lending them money instead of letting them fail.
Why? Because if the banks admitted that these companies could not repay their loans, the banks would have to record big losses.
So the banks kept supporting companies that were already weak and struggling.
These companies stayed open, even though they were not making enough money to pay their debts properly.
These were called zombie companies.
They were not necessarily bankrupt. Their factories could still be running, employees could still be working, and they could still be earning revenue.
The problem was that a large part of what they earned was going towards paying interest. That left very little room if the business had a bad year.
And that leads to a simple question when looking at any company:
How much does the business earn compared with the interest it has to pay?
That is what the Interest Coverage Ratio, or ICR, measures.
If a company earns twenty times what it needs to pay in interest, it can still pay the interest comfortably if things go wrong than a company that can barely cover its interest once. This is because the safety cushion for the company earning more is higher.
That makes higher ICR sound like a good way to pick financially stronger companies.
But does a bigger interest cushion also mean a better stock?
So we tested two things:
Did companies with higher ICR give better stock returns?
And even if they did not, did a higher ICR at least reduce the chances of a very large fall?
The Study
We decided to test this using companies from the Nifty 100.
But we could not simply compare the ICRs of all 100 companies.
We excluded banks and lending-focused financial companies because borrowing and lending money is part of their core business. Their ICRs are not directly comparable with companies in sectors like manufacturing, IT, pharma or consumer goods.
We also removed companies that did not have enough historical ICR and adjusted share-price data to run the study from 2016 onwards, including more recently listed companies.
That left us with 59 non-financial companies.
The next question was when to start measuring the stock’s return.
Suppose a company reports an ICR of 10x for FY2018. Investors would not have known this at the start of FY2018 because the company reports it after the financial year ends.
Therefore, we used the ICR only after it became publicly available.
For each company, we collected the annual ICR from 2016 to 2025. We then waited 60 days after the financial year ended to allow time for the company to publish its annual results.
After those 60 days, we took the adjusted closing price on the next trading day and treated that as the price at which an investor could act on the ICR.
We then tracked how that stock performed over the next 12 months.
We basically tried to answer two questions:
Did companies with higher ICRs give better returns over the following 12 months?
And even if they did not, were they at least less likely to suffer a very large fall?
Results
1. Higher ICR did not give better returns
If a higher ICR helped in picking better stocks, the companies with the biggest interest cushion should have gone up more often.
But that did not happen.
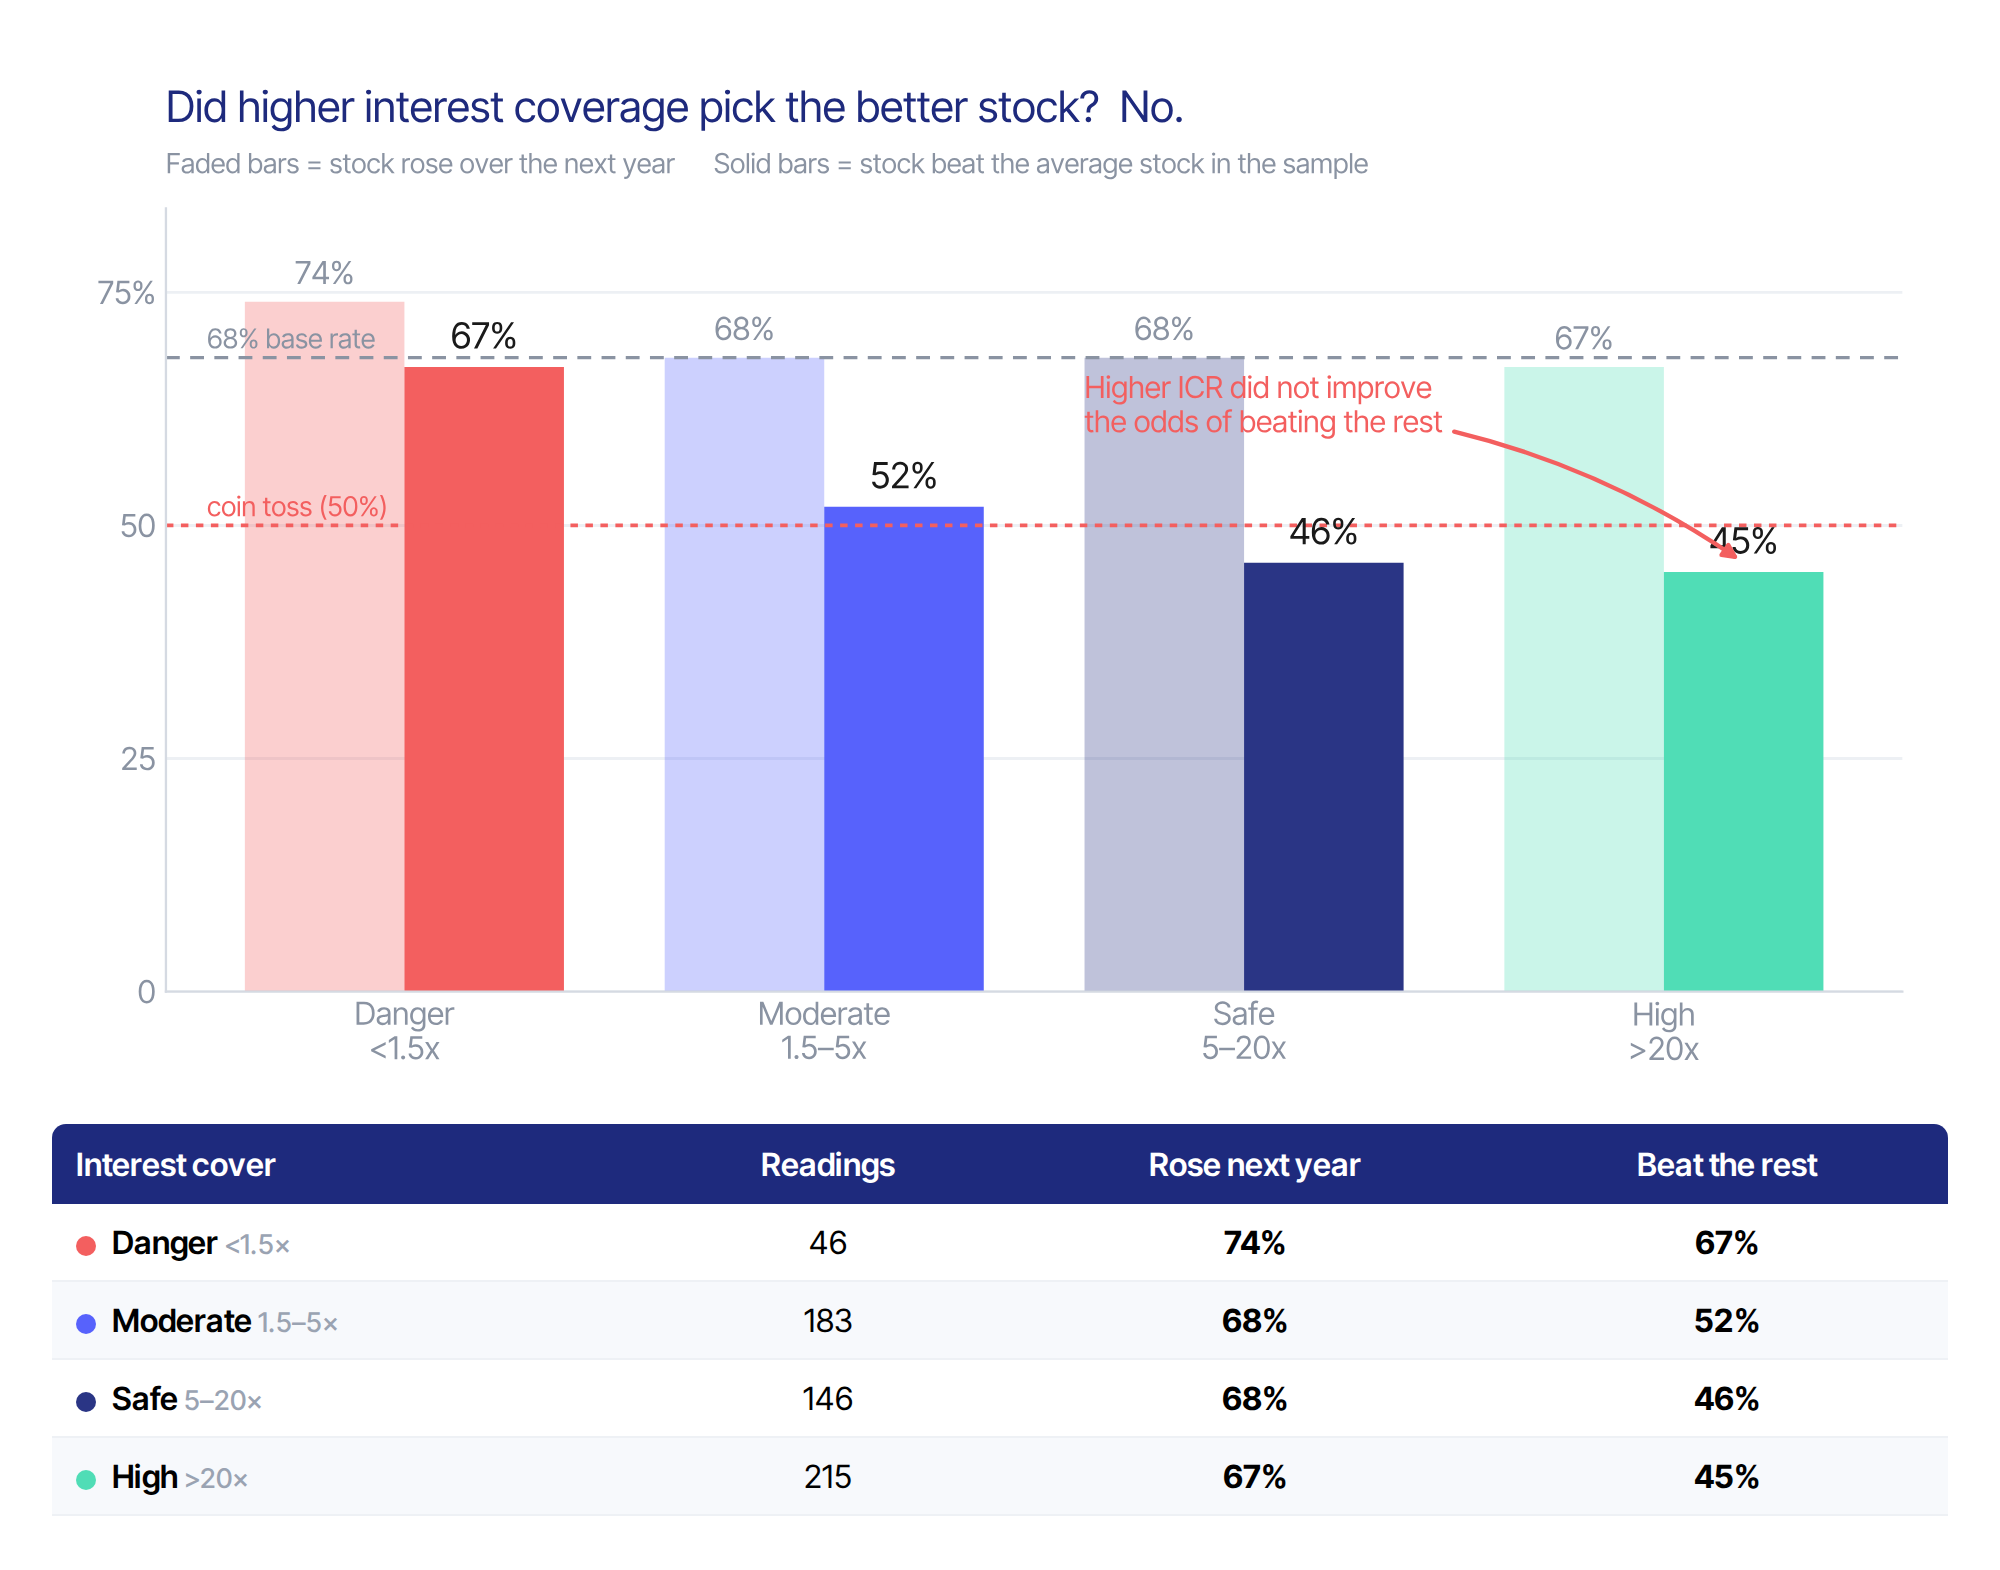
Across all 590 readings, the stock was higher one year later 68% of the time.
And this barely changed depending on the ICR.
Companies with an ICR above 20x rose 67% of the time. Companies with an ICR below 1.5x rose 74% of the time.
So having a bigger interest cushion did not make the stock more likely to go up.
But simply going up was also a fairly low bar.
Stocks in our sample were positive quite often during the period we studied. So we asked another question.
Did companies with higher ICRs at least do better than the middle stock in our sample that year?
Again, they did not.
The High group beat the middle stock 45% of the time. The Safe group did so 47% of the time, the Moderate group 52%, and the Danger group 65%.
The Danger group was also much smaller, with only 46 readings. So the point is not that low-ICR stocks were better. The important thing is that there was no pattern where returns improved as ICR increased.
This does not mean that low-ICR companies were better stocks to buy.
It simply means that a bigger interest cushion did not give us a reliable advantage when it came to returns.
Cummins India is a good example.
In the 2019 reading, the company was covering its interest almost 65 times over.
That is an extremely comfortable ICR.
But over the following 12 months, the stock still fell by around 52%.
The company could comfortably pay the interest on its debt.
But that did not tell us where its share price would go next. And that is because ICR only tells us one part of the story.
It tells us how comfortably a company can pay its interest.
It does not tell us whether the stock is expensive, how fast the business will grow, whether profits will disappoint, or what investors will expect from the company next.
So a financially comfortable company does not automatically become a better-performing stock.
2. But higher ICR did reduce the chance of a very large fall
This is where the result changed.
We looked at how far each stock fell from a peak to a later low during the following 12 months.
We then counted how often that fall crossed 30%, and how often it crossed 50%.
Here, a higher ICR did make a difference.
In the Danger group, ICR was below 1.5x. That meant there was relatively little room between operating profit and the interest bill. Some readings were below 1x, where operating profit did not fully cover the interest cost.
Among these companies, 43% saw their share price fall by 30% or more. Around 22% saw a fall of 50% or more.
In the Moderate group, those numbers fell to 31% and 10%.
In the Safe group, they fell further to 27% and 4%.
And among companies with an ICR above 20x, 24% saw a fall of 30% or more, while only 3% saw a fall of 50% or more.
So as the interest cushion increased, very large falls became less common.
This does not mean that high-ICR stocks could not fall.
They did.
But the chances of suffering the really deep falls were much lower.
So while ICR did not tell us which stock would rise, it did tell us something about the risk of a very large fall.
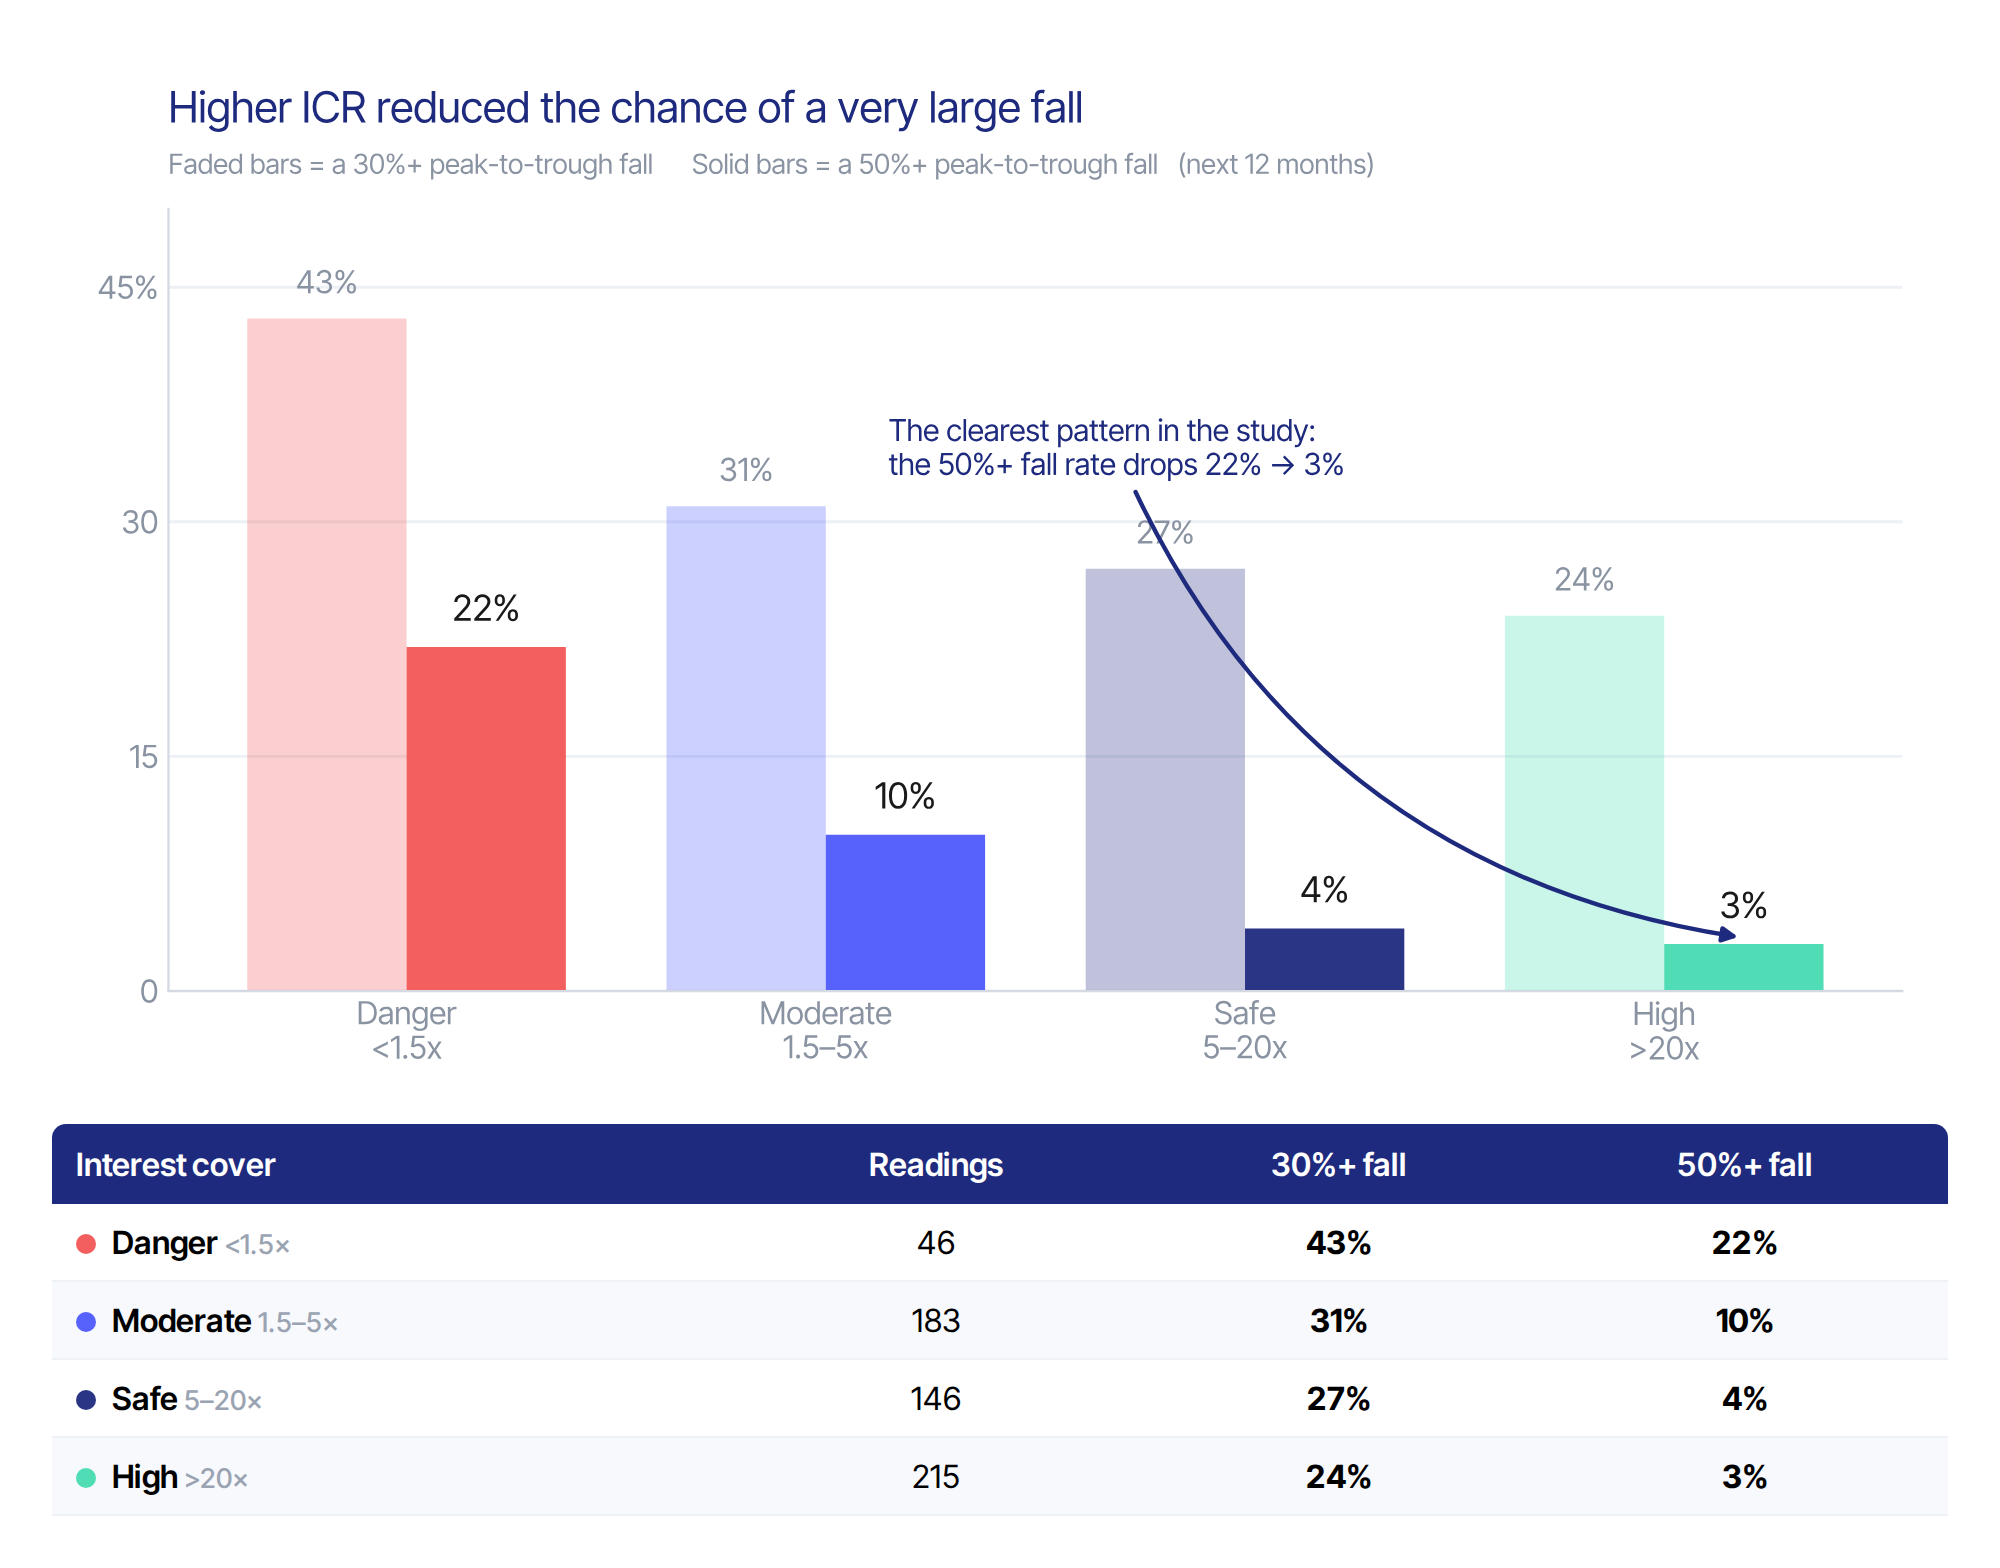
This was the clearest pattern in the study: very large falls became less common as ICR increased.
But there was another interesting part of the result.
Some of the biggest winners also came from the weakest ICR group.
CG Power had negative interest cover in the 2020 reading. Its share price went from around Rs 6 to around Rs 84 over the following year.
Tata Steel had an ICR of around 0.8x and its stock roughly tripled over the next 12 months.
That does not mean investors should look for companies with weak interest coverage.
The same low-ICR group also saw the highest number of very large falls. So, this group contained both some of the biggest winners and some of the biggest losers.
So ICR was giving us a much clearer signal about risk than about returns.
But before treating that as a universal rule, there was one more thing we had to understand: ICR itself looks very different depending on the kind of business a company runs.
So why does ICR behave this way?
Part of the answer is that ICR is not really a free-floating number. It is closely tied to the kind of business a company runs.
Some businesses generally need less borrowing compared with the profits they earn. Many IT, FMCG and pharma companies fall into this group, so their interest bills tend to be small compared with their operating profits. That naturally pushes their ICR higher.
Other businesses need much more money upfront. Power plants, telecom networks, roads and metal plants are expensive to build, so companies in these sectors often rely more on borrowing. Their interest bills are therefore larger and their normal ICRs tend to be lower.
We could see this clearly in our data. The typical ICR was around 39x for IT and 24x for FMCG. At the other end, it was around 2.2x for power and 1.7x for telecom.
Here, “typical” means the median ICR across the readings in that sector.
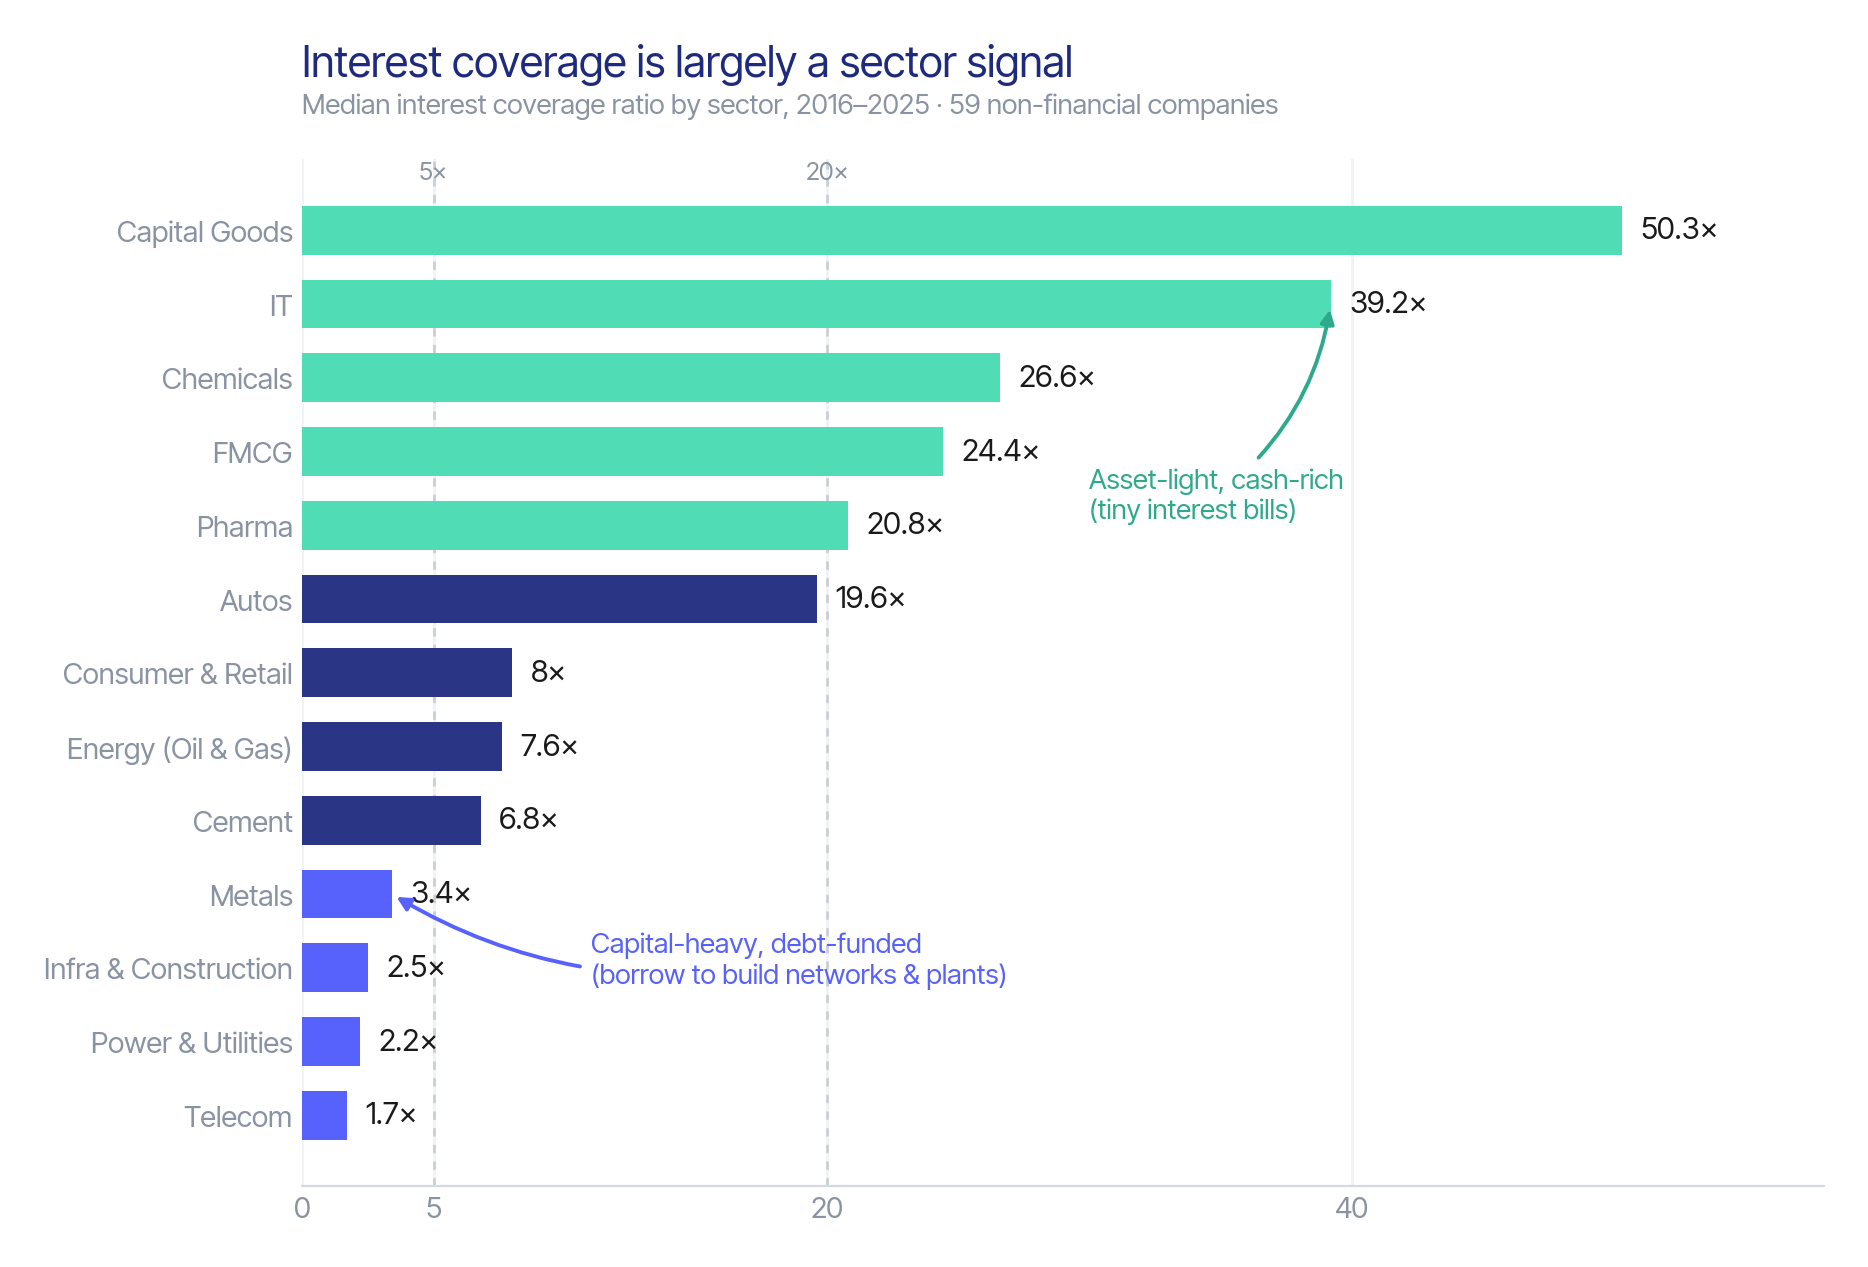
Sort companies by interest cover and you are, to a large extent, sorting them by industry.
This means that when we divided companies based on their ICR, we were not only separating companies based on their ability to pay interest.
We were also partly separating different kinds of businesses.
The High-ICR group contained more asset-light businesses.
The lower-ICR groups contained more capital-heavy businesses.
This matters because it gives us another way to understand the results.
Part of the difference we saw between high- and low-ICR companies may simply come from the kinds of businesses sitting in each group.
A company with an ICR of 5x may look weak next to an IT company with an ICR of 40x. But 5x may be much more normal for a capital-heavy business that needs large amounts of borrowing to build plants, networks or infrastructure.
So ICR is more useful when we ask not only whether the number is high or low, but also whether it is comfortable for that particular kind of business.
This also helps explain why a high ICR did not automatically lead to better stock returns. Different sectors go through different cycles. During the period we studied, several capital-heavy sectors also went through strong rallies even though their ICRs were naturally lower.
So part of what ICR was telling us was simply what kind of business we were looking at.
A high ICR often pointed towards a business that needed less borrowing relative to its profits. A lower ICR often pointed towards a business that needed more capital and therefore carried a larger interest bill.
Neither of those, on its own, tells us where the share price will go next.
So ICR turned out to be useful, but in a narrower way than we first expected. It did not help us reliably pick the better-returning stock.
What it did tell us was how much room a business had to deal with its interest bill and, in our data, companies with a larger cushion were much less likely to suffer the very deepest falls.
This mirrors what I see in client portfolios — the chase for high-return stocks while ignoring balance-sheet risk. For Indian retail investors, ICR is best used as a risk filter, not a stock-picker, especially for those nearing retirement who can't absorb a 50% drawdown.
In my practice, I emphasize debt safety for the 'sleep-at-night' sleeve, allowing more risk in the growth portion. Also, comparing ICR across sectors is misleading — benchmark against peers, not absolute numbers.
This article demonstrates that stock selection should not rely solely on templated ratios and standard ranges.