

For Indians, gold has never been just another asset.
It carries emotion, almost a tradition, a backup plan, family security, and so much more.
It is bought during weddings, festivals, Akshaya Tritiya, Dhanteras, or simply because someone in the family says, ‘Gold is gold’.
It will always have value.
And honestly, that thinking has been around for generations. When markets fall, currencies weaken, or life feels uncertain, gold has always had this reputation of being the asset people trust.
But the way we buy gold has changed a lot.
Earlier, buying gold meant going to a jewellery store, asking for the day’s rate, checking designs, paying GST, paying making charges, and finally taking home the gold.
It felt real because you could hold it in your hand. But it also came with the usual issues: extra charges, purity doubts, storage tension, and the fear of, “Where do we keep this safely?”
Around 2002, Benchmark Asset Management Company, which had launched India’s first ETF, Nifty BeES, in 2001, looked at India’s obsession with gold and filed a proposal with SEBI for a gold ETF in May 2002.
And suddenly, gold became a stock-market product. Instead of buying physical gold, investors could buy units of a Gold ETF on the exchange. These ETFs were designed to track the price of gold and could be bought and sold like shares.
But that created a new problem.
To buy a Gold ETF, an investor needs a demat account and has to place orders on the exchange. They also have to think about market price, liquidity, bid-ask spread, and whether the ETF is trading close to NAV.
For many long-term SIP investors, it can feel like extra work.
Which leads us to Gold Fund of Funds.
A Gold FoF, or Fund of Fund, is a mutual fund that does not directly buy physical gold. Instead, it invests in a Gold ETF, usually from the same fund house.
So, when an investor puts money into a Gold FoF, their money indirectly goes into a Gold ETF. This gives them gold exposure through the normal mutual fund route, without needing to buy the ETF directly through a demat account.
This is convenient, but it raises a simple question:
If the FoF ultimately invests in the ETF, why not buy the ETF directly?
Would the ETF investor earn more by skipping the extra FoF layer? Or would the difference be small enough for the FoF’s convenience to be worth it?
We tested this using actual data.
The Experiment
We compared two gold FoF and gold ETF pairs.We chose FoF and ETF pairs from the same fund house so the gold exposure stayed almost identical. The only real difference was the route: mutual fund SIP versus direct ETF purchase on the exchange.
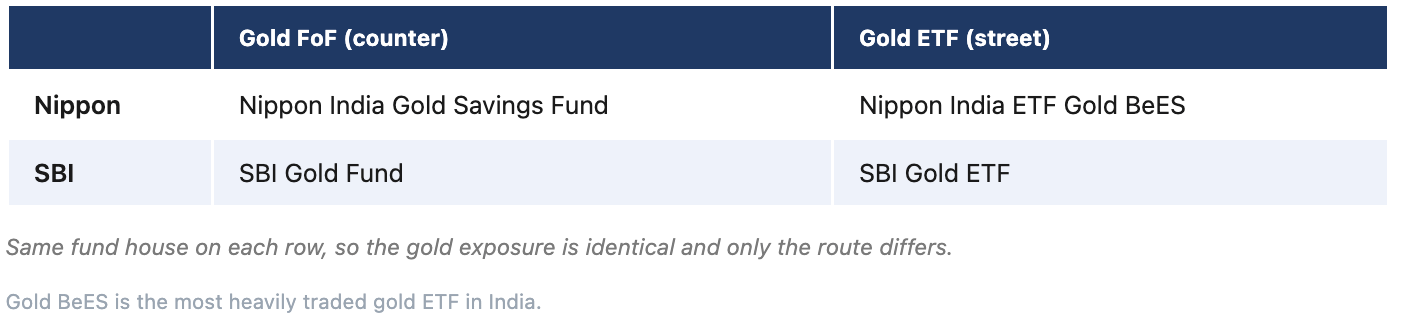
The study period was from 1 January 2016 to 3 July 2026. We used 2,536 common trading days where all required data was available.
Each investor put in Rs 10,000 every month on the first trading day of the month. This gave us 127 monthly investments, or a total investment of Rs 12.7 lakh.
For each fund house, we tracked three routes.
First, the Gold FoF route. Investor A invested Rs 10,000 every month in the Gold FoF at that day’s NAV. Since mutual funds allow fractional units, the full amount was invested each month.
Second, the Gold ETF route. Investor B used Rs 10,000 every month to buy the Gold ETF at its actual NSE closing price on the SIP date. Since ETFs trade like shares, only whole units could be bought. Any leftover cash was carried forward to the next month.
Third, we added an ETF-at-NAV reference line. This was not a real investor route. Here, we assumed Rs 10,000 was invested every month at the ETF’s NAV, with fractional units allowed.
This third line was added to separate the product’s NAV movement from market-price effects. ETFs have both an NAV and a market price. Sometimes they trade above NAV, called a premium. Sometimes they trade below NAV, called a discount. The ETF-at-NAV line helps us see whether the difference came from the FoF structure or from the ETF being bought in the market at a premium or discount.
We also checked whether these FoFs were actually investing in their own Gold ETFs. And yes, they were.
Nippon India Gold Savings Fund had about 99.88% of its money in its own Gold ETF, while SBI Gold Fund had about 99.93%.
So, in practical terms, both FoFs were almost entirely invested in their own Gold ETFs, with only a very small amount kept as cash or other assets.
All FoF and ETF NAVs were taken from ACE MF. ETF market prices were actual NSE closing prices.
Study 1
First, let us look at the Nippon pair.
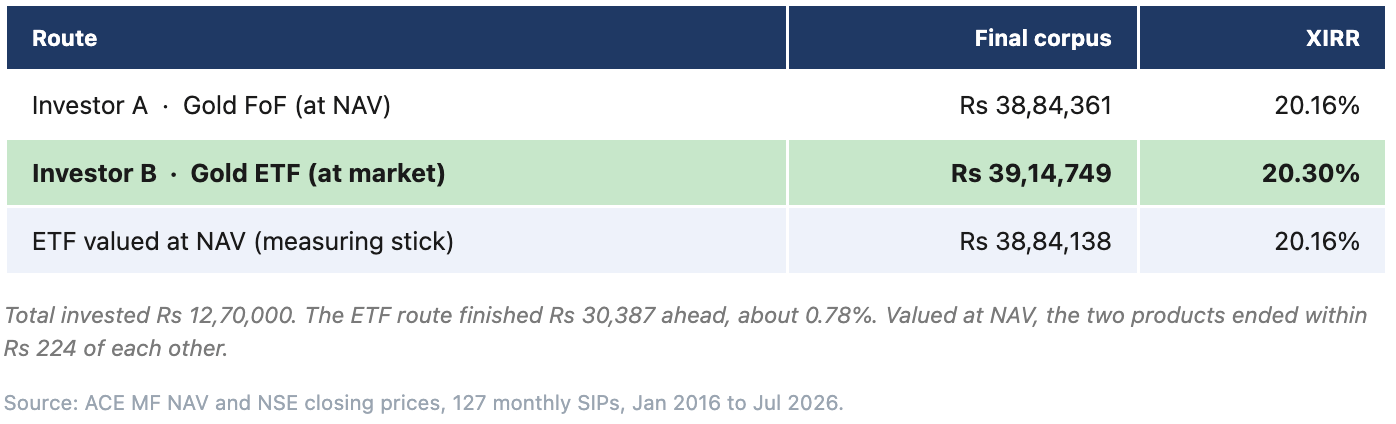
The ETF route finished ahead by Rs 30,387. At first, that may sound like a meaningful difference. But when you look at the final corpus of nearly Rs 39 lakh, the gap becomes quite small. Over more than ten years, this difference works out to only about 0.78%.
Now, if we look at the ETF NAV line, the picture becomes clearer. If the ETF had been valued strictly at its NAV, it would have finished at Rs 38,84,138. The Gold FoF, on the other hand, finished at Rs 38,84,361. The difference between the two is just Rs 224, which is almost negligible.
This tells us something important. In the Nippon case, the extra layer in the FoF structure did not really reduce returns. The FoF and the ETF NAV moved almost in line with each other.
So then, why did the actual ETF investor still end up slightly ahead?
The reason lies in the market price. The ETF was often available in the market at a price lower than its NAV, which gave the ETF investor a small advantage over time.
Gold BeES traded below NAV on 1,767 out of 2,536 trading days.
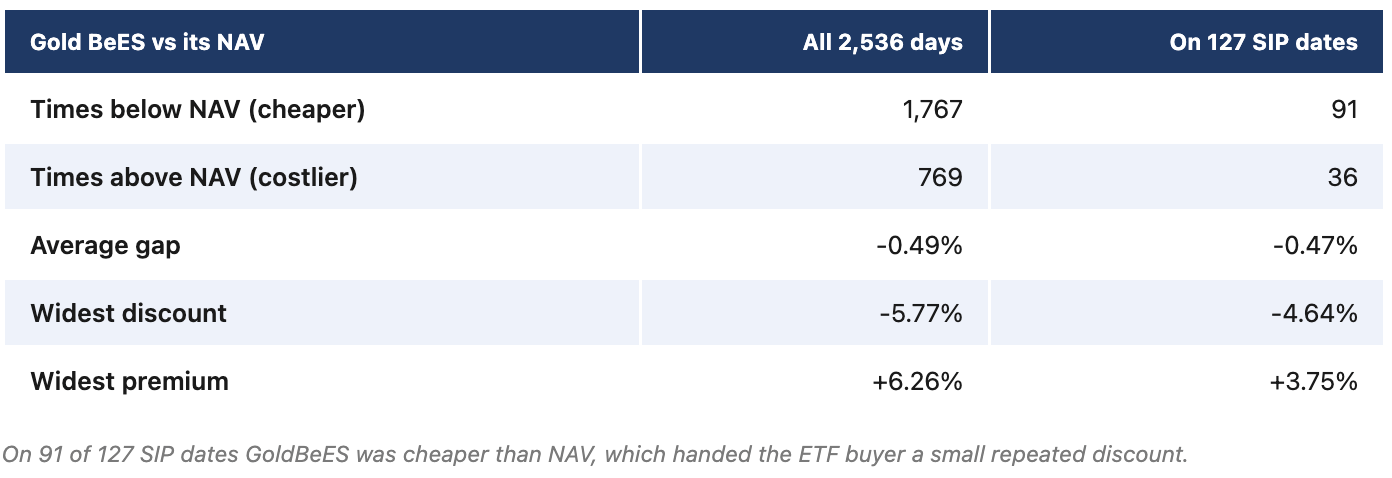
More importantly for our SIP investor, it traded below NAV on 91 out of 127 SIP dates.
This means the ETF investor was often buying the ETF slightly cheaper than its actual underlying value.
Across the SIP dates, Investor B received units worth about Rs 6,159 more at NAV than what she actually paid at the market price.
That small repeated discount helped the ETF route finish ahead.
So in the Nippon case, the ETF did not win because the FoF was bad.
The ETF won because the market often allowed the investor to buy it slightly below NAV.
Study 2
Now let us look at the SBI pair.Here also, the ETF route finished ahead, but only by a very small margin.
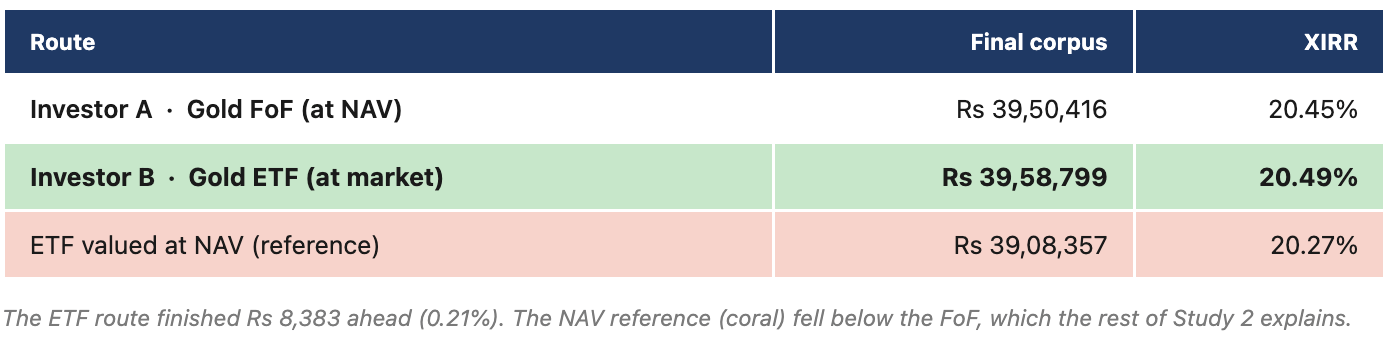
The ETF investor ended with Rs 39,58,799, while the FoF investor ended with Rs 39,50,416. That is a gap of just Rs 8,383, or about 0.21%.
So at first glance, both routes look almost the same.
But the ETF NAV line shows something interesting. If the ETF had been valued at NAV, it would have finished at Rs 39,08,357, which is lower than the FoF’s Rs 39,50,416.
At first, this looks a bit confusing. If the FoF is simply investing in the ETF, then why is the FoF NAV higher than the ETF NAV?
To understand this, we need to look at one more comparison.
From the first date to the last date, the growth looked like this:
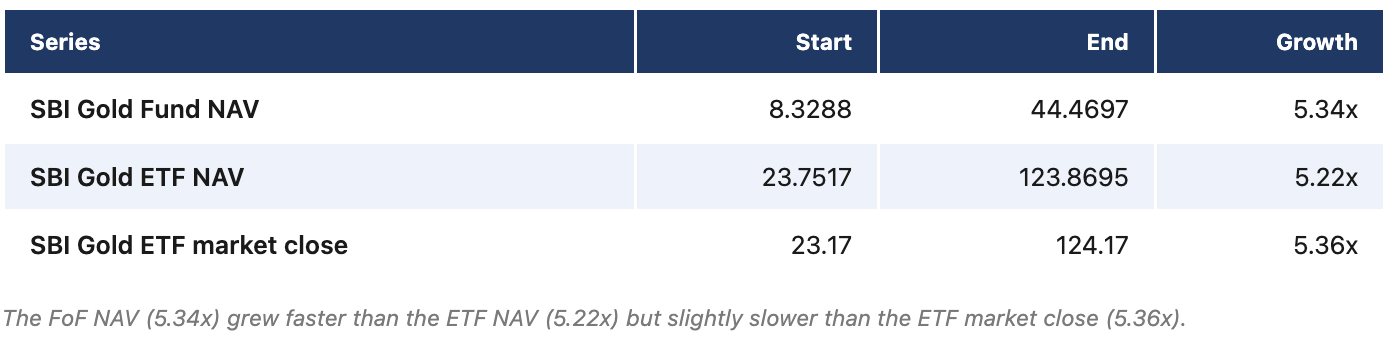
So yes, SBI Gold Fund NAV grew faster than SBI Gold ETF NAV.
But it did not grow faster than the ETF’s market price. That is the key point.
The FoF only looked better when compared with the ETF NAV reference. Compared with the actual ETF market-price path, it was slightly behind, which is what we would expect from an extra FoF layer.
So why did the FoF beat the ETF NAV reference?
The answer likely lies in how the FoF itself is valued.
A Gold FoF holds ETF units. Mutual fund NAVs are usually calculated using the closing market value of the securities they hold. For ETFs, this typically means using the closing market price on the exchange.
So the FoF NAV may not track the ETF’s own NAV exactly. Instead, it may track the ETF’s market closing price more closely.
And the SBI data supports this clearly.
When we compare daily returns, the SBI Gold Fund NAV tracks the ETF’s market close much more closely than it tracks the ETF NAV.
A 0.9995 correlation with the ETF market close is extremely high. In simple terms, the FoF NAV was moving almost exactly like the ETF’s market price, not like its NAV.
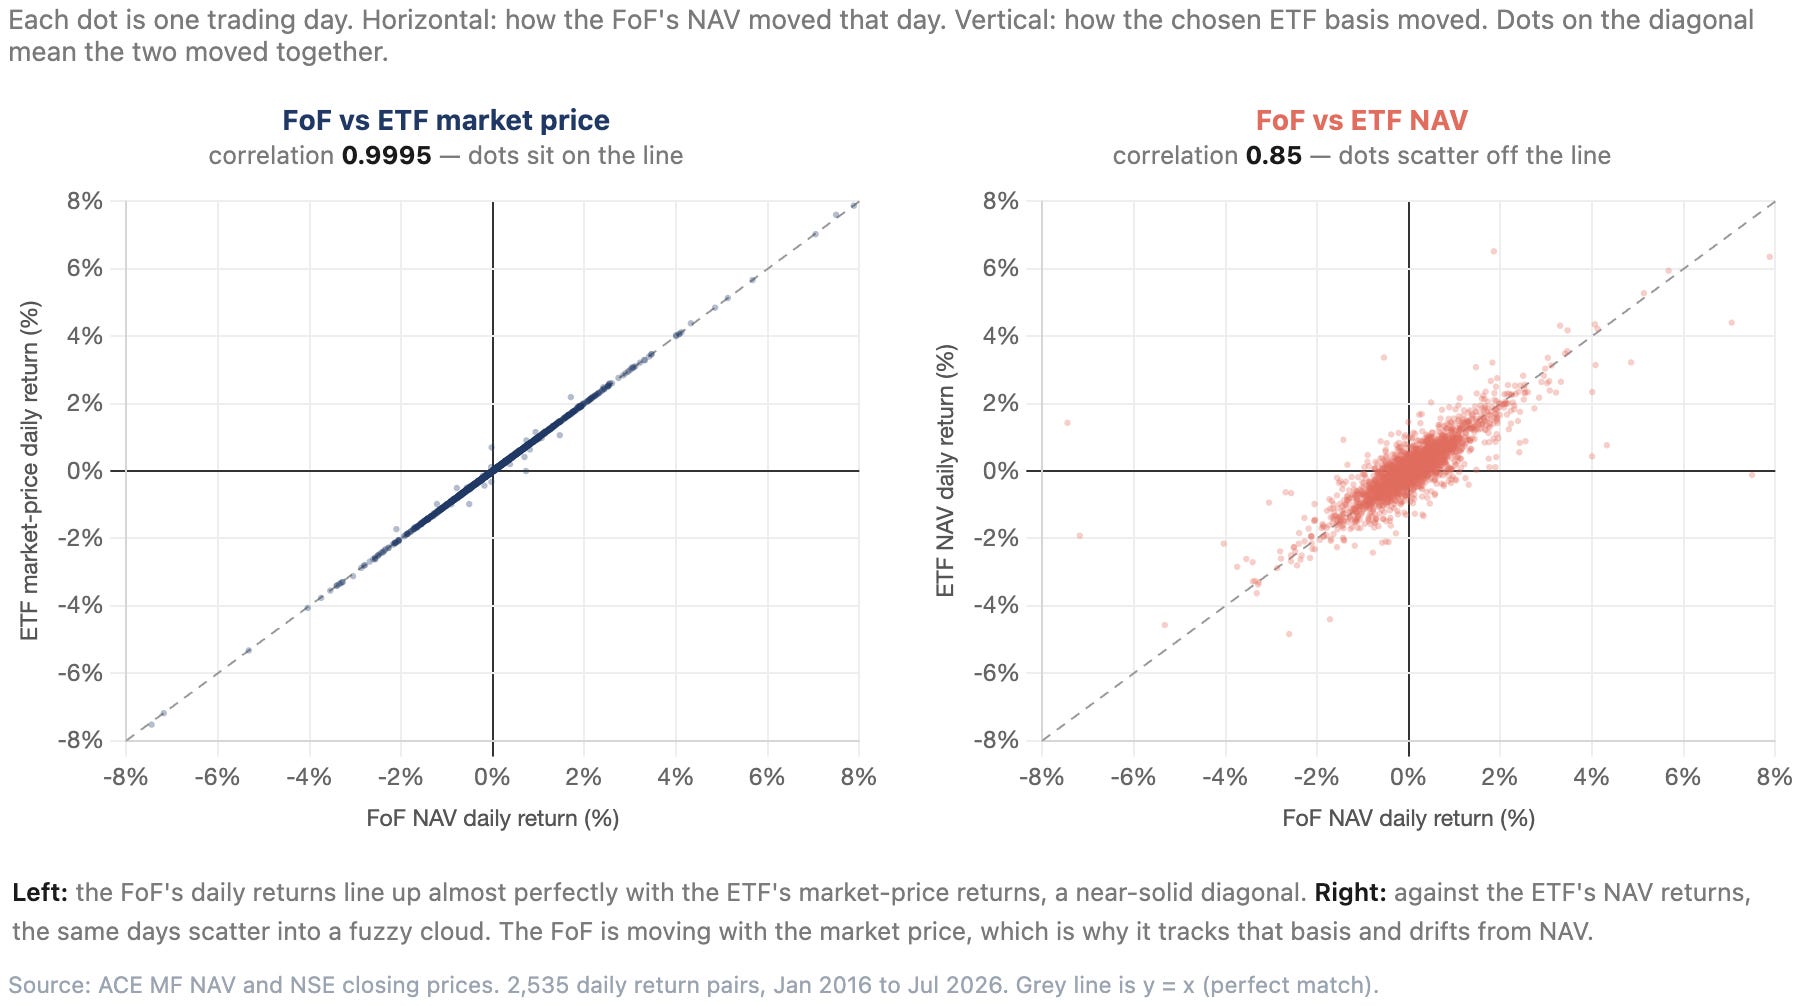

This changes how we should read the result. Comparing FoF NAV with ETF NAV does not cleanly show the cost of the FoF layer. The ETF NAV shows the value of gold inside the ETF, while the FoF NAV appears to follow the ETF’s market price, along with small cash holdings.
This is why the final order looks like this:
ETF market price > FoF NAV > ETF NAV reference
In simple terms, both real routes were closer to the ETF’s market-price path than to the ETF NAV path. The ETF NAV line is useful as a benchmark, but it was not the actual path followed by the FoF investor.
Now let us look at the ETF’s market-price behaviour.
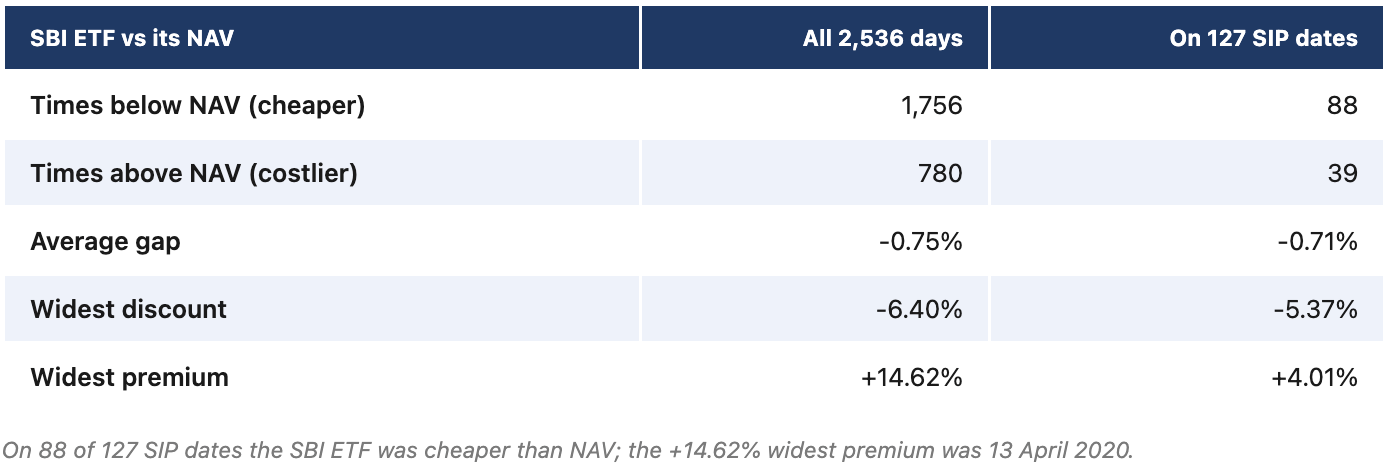
Across the SIP dates, Investor B picked up units worth about Rs 9,385 more at NAV than what she paid in the market.
That discounted buying was enough to cover the gap between the FoF NAV and ETF NAV, and still pushed the ETF route slightly ahead.
So again, the ETF’s small edge came from market pricing.
Why the ETF price moved away from NAV
The main reason behind the ETF’s small advantage was simple: an ETF has two prices.
One is the NAV. This is the value of the gold held by the ETF.
The other is the market price. This is the price at which people actually buy and sell the ETF on the stock exchange.
These two prices do not always match.
If the market price is below NAV, the ETF buyer gets gold exposure slightly cheaper than its actual value. If the market price is above NAV, the buyer pays extra.
In this study, investors got the cheaper deal more often.
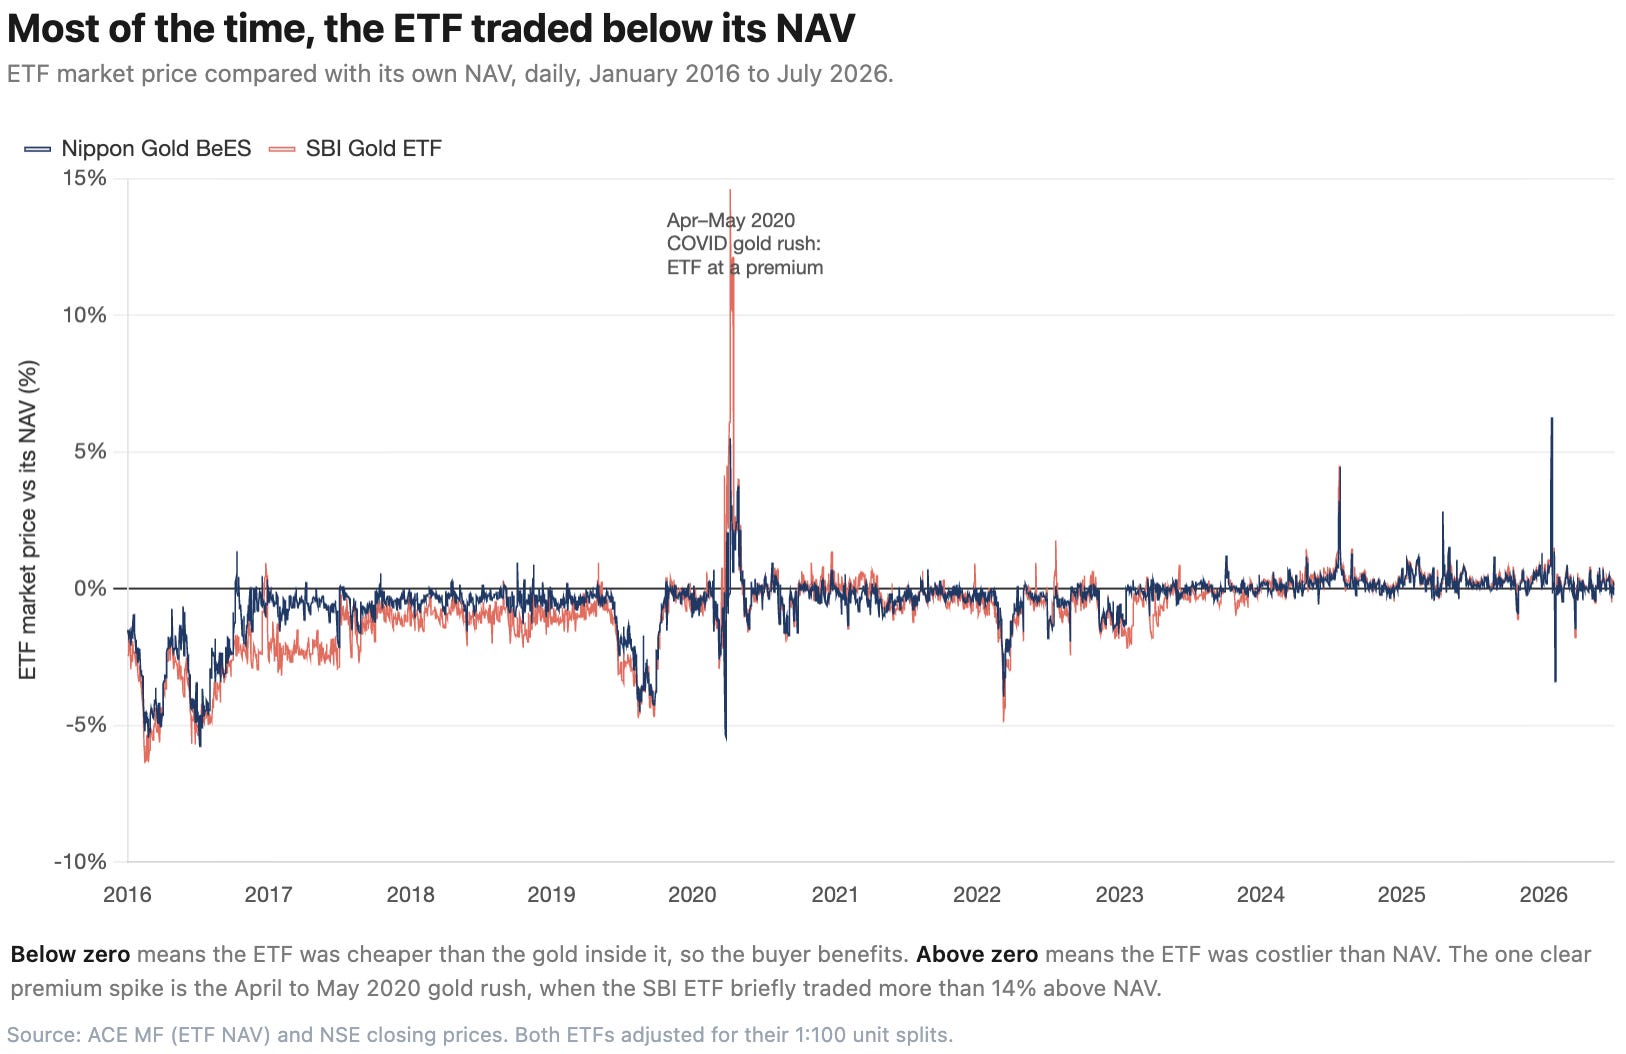
On roughly seven out of every ten SIP dates, both ETFs were trading below NAV. That means the direct ETF investor was usually buying gold exposure at a small discount.
The early years made this even more useful. On 1 July 2016, Gold BeES traded 4.64% below NAV, while the SBI ETF traded 5.37% below NAV. So for the same Rs 10,000, the ETF investor got slightly more gold value. And when gold prices rose later, those extra units also benefited.
But this discount was not permanent.
During Covid, the situation flipped. Investors rushed towards gold ETFs, demand jumped, and ETF prices moved above NAV.
On 13 April 2020, the SBI ETF traded 14.62% above NAV. Our SIP investor did not buy on that exact day, but the pressure was still visible. On 4 May 2020, the investor paid around 3.75% above NAV in Nippon and 4.01% above NAV in SBI.
So the same price gap that helped the ETF investor for most of the period became a disadvantage when demand was very high.
The two ETFs also behaved differently because of liquidity.
Gold BeES was more actively traded, so its price stayed closer to NAV. During the study period, it moved from about 5.8% below NAV to 6.3% above NAV.
SBI ETF traded less, so its price moved around more. It swung from about 6.4% below NAV to as high as 14.6% above NAV.
That is the key takeaway. Liquidity makes a big difference.
A heavily traded ETF usually stays closer to NAV. A less traded ETF can move further away. Sometimes that gives you a bigger discount. But sometimes, it also means paying a much bigger premium.
Why does the FoF still exist?
If the ETF route finished slightly ahead, why would anyone choose the FoF?
The answer is convenience. A Gold FoF works like a regular mutual fund SIP. There is no need to place exchange orders, check premiums or discounts, think about liquidity, or worry about whole-unit buying. The full SIP amount gets invested and fractional units are allotted.
The ETF route offers more control, but it also comes with execution issues. The ETF may be bought below NAV, which helps the investor, or above NAV, which hurts. There can also be bid-ask spreads, brokerage, demat charges, and exchange-related costs, which were not included in this study.
In this study, the whole-unit issue did not matter much. By the end, the Nippon ETF route had only about Rs 102 left as uninvested cash, and the SBI ETF route had only about Rs 11 left. So leftover cash was not a major reason for the difference.
But the larger point remains.
A Gold ETF and a Gold FoF may give exposure to the same gold, but the experience of buying them is very different.
The real takeaway
Over ten and a half years, both routes worked very well. An investment of Rs 12.7 lakh grew to roughly Rs 39 lakh in both cases, which shows that gold itself did most of the heavy lifting.
The ETF route finished ahead in both comparisons, but only slightly. In Nippon, the edge was Rs 30,387, or about 0.78%. In SBI, it was Rs 8,383, or about 0.21%.
So the study does not show that FoFs failed. It shows that when the underlying gold exposure is almost the same, the final outcome can be very close.
The difference was not really about gold.
It was about the route used to access gold. The FoF route offered simplicity through a regular mutual fund SIP. The ETF route was slightly more efficient in this period, but it required buying on the exchange, where prices can move above or below NAV.
During this decade, the ETF route got a small advantage because the ETFs often traded below NAV. This allowed direct ETF investors to buy at a slight discount. But this was not guaranteed. During periods like the Covid shock in 2020, ETFs traded above NAV, making the ETF route temporarily more expensive.
For investors who want a simple monthly gold SIP, the FoF route works well. For investors who are comfortable with demat accounts, liquidity, and market-price movements, the ETF route was slightly more efficient in this study period.
In the end, the difference was not really about gold. It was about the path used to access the same gold exposure.
Note
Gold FoF allows fractional units, so the full SIP amount gets invested
ETF route uses only whole units; leftover cash is carried forward
ETF NAV line assumes buying at NAV with fractional units; used only as a reference, not a real route
ETF prices used are closing prices; actual buy price may differ during the day
Brokerage, STT, demat charges, exit load, tax, and platform costs are not included
SBI FoF NAV grew faster than its ETF NAV; exact reason unclear from NAV data alone
Four incorrect ETF prices from Yahoo were corrected using NSE data (split-adjustment errors)
Both ETFs had 1-for-100 splits (Nippon: Dec 2019, SBI: Jan 2022); adjustments made
Real market events like 2020 premiums and 2016 discounts are included
Study covers only two fund houses and two ETFs; less liquid ETFs may behave differently
Physical gold, jewellery costs, GST, and making charges are not part of this study
Insightful and very well written.
Thanks for sharing a detailed comparison.