

January 2022.
Netflix was going through a difficult period.
Just 2 years before, during the pandemic in 2020, when millions of people were forced to stay home, Netflix had added around 37 million subscribers.
The company had seen tremendous growth, and investors were confident about its future.
But things were beginning to change.
In 2021, Netflix added just 18 million subscribers, almost half the number it had added the previous year.
And the outlook for 2022 wasn’t encouraging either.
On 20 January 2022, Netflix announced that it expected to add only 2.5 million subscribers in the first three months of 2022.
Investors were beginning to worry that Netflix’s best years of growth might be behind it. Competition from streaming platforms such as Disney+ was increasing, and Netflix was finding it harder to attract new customers.
These concerns were reflected in its share price.
After reaching its highest closing price of $691.69 on 17 November 2021, Netflix shares fell 26.5% to $508.25 by 20 January 2022.
The next day, Netflix shares crashed another 21.8% to $397.50.
That was a total fall of 42.5% in just over 2 months.
But while investors were selling, one billionaire saw an opportunity.
Bill Ackman.
Ackman runs a major investment firm, Pershing Square. He believed investors had overreacted to Netflix’s slowing growth.
And now, the shares were available at a much lower price than just a few months earlier.
So, beginning on 21 January, his investment firm started buying Netflix shares.
By 26 January, Pershing Square had bought shares worth around $1.1 billion.
It was now one of Netflix’s 20 largest shareholders. Ackman believed he had found a good business at an attractive price.
But just three months later, things got worse.
In April 2022, Netflix announced that instead of adding the expected 2.5 million subscribers, it had actually lost 200,000. It also expected to lose another 2 million in the following quarter.
The next day, its shares crashed another 35%.
Ackman decided to sell his entire investment, taking a loss of more than $400 million.
But here’s the interesting part.
Netflix eventually recovered. The company introduced ad-supported plans and restricted password sharing, helping its subscriber growth improve.
By August 2024, its shares had surpassed their previous highest point.
But Ackman had already sold.
He had bought after a fall of more than 40%, believing it was a good opportunity. Yet the stock fell much further before eventually recovering.
Now, investors often have a similar belief about entire sectors.
If a sector has fallen 30% or 40% from its highest point, it might seem like a bargain. After all, it has already fallen so much. Surely, a recovery must be coming.
The same thinking applies when a sector has underperformed the broader market for several years. Investors might believe it has struggled for long enough and that its turn to outperform is next.
And if they invest before that comeback, they could make substantial returns.
But does a sector really become a better investment simply because it has performed badly? Or could it continue struggling for years?
That’s what we decided to test.
The experiment
We studied nine Indian sector indices: Auto, Bank, FMCG, IT, Media, Metal, Pharma, PSU Bank and Realty.
We used data from 2005 to 23 October 2026 and compared their performance with the Nifty 50.
For this, we used Total Returns Indices, or TRI. These include dividends along with changes in share prices, allowing us to compare sectors and the Nifty on the same basis.
We tested two different situations.
First: What if an investor bought a sector after it had performed worse than the Nifty 50 for three consecutive calendar years?
Second: What if an investor bought a sector after it had fallen at least 30% from its previous highest point?
We looked at what happened over the following one, three and five years, with three years as our main comparison period.
But we also wanted to answer another important question.
Even if these investments made money, was buying after a poor period any better than buying at an ordinary time?
Because sectors can deliver positive returns even without first going through a bad period.
So, wherever possible, we compared the results with what investors would normally have experienced by investing in a sector without waiting for these signals.
Let’s start with the first situation.
Part 1
Three years of losing to the Nifty 50
First, we calculated each sector’s return for every calendar year and compared it with the Nifty 50 TRI.
“Losing” here does not mean the sector fell. It means it did worse than the Nifty 50. A sector can rise 10% and still lose if the Nifty 50 rose 15%.
Whenever a sector lost to the Nifty 50 three years in a row, we marked the end of that third year as a signal. If the streak continued into a fourth or fifth year, we did not count it again. Each streak counts once.
This happened 12 times between 2007 and 2024.
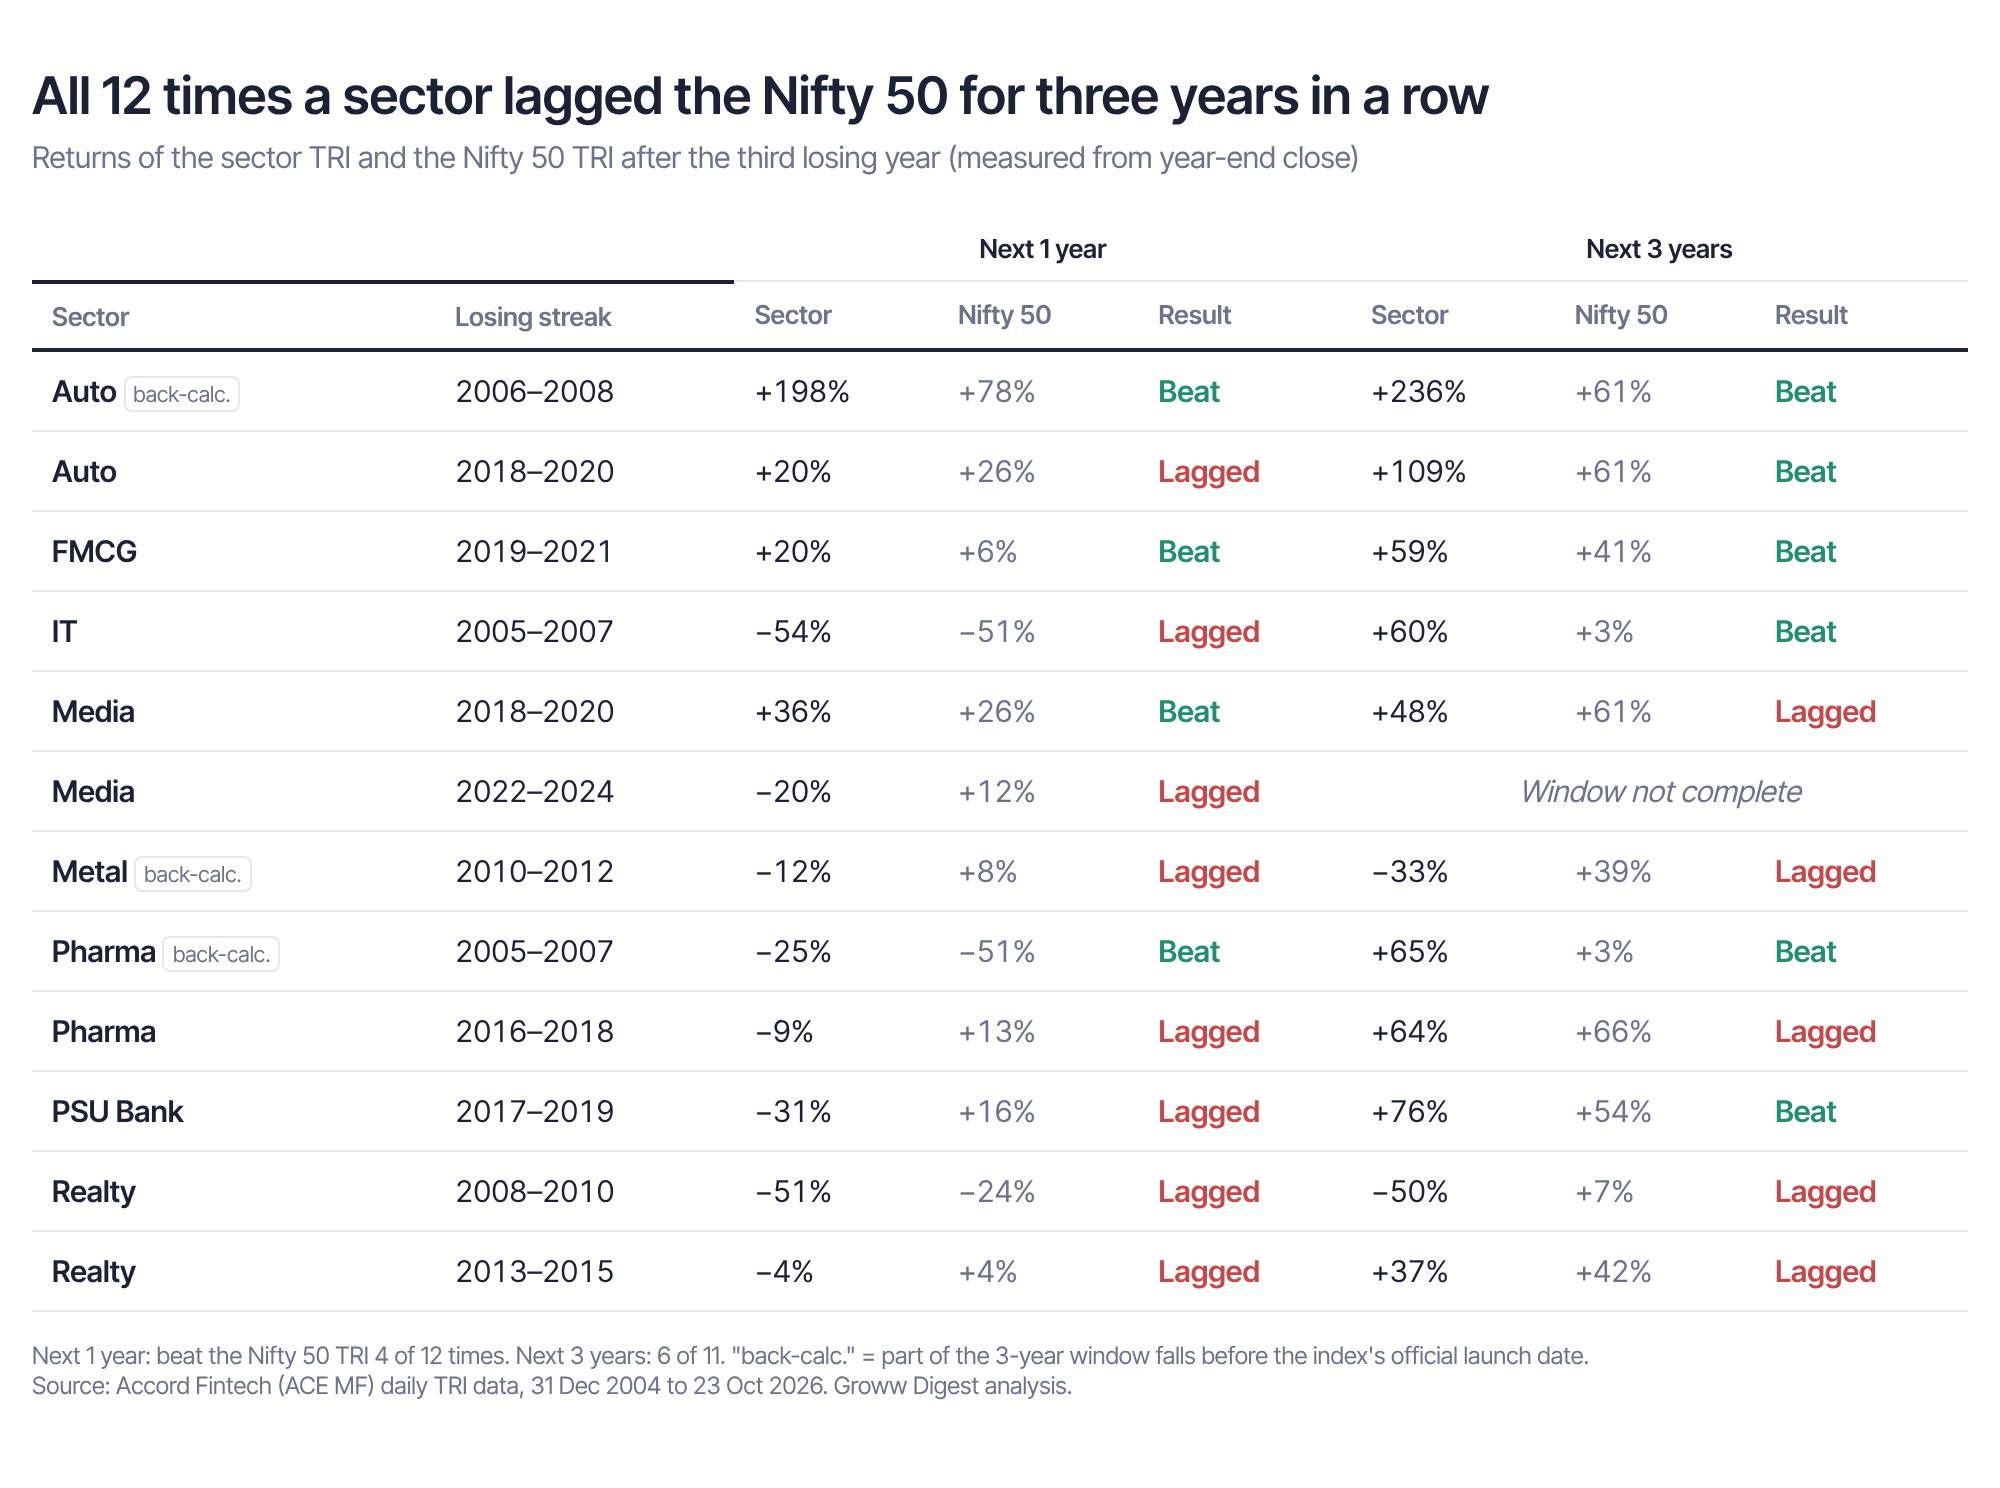
Every losing-streak signal, with what the sector and the Nifty 50 TRI did over the next 1 and 3 years.
In the next year, the loser usually kept losing
After three losing years, the sector beat the Nifty 50 in the following year only 4 of 12 times. The other 8 times, it lost again.
Now compare that with the base rate. Across all 183 sector-years in our data, a sector beat the Nifty 50 in 91 of 183 years. That is about one in two.
So a three-year losing streak did not signal a comeback the next year. If anything, the weak sector stayed weak more often than usual.
The returns tell the same story. The sector rose in the next year only 4 of 12 times. In an ordinary sector-year, sectors rose 126 of 183 times.
Over three years, it was a coin toss
Over the next three years, the losing sector beat the Nifty 50 6 out of 11 times. (One signal, Media at the end of 2024, does not have three full years yet.)
The base rate for any three-year window was 84 of 165. That is also roughly one in two.
So the losing streak gave no real edge over three years either. Sometimes the comeback came. Auto after 2018–2020 more than doubled in the next three years. Sometimes it did not. Metal after 2010–2012 fell 33% over the next three years while the Nifty 50 rose 39%.
The winners kept winning
We also tested the mirror image. What happens after a sector beats the Nifty 50 three years in a row?
This happened 10 times. In the following year, the winning sector beat the Nifty 50 again 8 of 10 times.
Over three years, it beat the Nifty 50 5 of 8 times.
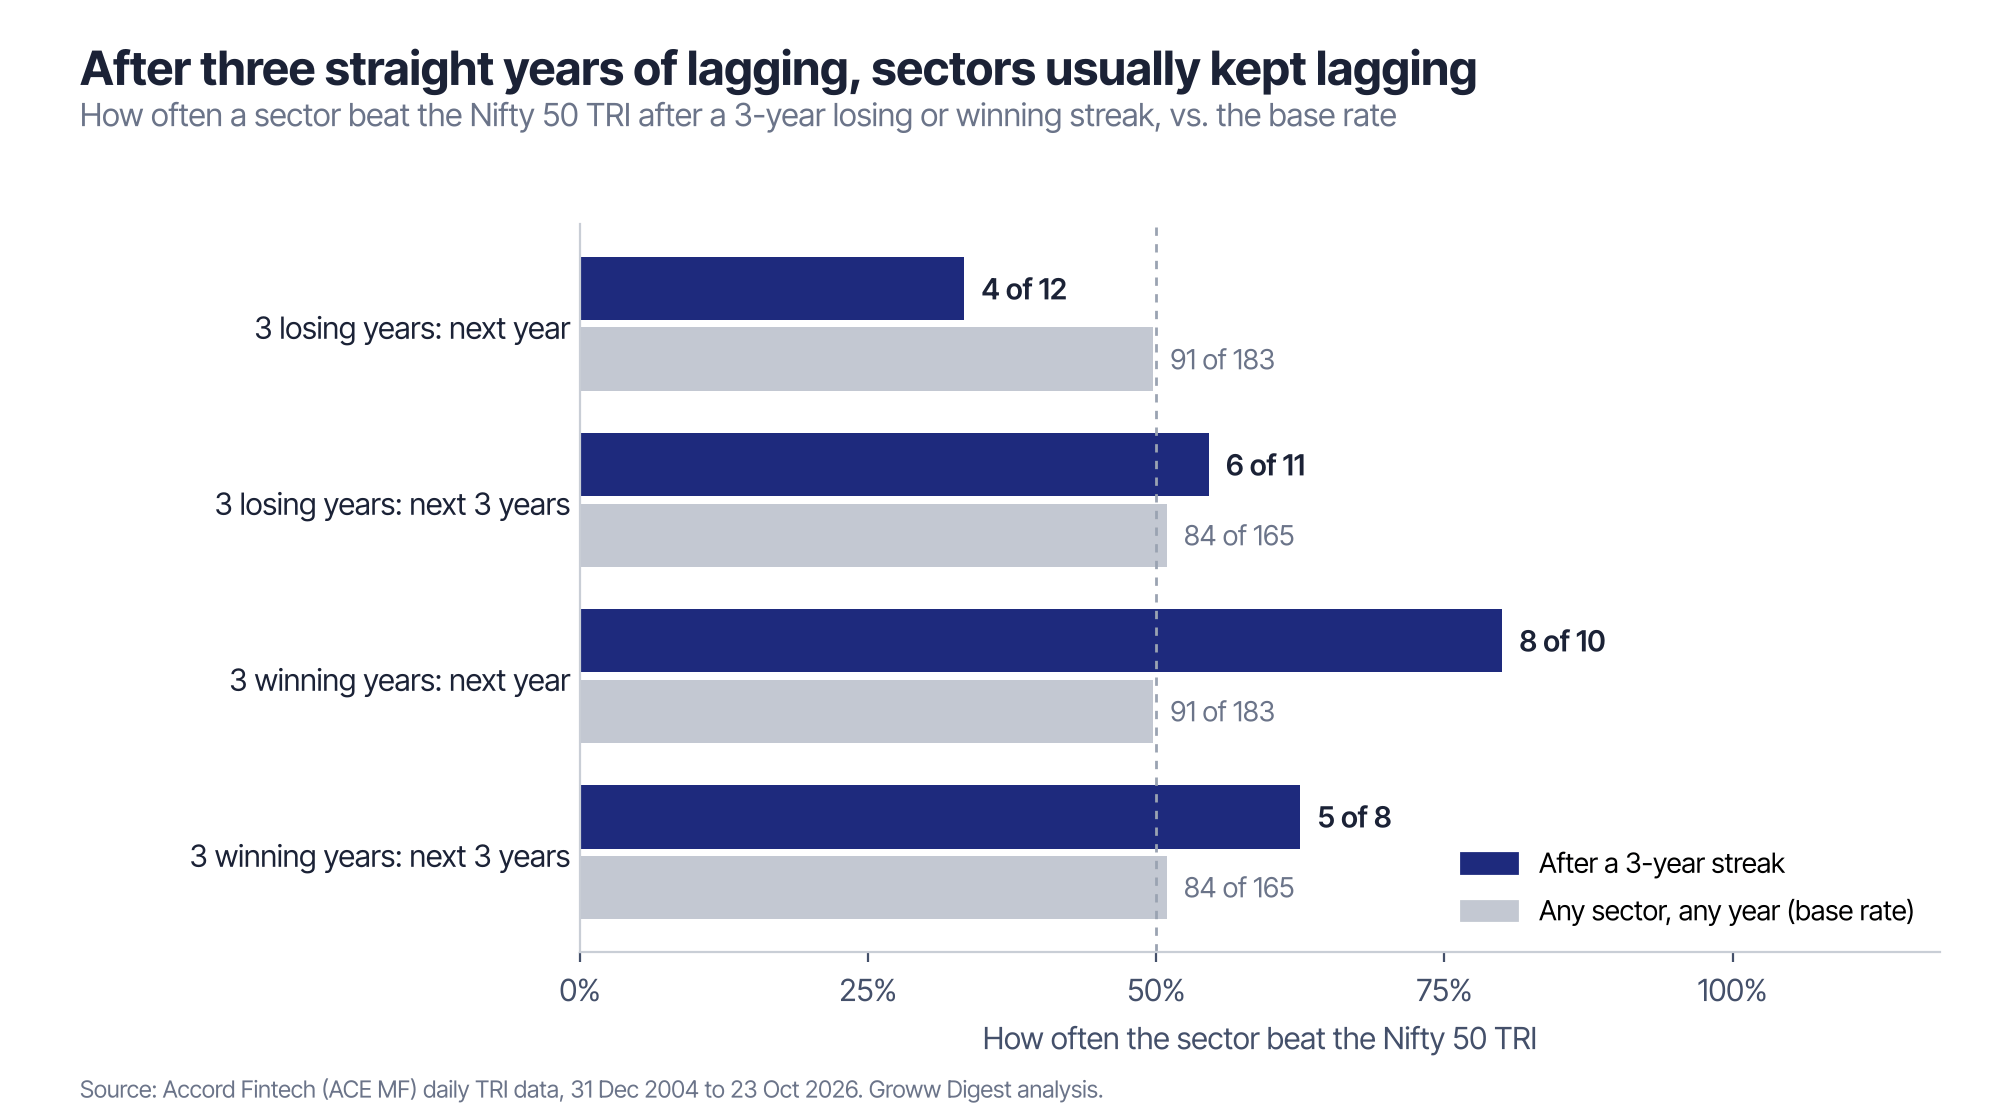
Losing streaks were followed by more losing in the next year. Winning streaks were followed by more winning. Over three years, both were close to the base rate.
So in the short run, sectors that were struggling usually kept struggling for another year. Sectors that were doing well usually kept doing well.
The samples here are small. 12 and 10 events are not a law of nature. But the direction is clear. A long losing streak was not, by itself, a sign that the turn was near.
Part 2:
A 30% fall from the highest point
The second strategy was to buy a sector after it had fallen at least 30% from its previous highest point.
For this, we tracked each sector’s closing level every trading day and recorded the highest level it had reached until then. We then checked how far it had fallen from that level.
The first time a sector closed 30% or more below its highest point, we counted it as a buying opportunity.
We counted each fall only once. So, if a sector fell 30%, then 31% or 32%, it was still considered one fall. A new opportunity was counted only after the sector recovered to its previous highest point and then fell again.
We also repeated the same test for falls of 20% and 40%.
Across the nine sectors, we found 31 instances of a 30% fall between 2006 and 2026.
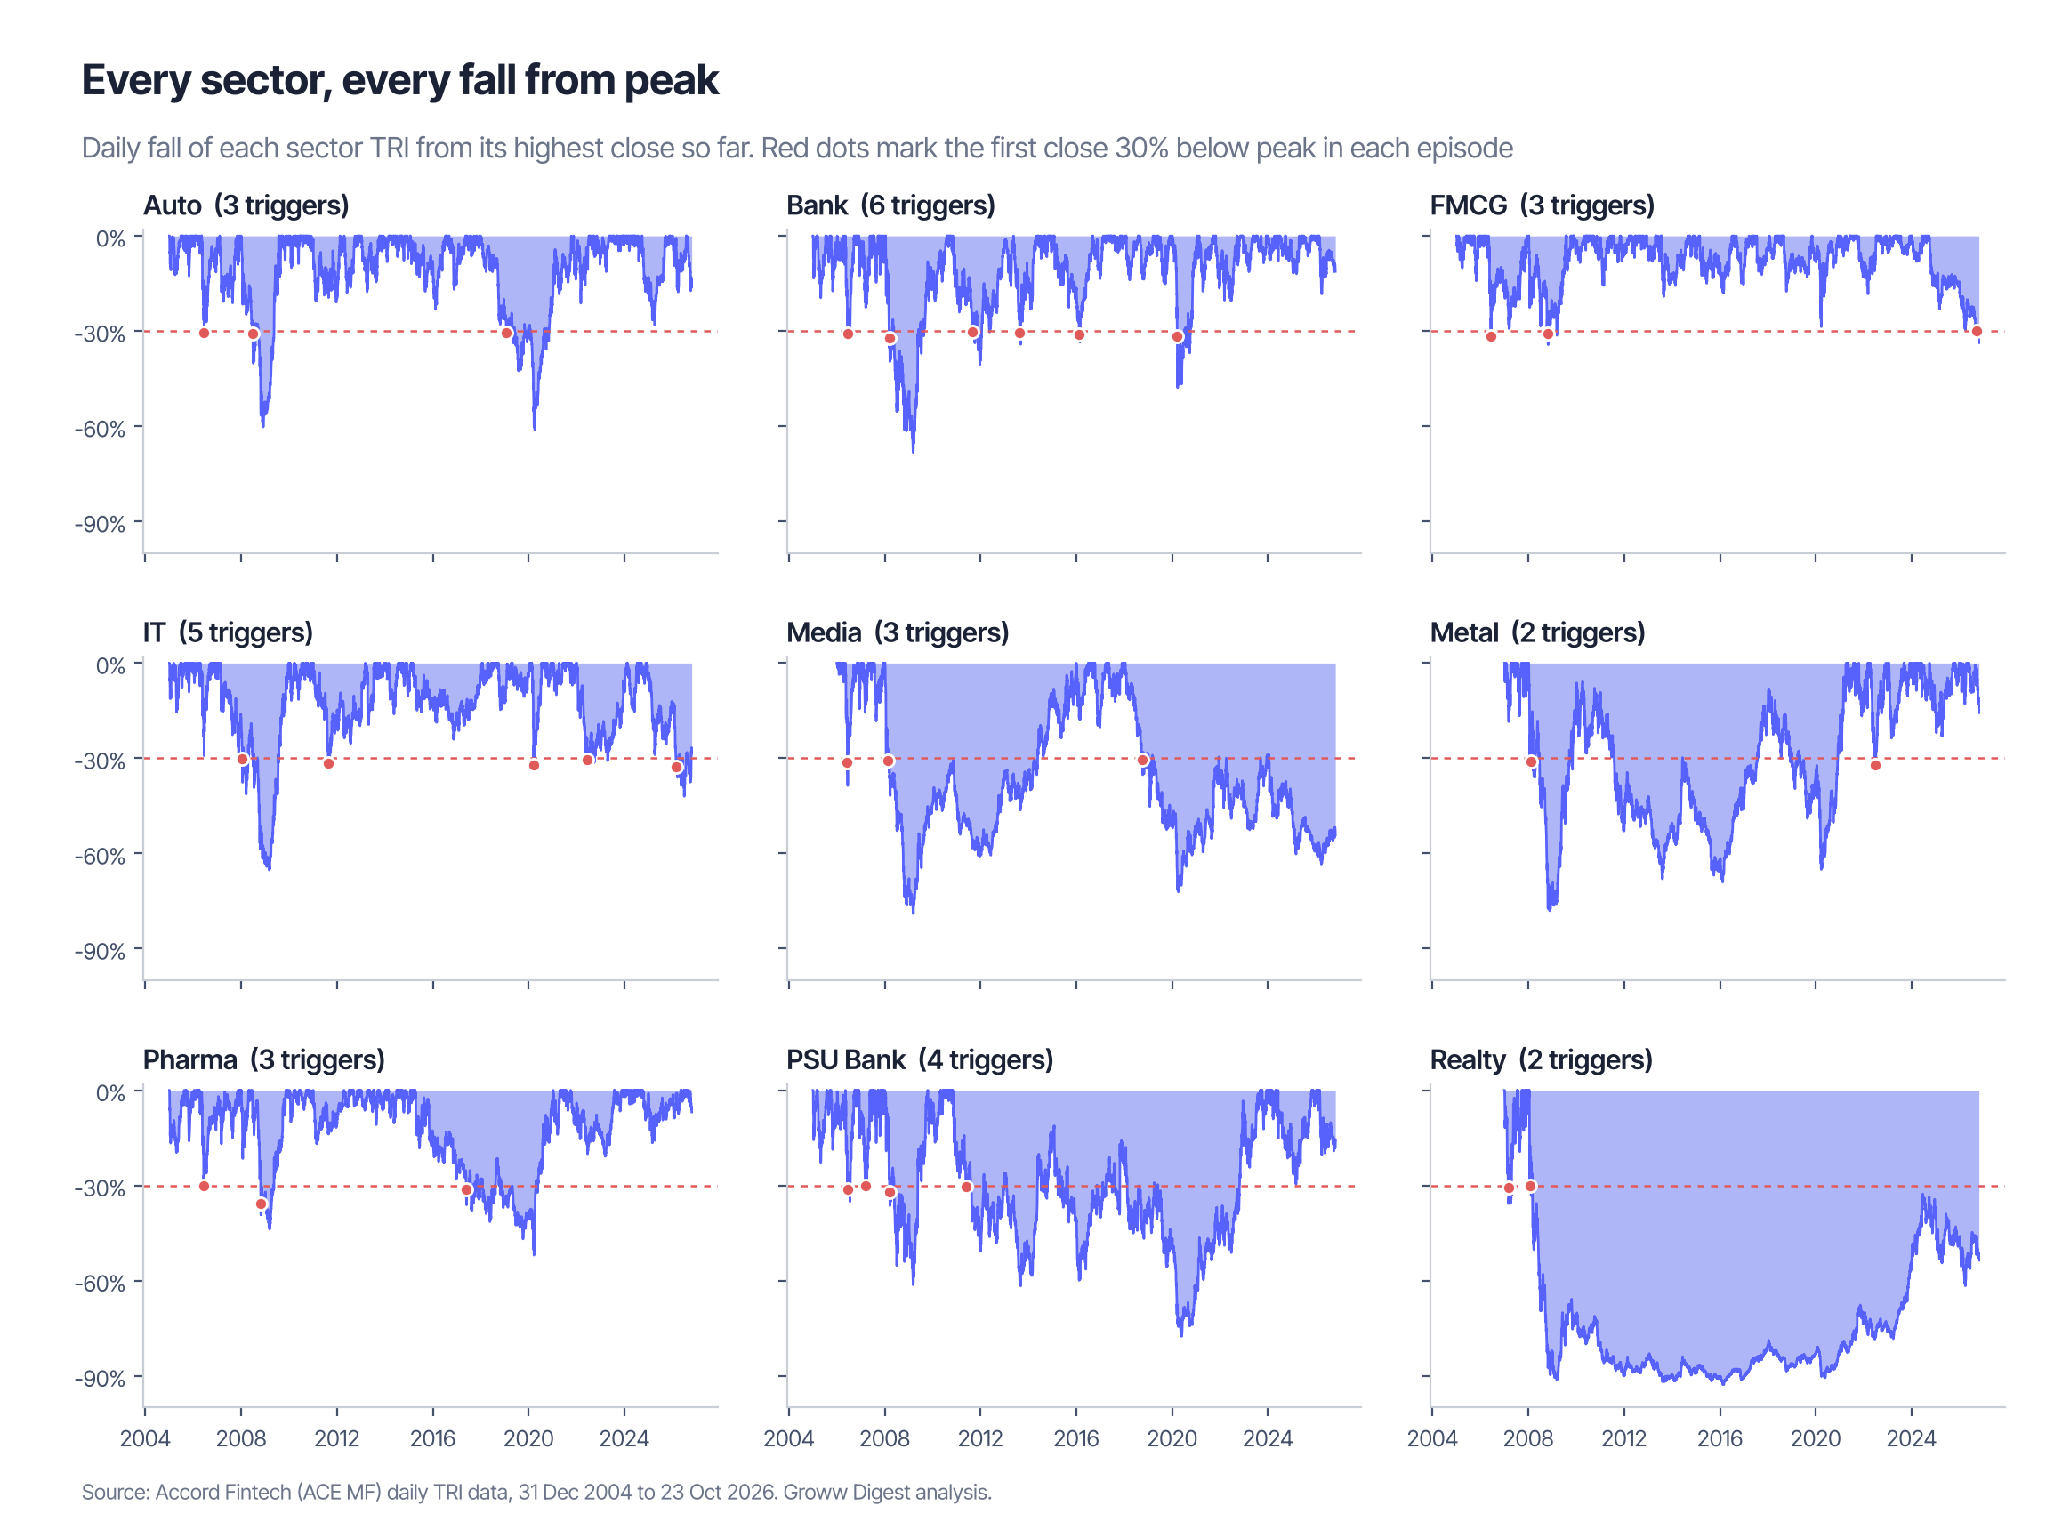
How far each sector TRI was below its peak on every trading day. Red dots are the 30% signals.
Buying after a 30% fall was close to buying on any day
Three years after buying a sector following a 30% fall, it beat the Nifty 50 in 16 out of 29 cases, or around 55%.
The other two instances, IT in February 2026 and FMCG in September 2026, were too recent to have completed three years.
Now, how does this compare with buying on an ordinary day?
To find out, we looked at every trading day across all nine sectors. We found 40,740 possible investments with a complete three-year holding period.
Of these, 21,047 beat the Nifty, or around 52%.
So, buying after a 30% fall had a success rate of 55%, compared with 52% on an ordinary day. The difference was quite small.
What if we looked at different holding periods?
After one year, the sector beat the Nifty in 14 out of 29 cases, compared with an ordinary-day success rate of 51%.
Over five years, the results were better. The sector beat the Nifty in 18 out of 27 cases, compared with 50% on an ordinary day.
However, this five-year result was influenced by a few unusual market periods, which we’ll explain in the Things to Note section.
But what if we ignored the Nifty and simply checked whether investors earned a positive return on their investment?
After three years, 25 out of 29 investments had made money, compared with 78% of ordinary-day investments.
Over five years, 21 out of 27 had made money, compared with 84% on an ordinary day.
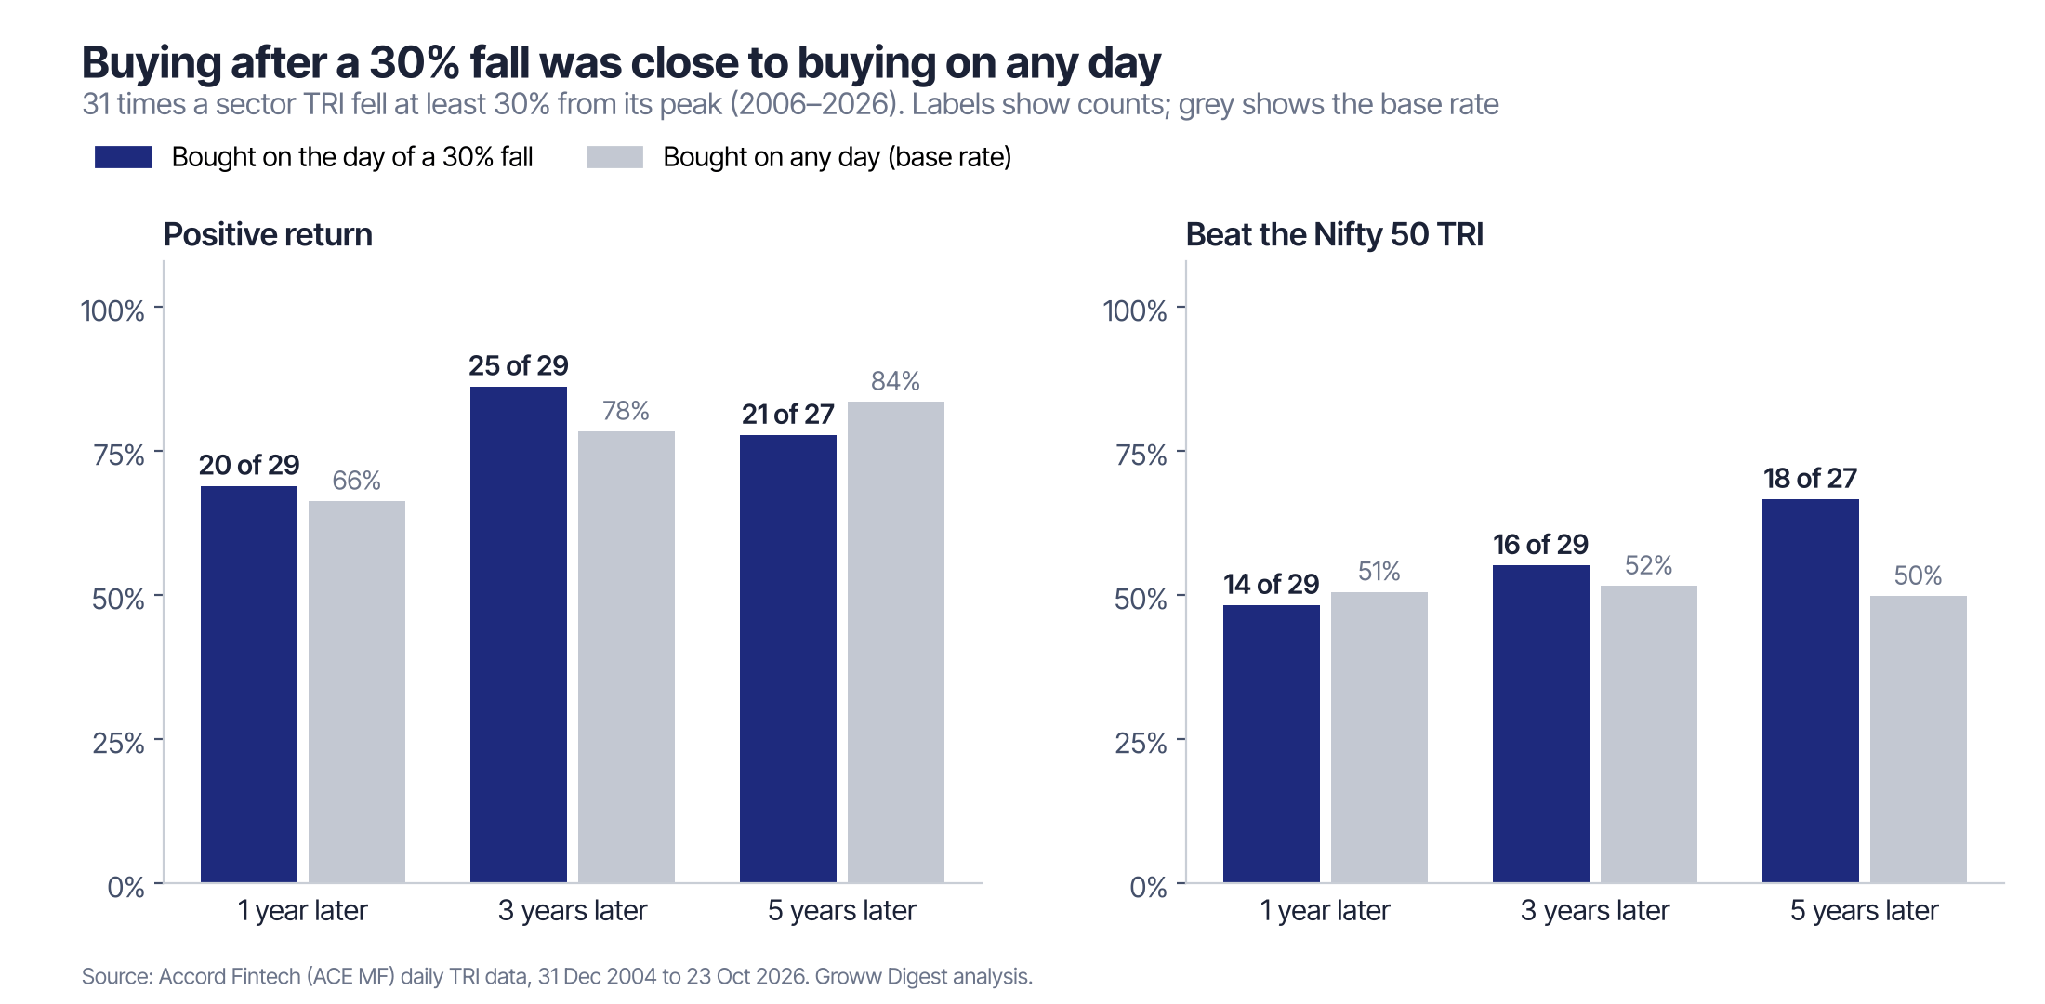
So, while buying after a 30% fall often resulted in positive returns, it didn’t consistently improve an investor’s chances of making money or beating the Nifty compared with investing on an ordinary day.
A deeper fall did not mean a better buy
If a 30% fall is a good entry, surely 40% is even better?
Not clearly.
Over three years, the 20% signals beat the Nifty 50 24 of 43 times, the 30% signals 16 of 29 times, and the 40% signals 9 of 14 times. Over five years, the order flipped. The 40% signals beat the Nifty 50 only 7 of 14 times.
There is no steady pattern where a bigger fall leads to a better result.
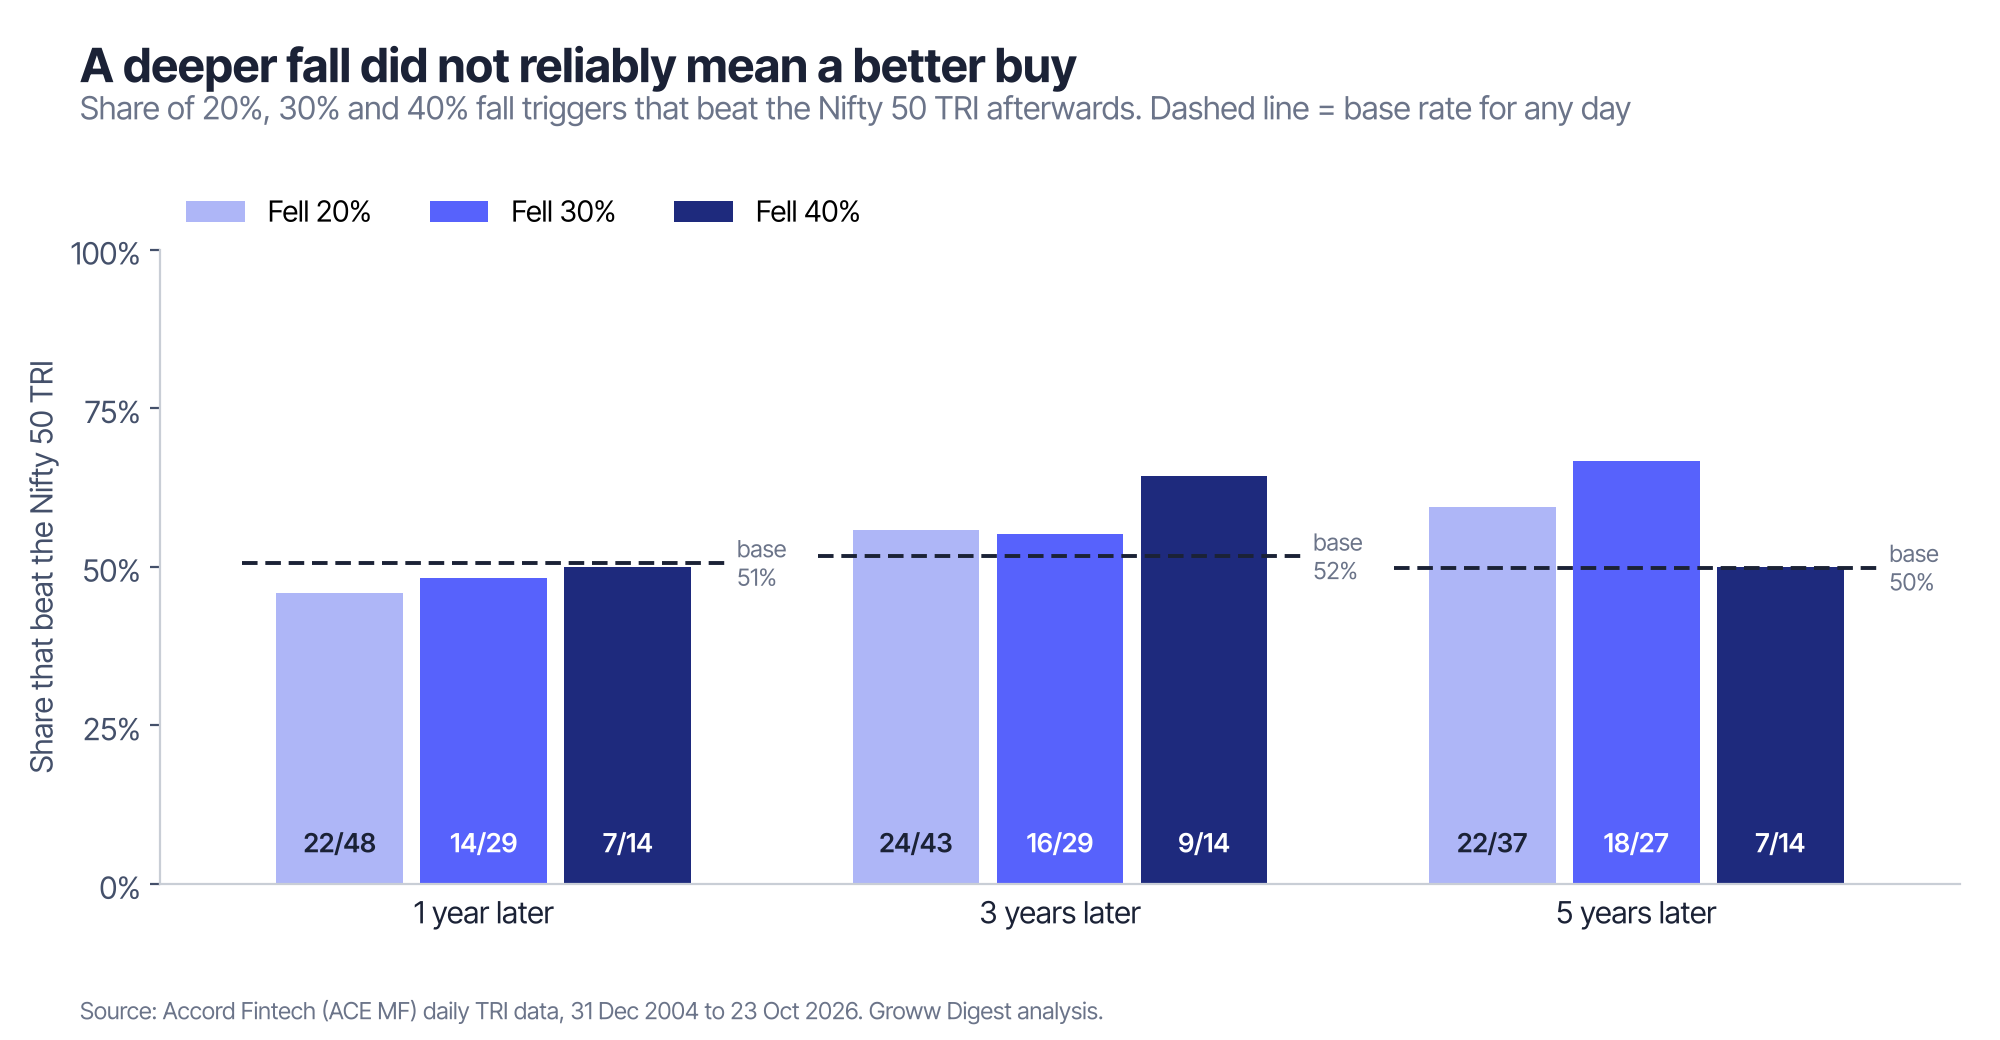
The share of 20%, 30% and 40% signals that beat the Nifty 50 TRI, compared with the base rate.
30% was often not the bottom
This is the part that hurts in real life.
After the 30% signal, 16 of 31 sectors fell at least another 10% before recovering. 12 of 31 fell at least another 20%.
Imagine buying Realty in January 2008 because it had fallen 30%. It then fell another 90% from that point.
Media in February 2008 fell another 70%. Metal in February 2008 fell another 68%. PSU Bank in May 2011 fell another 68%.
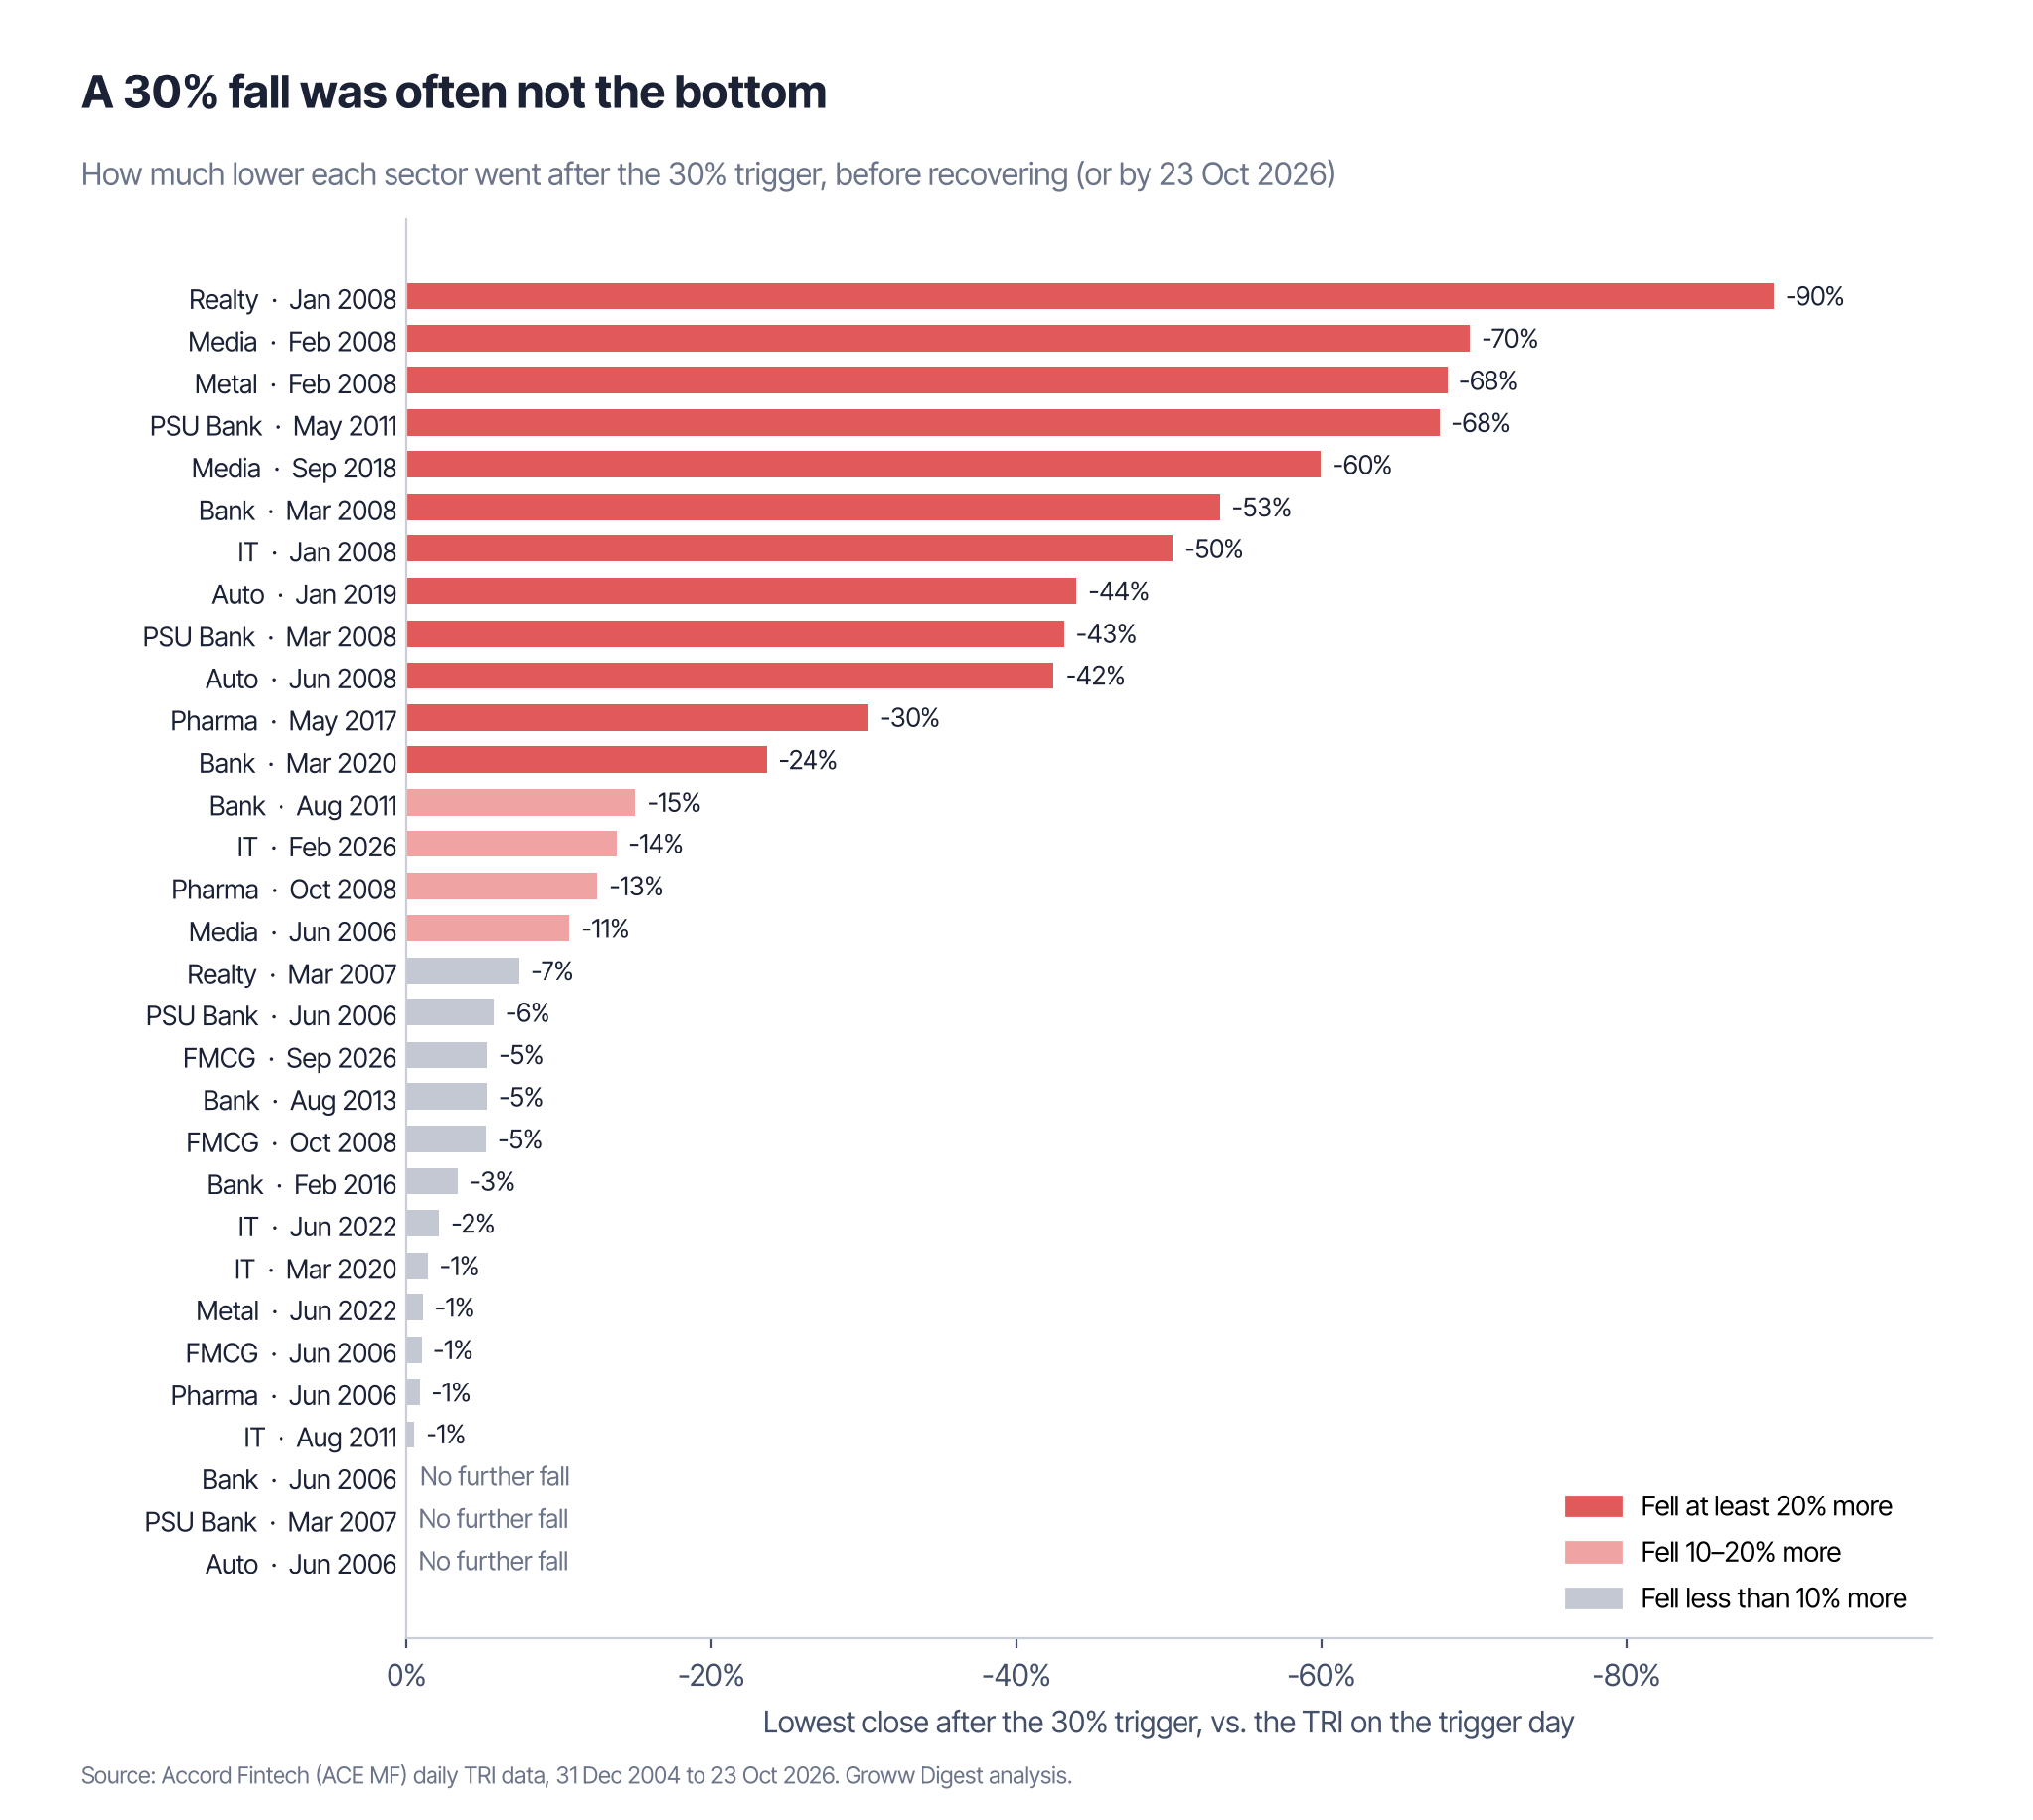
How much lower each sector went after the 30% signal.
Most falls recovered, but some took more than a decade
Out of 31 signals, 27 sectors got back to their old peak. 12 of them did it within a year.
But 4 took more than three years. Media took 7.9 years after its 2008 fall. PSU Bank took 12.3 years after 2011. Metal took 13.1 years after 2008.
And 5 were still below the old peak five years after the signal.
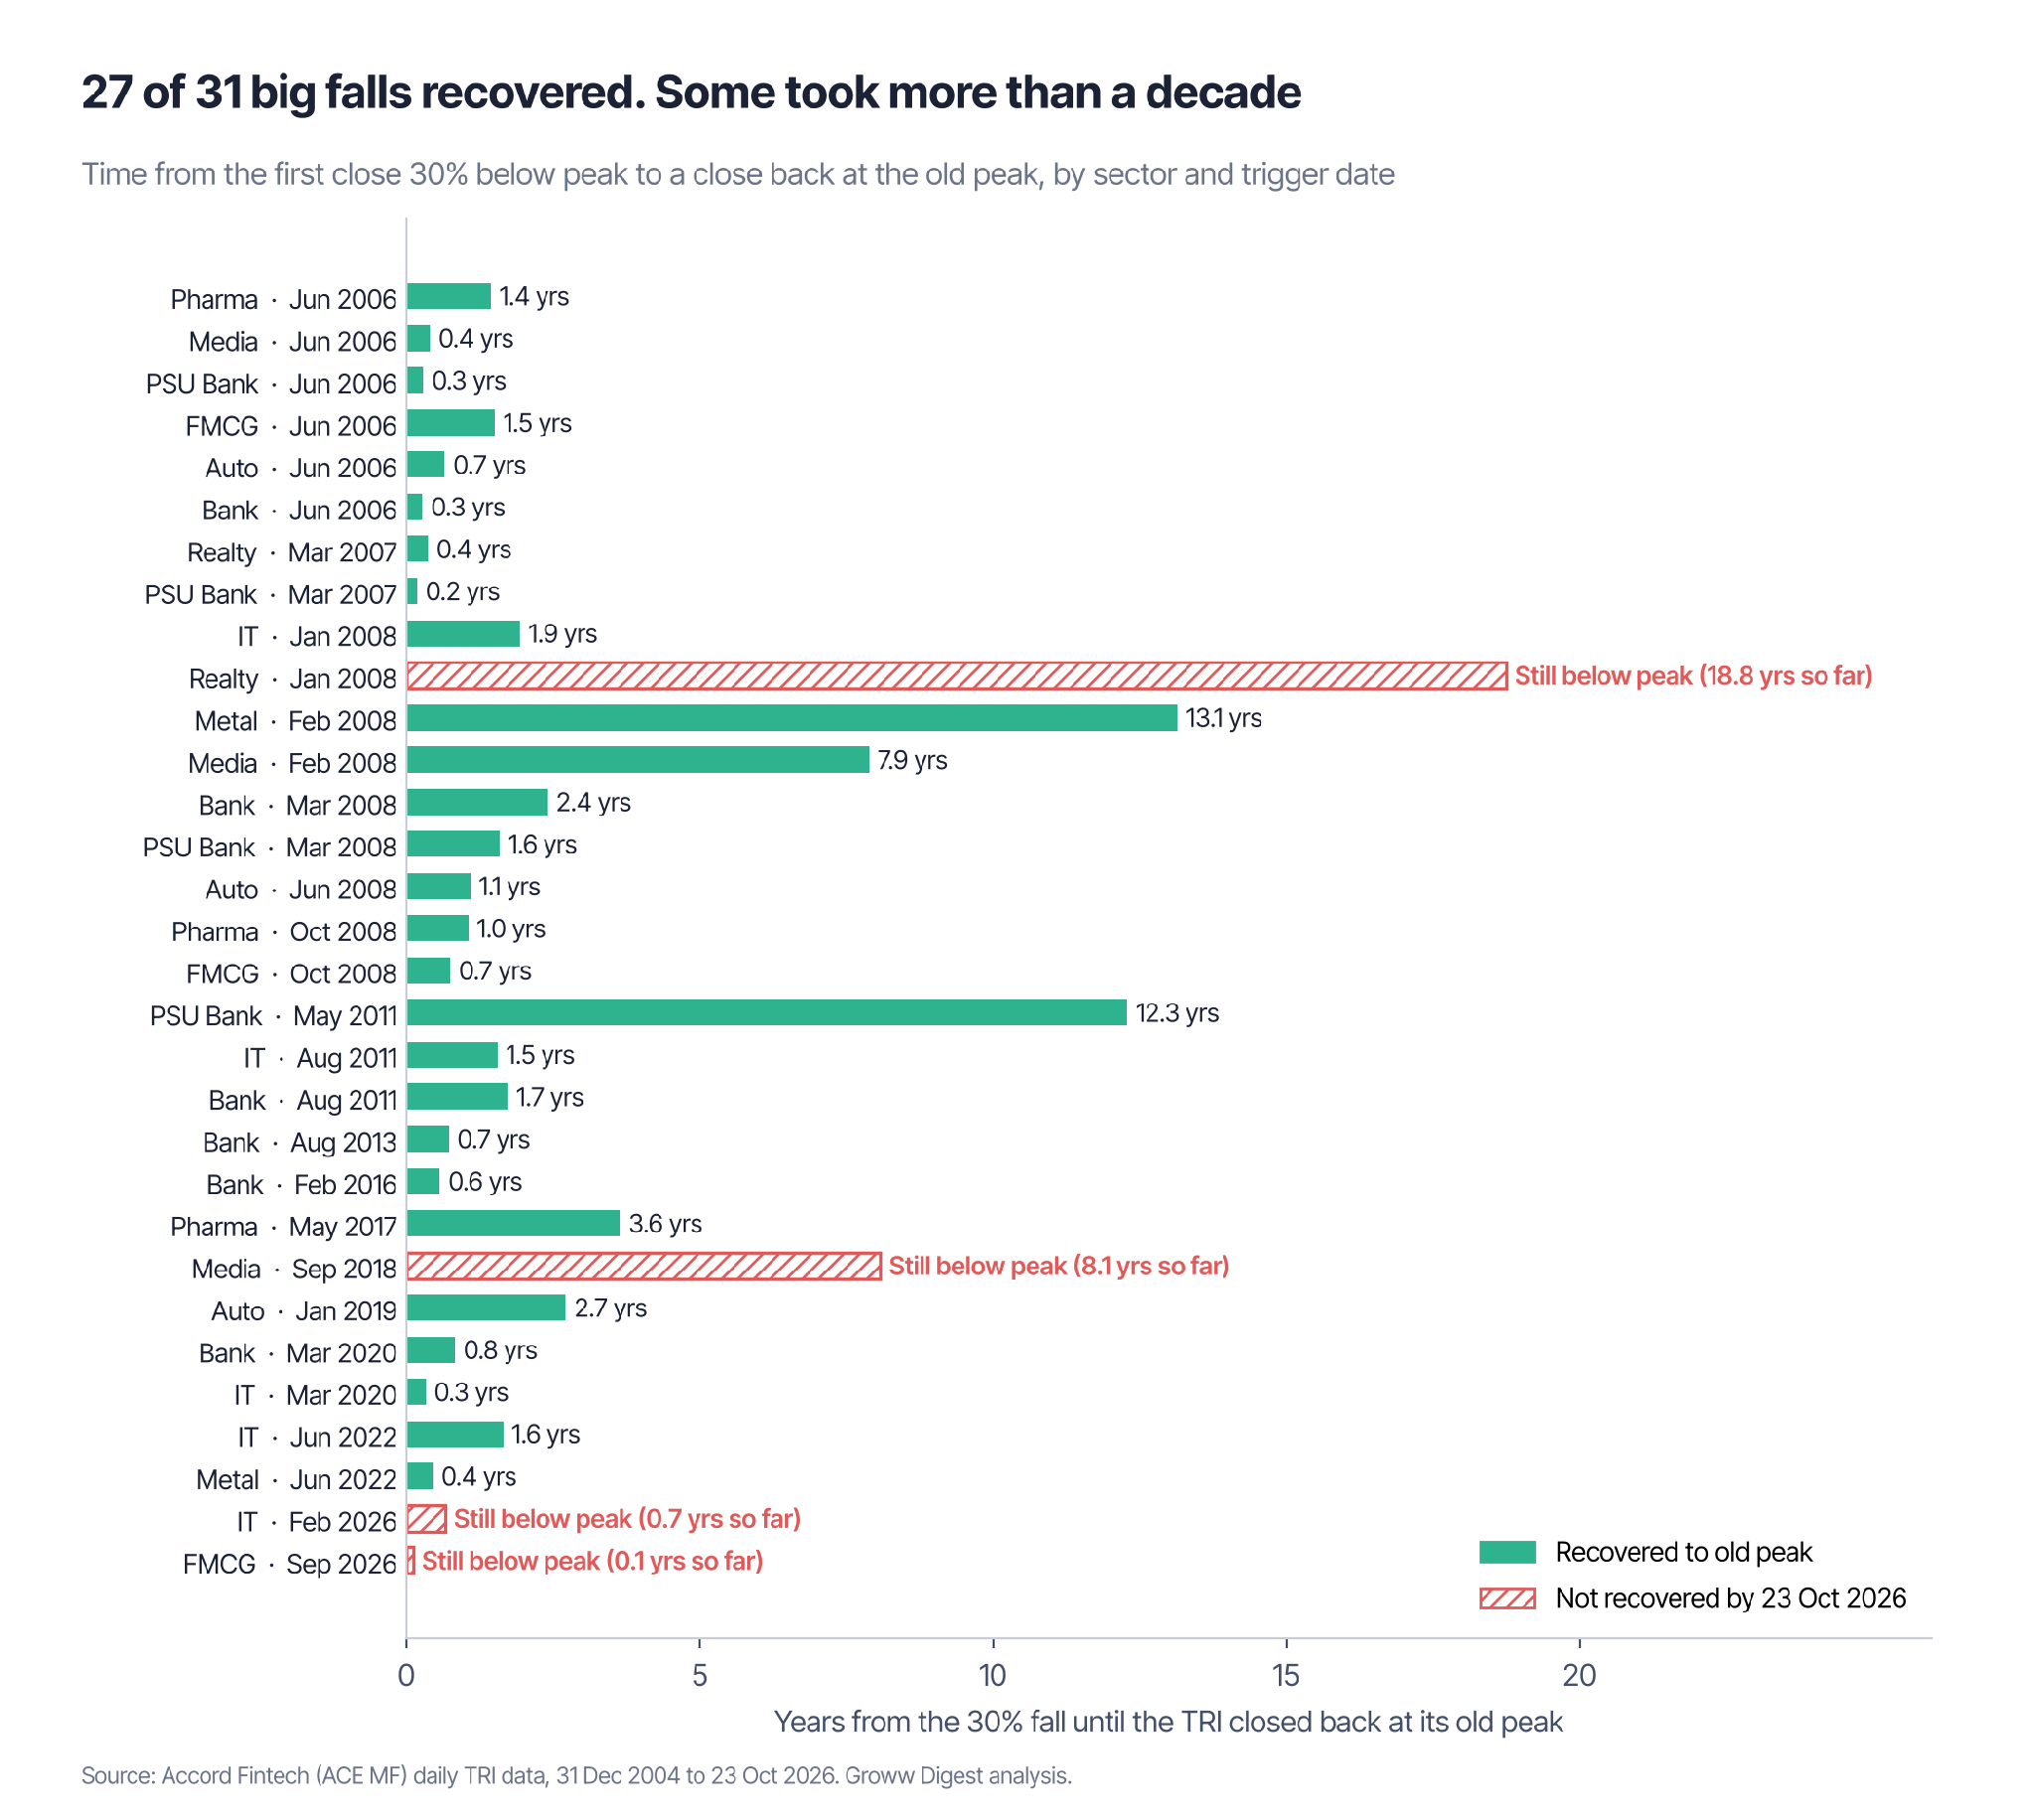
Time from the 30% signal until the sector closed back at its old peak.
The most extreme case is Realty.
If you had put Rs 100 into the Nifty Realty TRI at its peak on 14 January 2008, it would have fallen to about Rs 7 at its lowest point in February 2016. On 23 October 2026, more than 18 years later, it was worth about Rs 46. The same Rs 100 in the Nifty 50 TRI was worth about Rs 455.
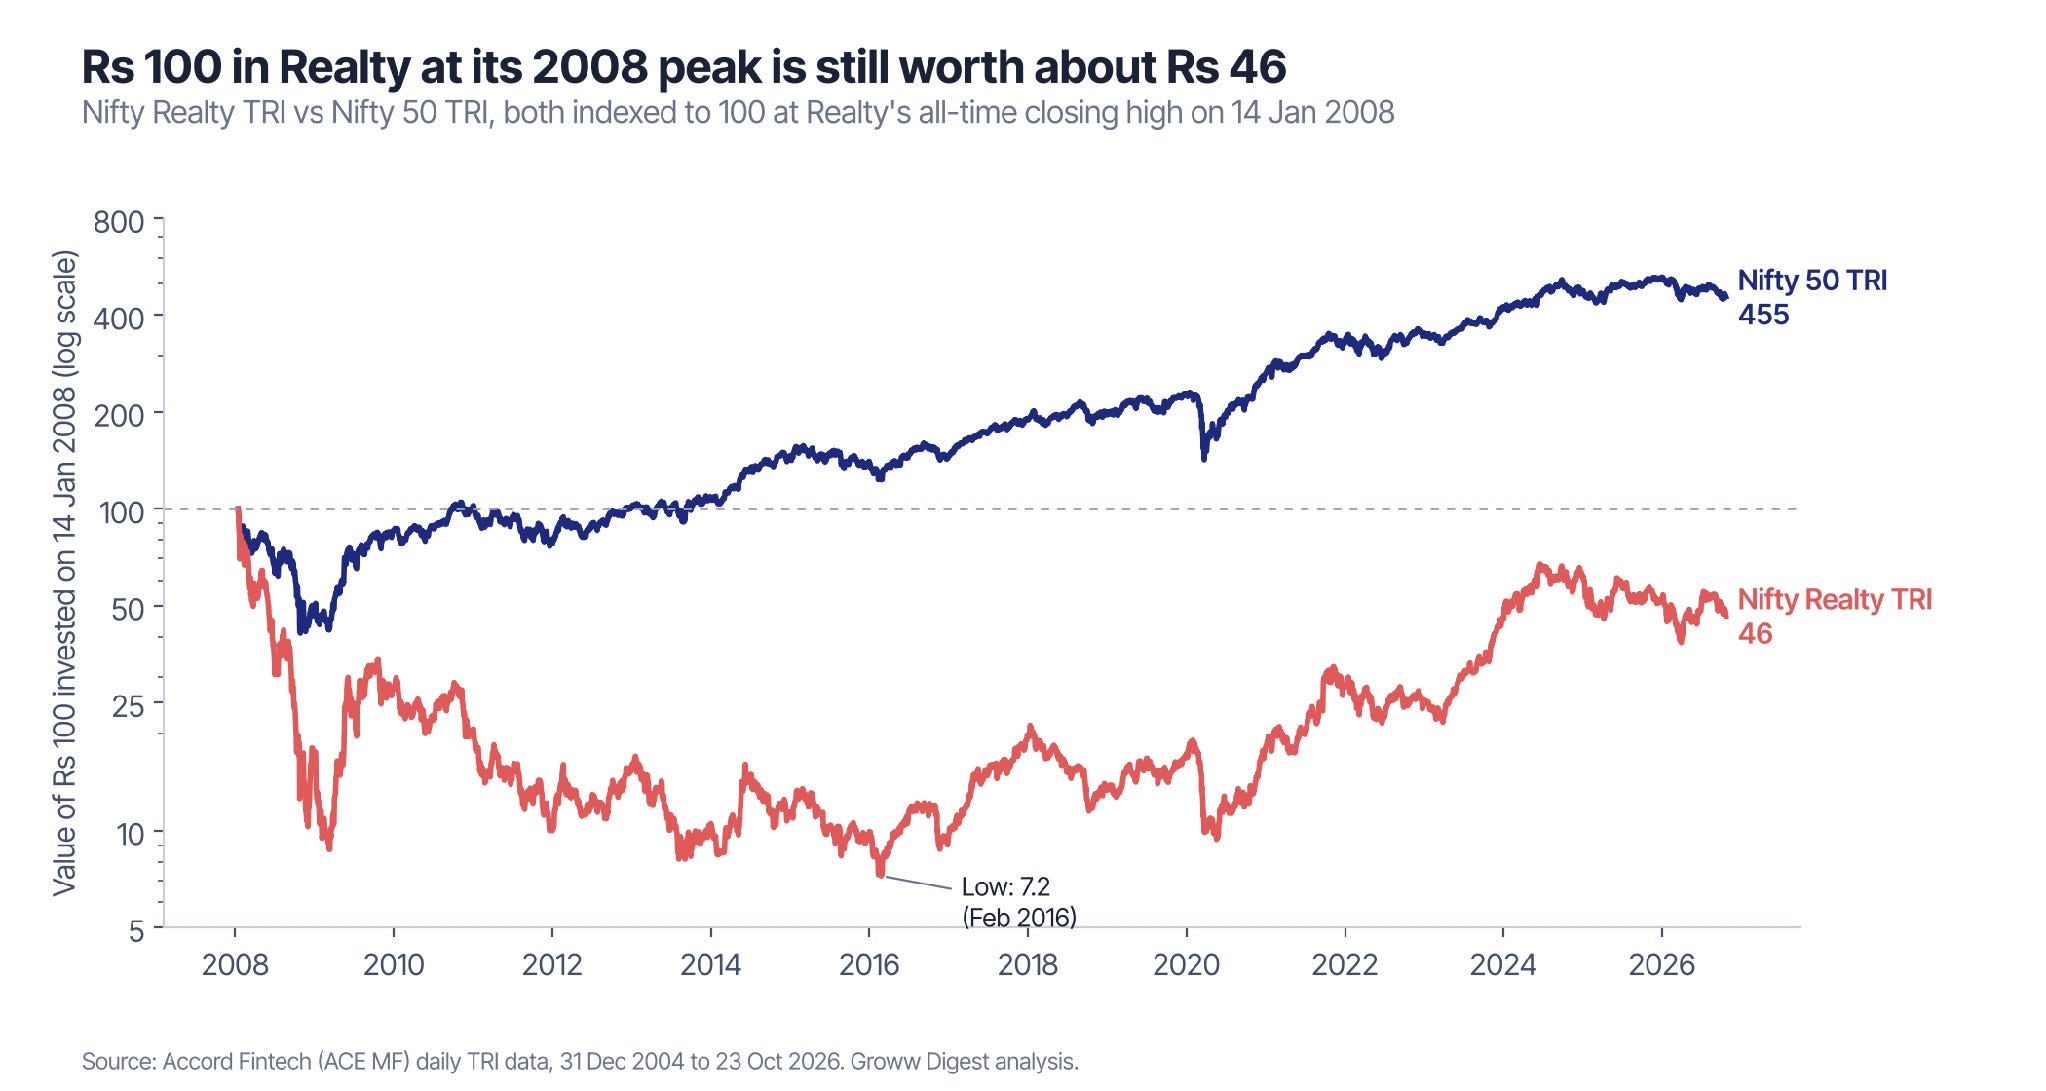
Realty has not returned to its January 2008 peak in more than 18 years.
Takeaway
So, does a sector become a better investment simply because it has performed badly?
Our study suggests that it’s not that simple.
After three years of underperformance, sectors continued to lag the Nifty in the following year in 8 out of 12 cases. Even over three years, the chances of beating the Nifty were roughly the same as usual.
Buying after a 30% fall didn’t offer a clear advantage either. The chances of beating the Nifty over the next three years were almost the same as buying on an ordinary day.
And in 12 out of 31 cases, the sector fell at least another 20% after the initial decline. Some sectors even took more than a decade to recover.
But this doesn’t mean buying a struggling sector is always a bad idea.
Sometimes, investors overreact to bad news, and the sector eventually recovers. Other times, the sector is struggling because its businesses are facing serious problems that could take years to resolve.
The important thing is that a sector isn’t automatically cheap just because it has fallen a lot.
Instead of looking only at how far a sector has fallen or how long it has underperformed, investors also need to understand why it has struggled and what could change in the future.
Things to Note
Small sample: We found only 12 cases of three-year underperformance and 31 cases of a 30% fall. A few different outcomes could significantly change the results.
Falls happened together: 15 of the 31 major falls occurred in 2006 and 2008. Since multiple sectors fell during the same market crashes, these aren’t independent events.
2008 influenced five-year returns: Many investments started in 2006–2008 and benefited from the 2009–2010 recovery.
Some data was calculated later: Auto, Media and Metal indices launched in July 2011, while PSU Bank and Realty launched in August 2007. NSE calculated earlier values retrospectively. Using only post-launch data, the 30%-fall strategy beat the Nifty in 13 of 21 cases over three years and 14 of 19 over five years.
Long falls counted once: A new fall was counted only after the sector regained its previous highest point. Since Realty never recovered to its 2008 peak, later falls weren’t counted.
No costs or taxes: We used index returns, excluding fund expenses and taxes.
Not investment advice: Past results don’t predict future sector performance.