

April 1912.
When the Titanic left Southampton, it was carrying more than 2,000 people and had 20 lifeboats on board.
That sounds low for such a huge ship. But Titanic was actually following, and even exceeding, the British lifeboat rules that existed at the time.
The problem was that those rules had been written years earlier, when ships were much smaller. Once a ship crossed a certain size, the number of lifeboats required did not keep increasing in proportion to how much bigger the ship became.
Titanic was far bigger than the ships those rules had originally been designed around.
So the number was not random. It came from a rule that had once been set for a reason.
The problem was that the ship had changed a lot, while the reference being used to judge had not changed with it.
And that is the interesting thing about old reference points.
Once a number becomes important, we tend to keep coming back to it even much later, sometimes after everything around that number has changed.
The same habit of holding on to an old number can show up with IPOs.
Imagine a company comes out with an IPO at an issue price of Rs 100.
After listing, the stock moves up. Say it reaches Rs 140 and, over the next few months, goes on to Rs 200.
Maybe you did not get shares in the IPO. Or maybe you simply did not buy the stock after it was listed.
Then, a few months or years later, you notice that the same stock has fallen back to Rs 103.
Now Rs 103 can feel different from just another market price.
You remember that the IPO itself came at Rs 100. You also remember that the stock had traded much higher after that.
So it is easy to wonder:
“If this company originally came to the market at Rs 100, am I now getting another chance to buy it around that same price?”
That is the idea we wanted to test.
So we asked a simple question:
If an IPO first went up meaningfully and then later came back near its issue price, what happened if you bought it there?
Was it really a second chance?
The Study
To test this, we started with 492 mainboard IPOs whose issues opened between 2015 and 2025. We had a usable price history for 480 of them, using data available up to 17 September 2026.
But we did not want to count stocks that simply stayed around their issue price.
So first, the stock had to close at least 20% above its issue price. If the IPO came at Rs 100, the stock had to first close at Rs 120 or more. That could happen on the listing day itself or sometime later.
Only after that did we look for the first time the stock came back near its issue price.
For our main study, “near” meant within 5% above or below the issue price. So for a Rs 100 IPO, we looked for the first close between Rs 95 and Rs 105.
We then treated that as the entry point and checked what happened after 1 month, 3 months, 6 months, 12 months and 24 months.
And if a stock came back near its issue price more than once, we only used the first revisit.
So if a stock went from Rs 100 to Rs 160, came back to Rs 103, went up again and later fell to Rs 98, we used Rs 103.
That way, we were looking at the first real second chance an investor would have seen, not picking a better price later with hindsight.
We also ran the same study using the next trading day’s opening price as the entry, and repeated it with a wider 10% band around the issue price.
How often did this happen?
Of the 480 companies in the study, 401 closed at least 20% above their issue price at some point after listing.
We used that 20% rise as the first filter because we did not want to include stocks that simply stayed around their IPO price from the beginning. We wanted stocks that had first moved clearly above the issue price and then later came back near it.
Out of those 401 stocks, 270 later returned within 5% of their issue price.
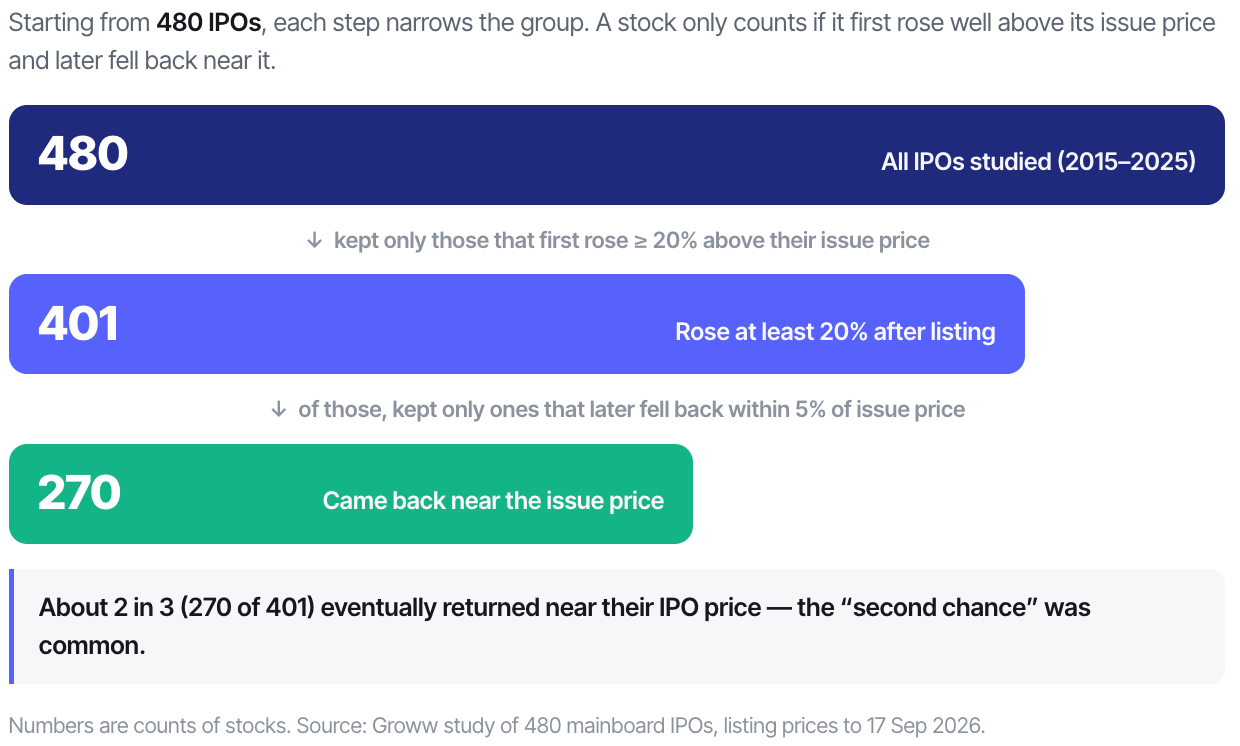
That works out to roughly 67%, or about two out of every three stocks that had first risen at least 20%.
So the situation we are studying was actually quite common.
The other 131 stocks did not return to this 5% range during the period we followed them. This does not mean they will never return. Some of the newer IPOs have simply had much less time than companies that listed several years ago.
The time taken to come back also varied quite a bit.
In 21 cases, the stock returned close to its issue price within 30 days of listing.
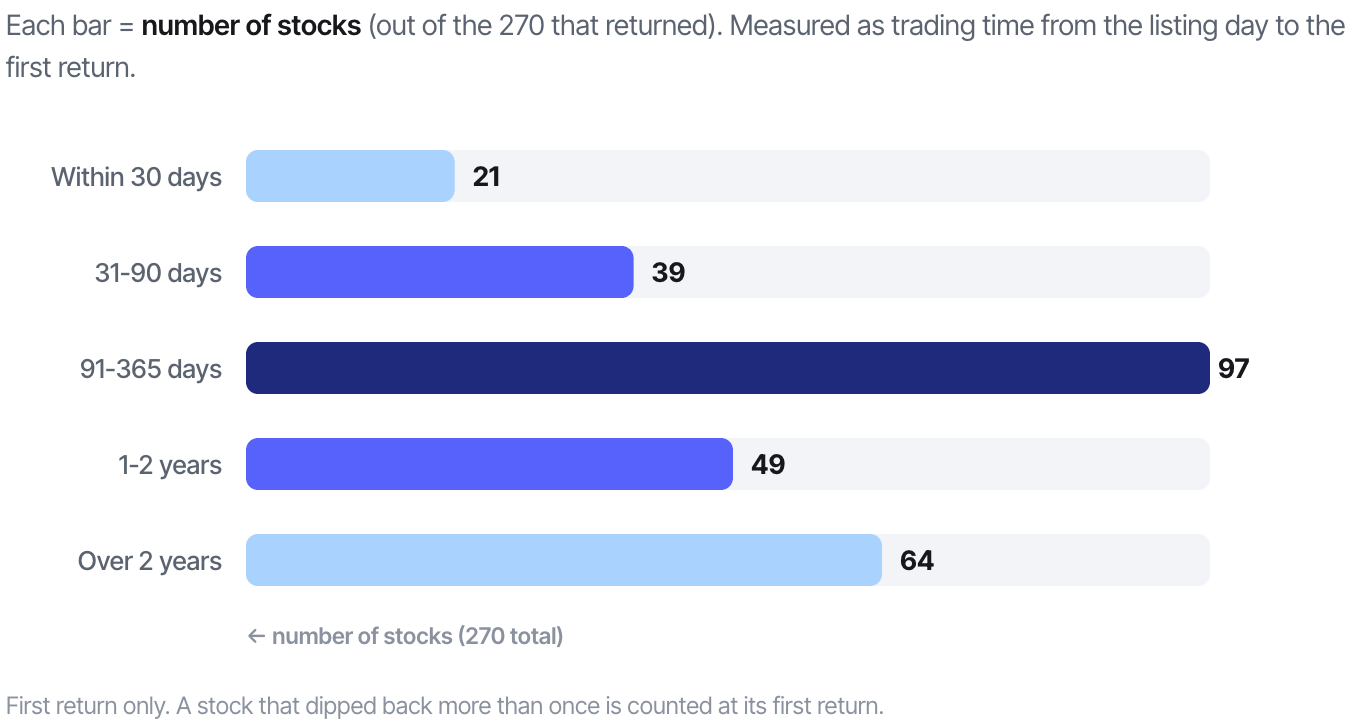
So this was not only something that happened immediately after listing. In many cases, the stock stayed away from the issue price for months or even years before eventually coming back.
What is interesting here is simply how often the original issue price came back into the picture. Even after a stock had first moved at least 20% higher, roughly two-thirds of these companies later traded close to that starting price again.
Our data does not tell us why each stock returned there. The reason could be different for every company. But it does show that returning near the issue price after an earlier rise was common enough to study separately.
The bigger question is what happened after investors got that second chance near the IPO price.
How much had they already fallen?
The next question was how far these stocks had already fallen before coming back near their issue price.
For each of the 270 stocks, we took the highest closing price it had reached before the revisit and compared it with the price on the day it came back into the 5% range.
Each bar = number of stocks (out of 270), grouped by how far the price had fallen from its earlier peak by the time it came back near the issue price.
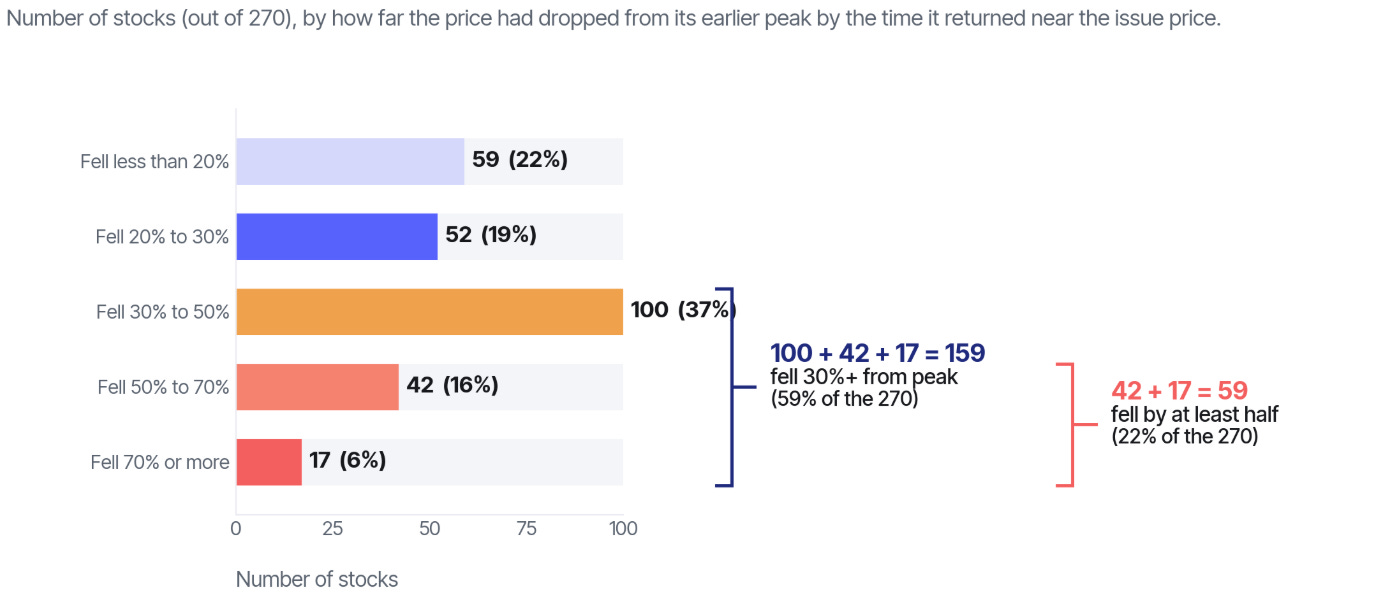
So 159 stocks had already fallen at least 30% from their earlier high, and 59 had already fallen by at least half.
That is important because two stocks could both be back near their issue price and still have had very different journeys.
One may have fallen only a little from its earlier high. Another may have already lost half its value.
So being “back near the IPO price” did not tell us how much the stock had already fallen.
But that still leaves the more important question.
Once it came back near the issue price, was it actually a good place to buy?
What happened a year after buying?
For 209 of the 270 stocks, we had enough data to follow them for a full year after the first revisit.
Of these, 90 were higher and 119 were lower than their starting price one year later.
So 43.1% went up and 56.9% went down.
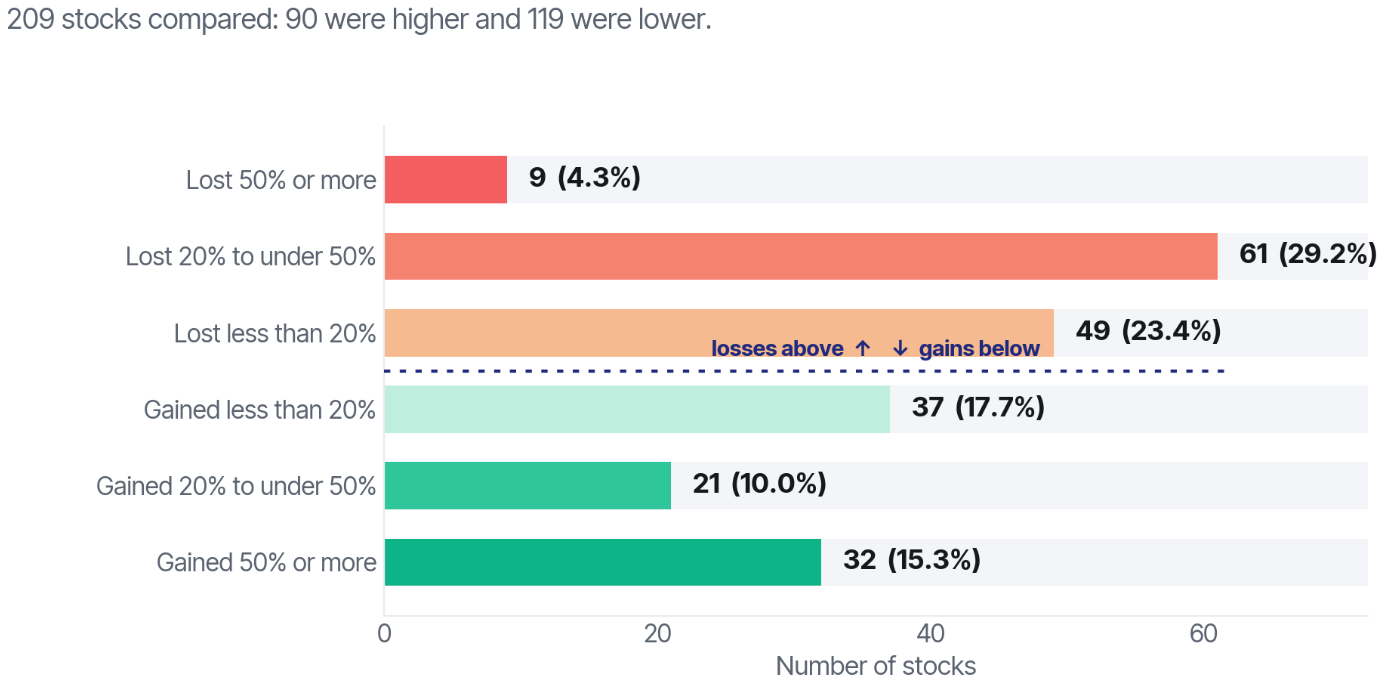
The outcomes were very different across stocks.
32 stocks gained at least 50% over the year.
At the other end, 70 stocks lost at least 20%, including nine that lost at least half their value.
So buying near the issue price did not always go badly. Some stocks did very well.
But the main result is that more stocks finished the year lower than higher.
How much further did prices fall along the way?
The one-year return still does not show the full experience.
A stock can finish the year with a gain and still fall sharply before recovering.
So we also checked the daily closing prices during that one-year period to see how far each stock fell below the buying price.
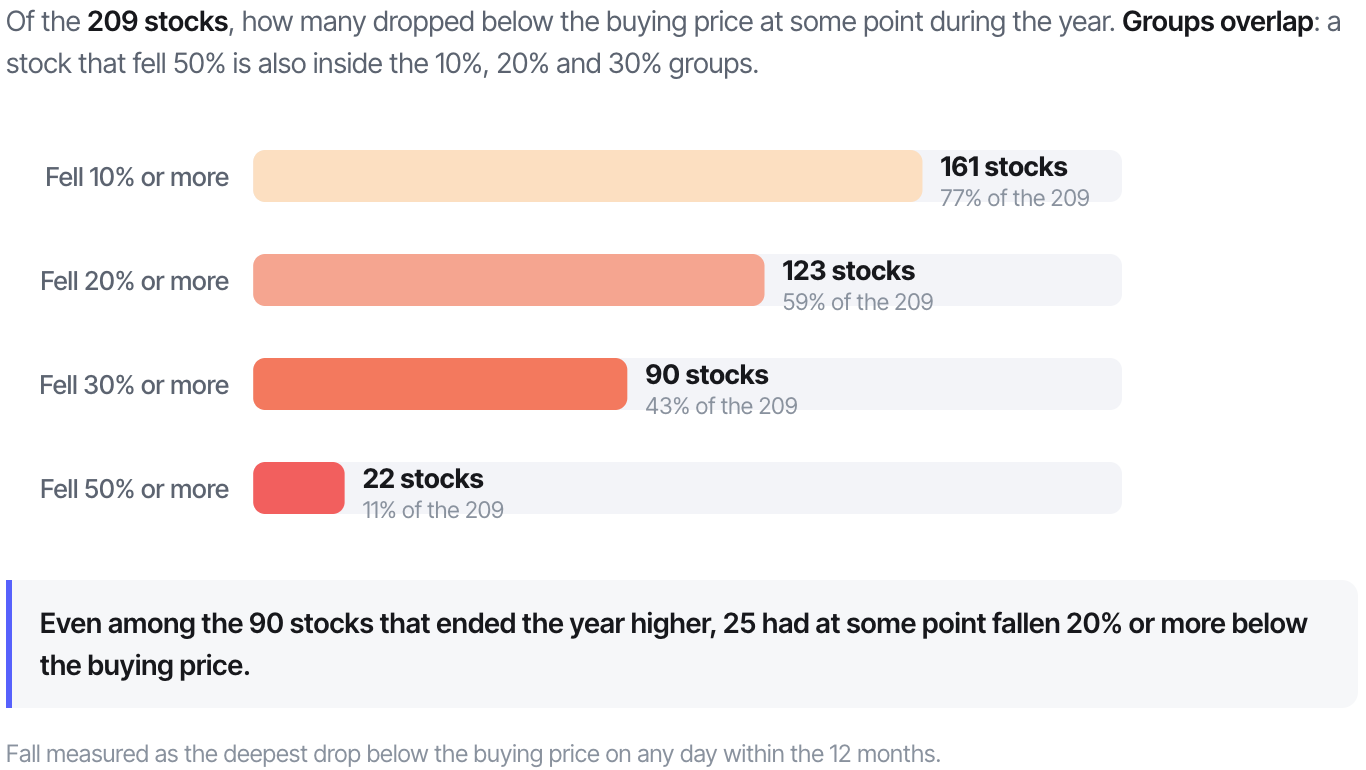
These groups overlap. So a stock that fell 50% is also included in the 20% and 30% groups.
Of the 209 stocks, 123 fell at least another 20% below the buying price during the year. 90 fell at least 30%, while 22 fell by at least half.
Even among the 90 stocks that ended the year higher, 25 had first fallen at least 20% below our buying price.
Quess Corp is one example.
It eventually ended the year 123.9% higher.
But before that happened, the stock had at one point closed 45.5% below the price at which our study entered.
So even a stock that later became a big winner could make you sit through a very large fall first.
This is important because looking only at the one-year return can hide what happened in between.
The stock may have already fallen a lot before you bought it. That did not mean the downside was over.
How different could individual results be?
The overall numbers tell us how often stocks went up or down. But looking at individual stocks shows how different the actual experience could be.
Zomato
Zomato’s issue price was Rs 76. Before coming back near that price, the stock had closed as high as Rs 160.30.
On 22 February 2022, it closed at Rs 79.70, which meant the stock was already down about 50% from its earlier high.
But the fall did not stop there.
A year later, Zomato closed at Rs 52.95. Someone buying at Rs 79.70 would have been down 33.6% after one year, and during that year the stock had at one point closed 47.7% below the buying price.
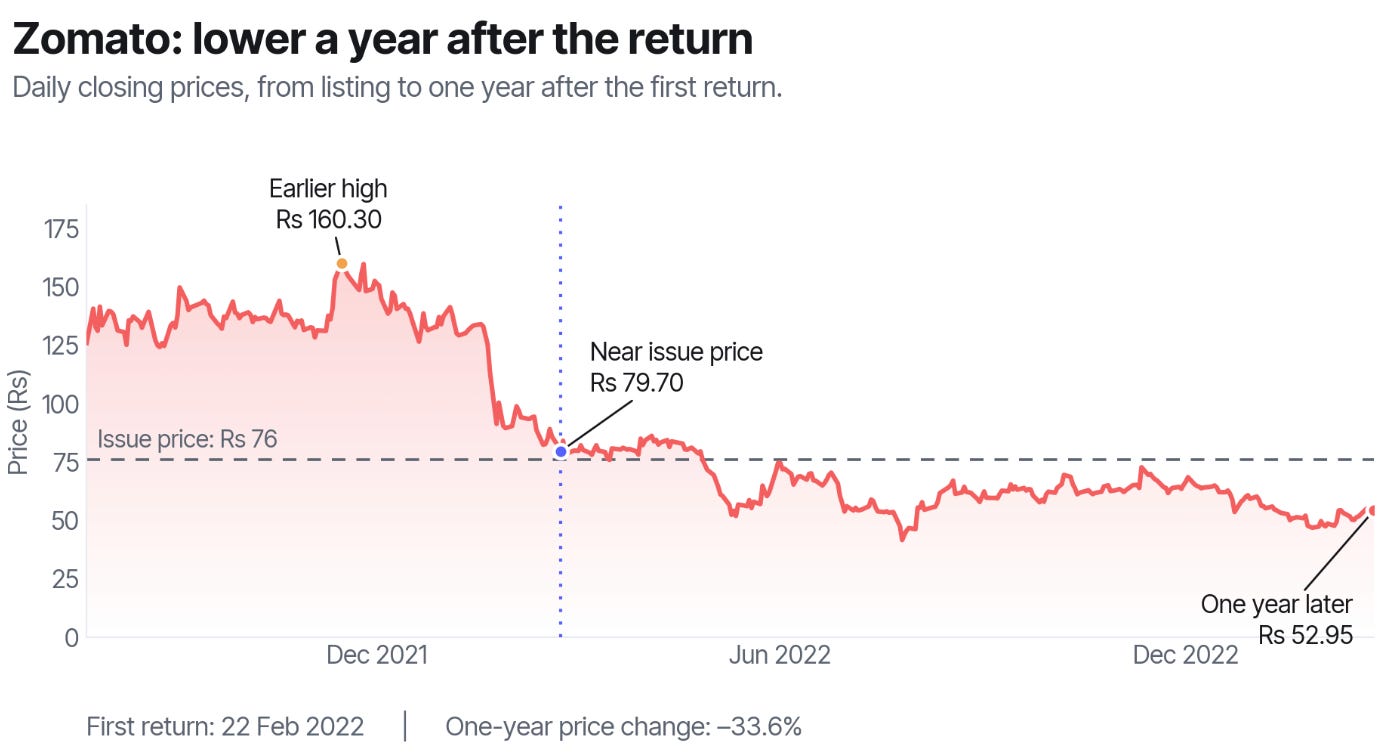
So just because a stock had already fallen a lot did not mean most of the downside was already over.
IRFC
Now look at IRFC.
Its issue price was Rs 26. Before coming back near that level, the stock had reached an earlier closing high of Rs 35.65.
On 27 February 2023, it closed at Rs 27.10. A year later, it was at Rs 151.60, which is a 459.4% gain from the starting price.
During that year, its largest further fall below the buying price was only 5.9%.
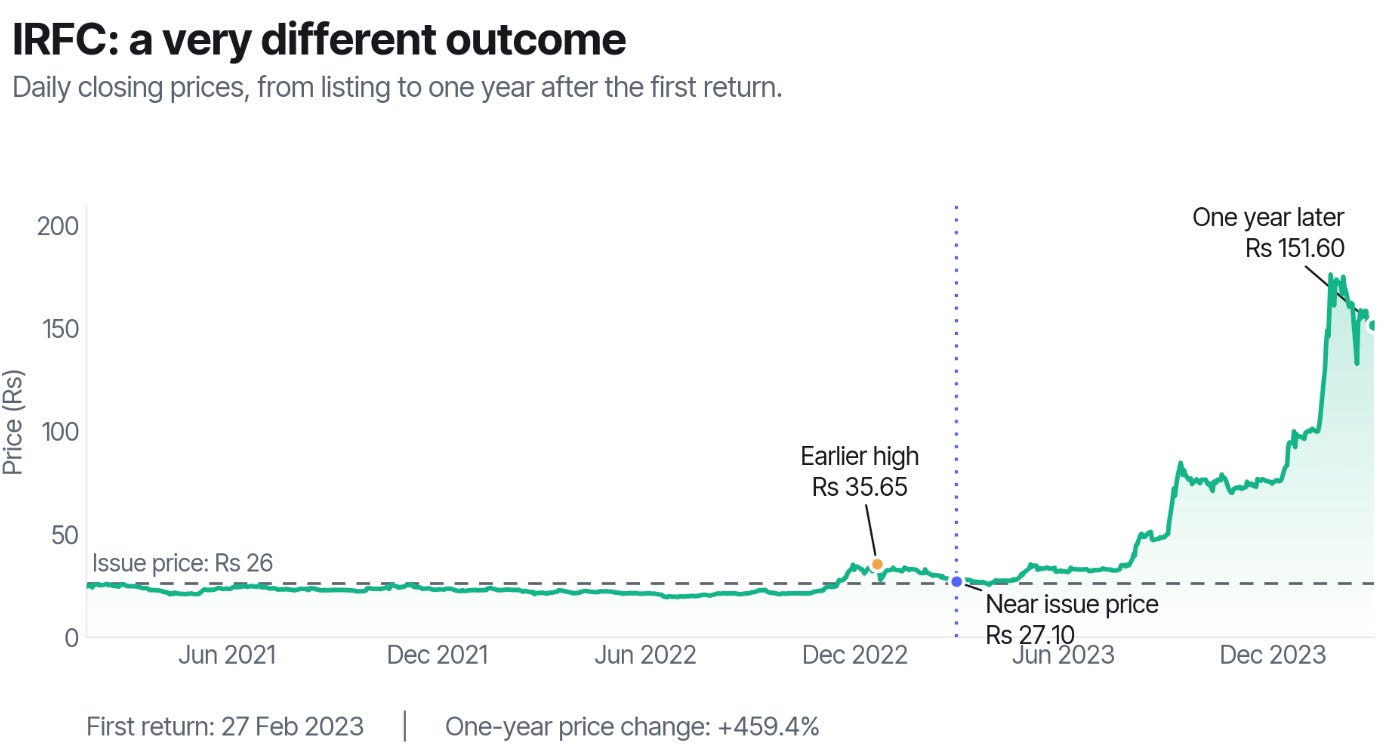
What is interesting here is that IRFC did not just recover its old high. Going from Rs 27.10 back to Rs 35.65 would have been a gain of around 31.5%, but the stock went much further than that.
Taken together, Zomato and IRFC show why the issue-price setup alone was not enough to tell you what would happen next.
Both stocks had first moved higher and later came back near their issue price, but one kept falling while the other went on to rise several times over.
So while the rule helped us identify the same kind of starting point, it did not tell us which stock would become a winner and which one would become a loser.
Did a bigger earlier rise improve the outcome?
We also wanted to check whether a bigger earlier rally made any difference.
So we grouped the 209 stocks based on how far they had risen above their issue price before coming back near it.
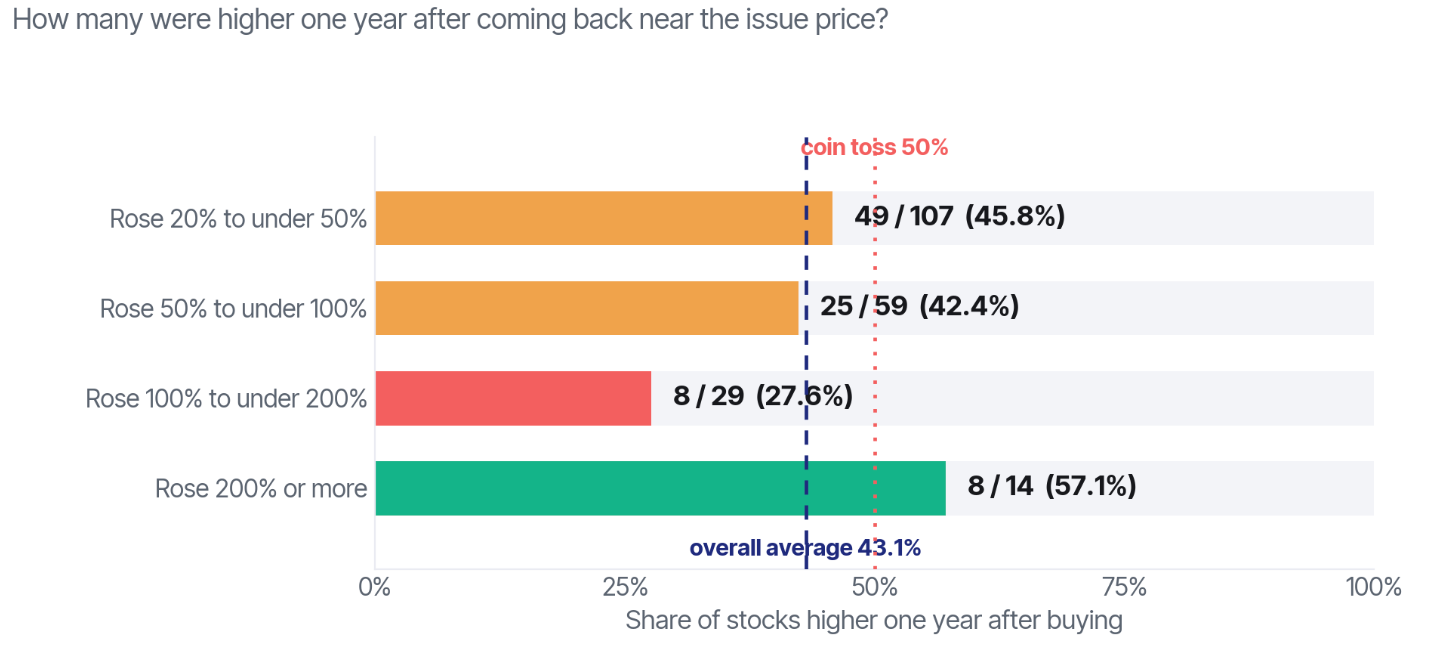
The pattern was not very clear.
Stocks that had risen more earlier did not consistently have better one-year outcomes after returning near the issue price.
The group that had risen the most did show a higher share of positive outcomes, but it had only 14 companies, so it is too small to draw a strong conclusion from.
We also checked whether the listing gain made a difference.
Among stocks that had listed at least 20% above their issue price, 33 out of 80 were higher one year after the revisit.
For stocks that had listed at a smaller premium, it was 34 out of 78.
And for stocks that had listed at or below their issue price, it was 23 out of 51.
So a bigger listing gain or a bigger rally before the fall did not clearly improve the chances of a positive one-year outcome.
In simple terms, the fact that a stock had once gone much higher did not make the later return near issue price more reliable.
We also checked whether changing the entry rule made much difference.
If we bought at the next trading day’s opening price, 91 of 209 stocks were higher after one year, or 43.5%. In our main test, it was 43.1%.
We also widened the issue-price range from 5% to 10%. Here, 104 of 231 stocks, or 45.0%, were higher after one year.
So the numbers changed slightly.
But the overall result did not.
Even after changing the entry price or widening the range, fewer than half the stocks were higher after one year.
Did holding for longer help?
We also checked what happened over different holding periods.
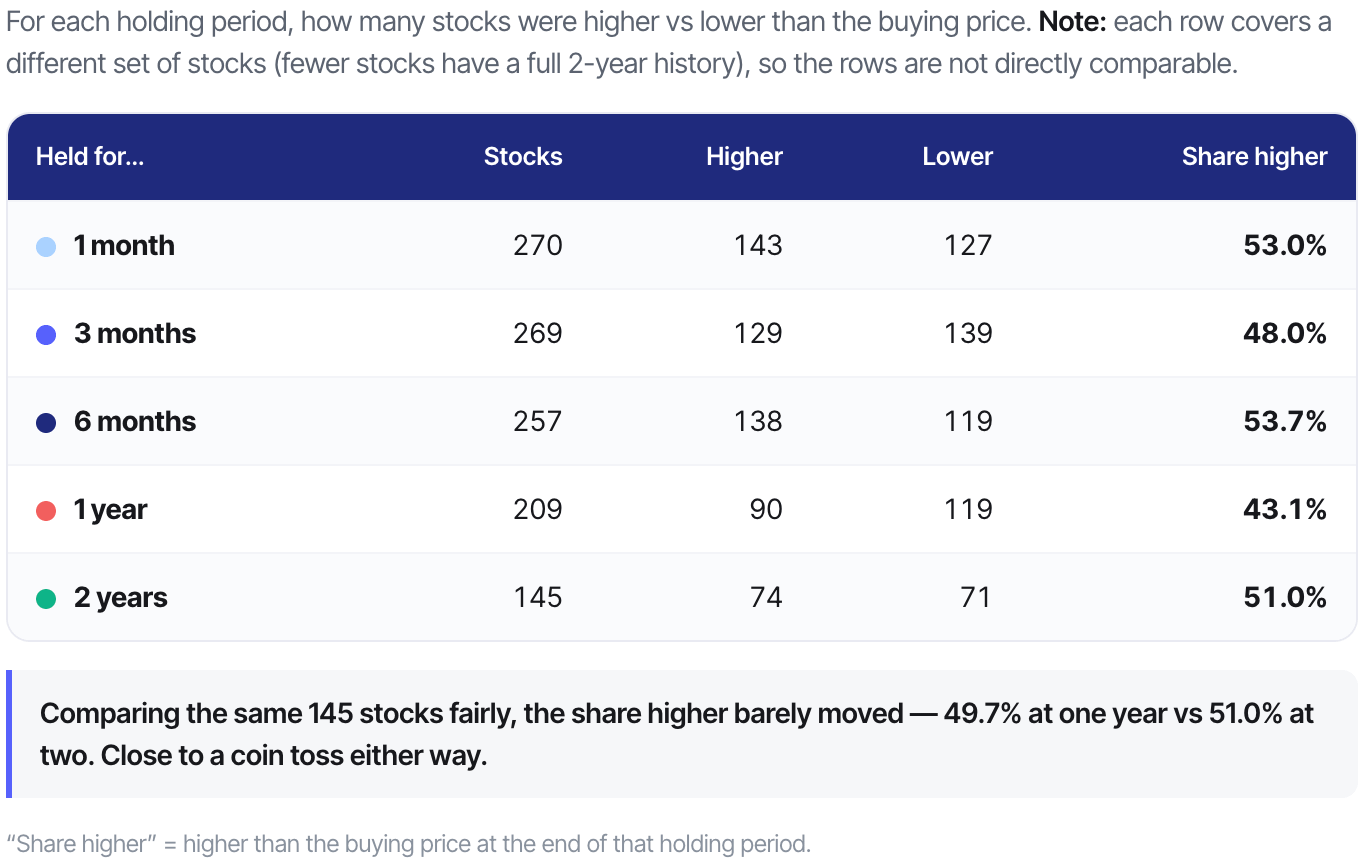
At first, it may look like waiting two years helped, because the share of positive outcomes rises from 43.1% after one year to 51.0% after two years.
But these are not the same group of stocks.
Only 145 stocks had enough data for a full two-year comparison, while the one-year group had 209.
So we also looked only at those same 145 stocks.
Among them, 72 were higher after one year and 74 were higher after two years.
That means the positive share moved only from 49.7% to 51.0%.
So for this same group of companies, waiting another year did not suddenly turn the outcome clearly positive. It remained close to half and half.
Among these 145 stocks, 74 also reached their earlier closing high at some point during those two years, although they did not necessarily stay there.
So, what does this tell us?
The issue price is the price at which shares were offered to investors in the IPO. At that time, investors were looking at the company’s financials, growth expectations and market conditions as they existed then.
By the time the stock comes back near that price, months or even years may have passed. The company’s earnings, growth outlook and the valuation investors are willing to pay could all be very different.
Our study does not tell us which of these things changed for each company. We did not study profits, debt, growth or valuation. We only looked at what happened to the share price after this setup appeared.
And the results were mixed.
Some stocks went on to become large winners. Others kept falling. A bigger earlier rally did not show a clear, consistent advantage, and changing the entry rule or widening the price range still left fewer than half the stocks higher after one year.
So the issue price can still be a useful reference because it tells you the price at which the shares were originally offered in the IPO.
But it does not automatically tell you whether the stock is cheap when it comes back there.
The issue price tells you what investors paid in the IPO. It does not, on its own, tell you what the business is worth today.