

In November 2021, Elon Musk sent a direct message to 19 year old college student and offered him $5,000 to shut down a Twitter account.
That teenager was Jack Sweeney.
While studying at the University of Central Florida, Sweeney built a Twitter bot called @ElonJet.
The account wasn’t spreading rumours, nor was it hacking into anything.
Instead, it relied on a technology called ADS-B.
ADS-B (Automatic Dependent Surveillance-Broadcast) is publicly available data that broadcasts the aeroplane’s location, altitude, speed, and direction. It is primarily used by air traffic controllers and nearby aircraft for safety.
Sweeney decided to use that public data to track Elon Musk’s private jet.
The bot monitored Musk’s aircraft and automatically posted updates whenever the jet took off or landed. As a result, whenever Musk’s jet moved, the internet knew.
The account quickly became popular. Journalists, investors, and Tesla enthusiasts started following it closely.
Why?
Because the jet’s movements often seemed to reveal important business developments before any official announcement.
If the aircraft repeatedly appeared near a Tesla facility, people wondered whether the company was planning a new expansion. If it landed in Washington, speculation grew about meetings with regulators or government officials. And when it showed up near another company’s headquarters, rumours of partnerships, acquisitions, or corporate negotiations quickly followed.
People weren’t analysing the business itself.
They were analysing the movements of the person running the business.
The assumption was if important people are moving around, they probably know something.
Investors often apply the same logic to shareholding patterns.
Every listed company is required to disclose a shareholding pattern every quarter. This report shows who owns the company’s shares and how those ownership stakes have changed over the previous three months.
Investors closely examine these filings to see whether promoters, mutual funds, foreign institutions, or retail investors are increasing or reducing their stakes.
The belief is simple: changes in ownership might reveal something before the company’s results, announcements, or stock price do.
Which raises an interesting question.
Does the shareholding pattern actually tell us anything useful about where a stock goes next?
We decided to find out.
The Experiment
We started with the Nifty 50 constituents as they existed in November 2013.
From this list, we collected quarterly shareholding data from December 2013 to March 2026.
For every company and every quarter, we recorded three ownership categories:
Promoter and promoter group ownership
Institutional ownership
Non-institutional ownership
Next, we collected daily stock price data for the same companies and measured what happened to stock prices after ownership changed.
To avoid reacting to tiny fluctuations, only changes larger than 0.25 percentage points were treated as meaningful.
For each observation, we then measured stock returns over the following year.
Study 1: Do promoter ownership changes matter?
For every quarter, we calculated how much promoter ownership changed compared to the previous quarter. Each observation was placed into one of three groups.
Promoter ownership increased, promoter ownership decreased, or no meaningful change (less than 0.25 percentage points in either direction).
We then counted how many times the stock was higher or lower one year later in each group.
If promoter ownership is an important signal, stocks where promoters increased their stake should have gone up more often than stocks where promoters reduced it.
Study 2: Do institutional ownership changes matter?
We repeated the exact same process for institutional ownership, which in our dataset combines FII and DII into one number.
For every quarter, each observation was placed into one of three groups.
Institutional ownership increased, decreased, or did not change meaningfully.
We then counted outcomes one year later for each group.
The question was simple. If institutions are smart money, stocks they were accumulating should have gone up more often than stocks they were exiting.
Study 3: Do non-institutional ownership changes matter?
We repeated the same process for non-institutional ownership. This category covers everyone who is not a promoter and not an institution (retail investors, HNIs, trusts, and family offices).
Again, three groups. Increased, decreased, no meaningful change. Outcomes counted one year later.
This let us test the contrarian belief that rising retail participation is a warning sign.
Study 4: Do ownership streaks matter more than single-quarter changes?
The first three studies looked at one quarter in isolation.
But a single quarter of buying or selling can happen for many reasons and may mean nothing.
So we looked for streaks, consecutive quarters where the same ownership group kept moving in the same direction.
For each streak length, we counted how many times the stock was higher or lower one year later.
The question was whether persistence made any signal stronger than a one-off change.
Results
Study 1:
Promoter holding is one of the most closely watched numbers in a company’s shareholding pattern.
The common belief is that if promoters are buying more shares, they must be confident about the company’s future. If they are selling shares, something must be wrong.
But the data doesn’t support such a straightforward conclusion.
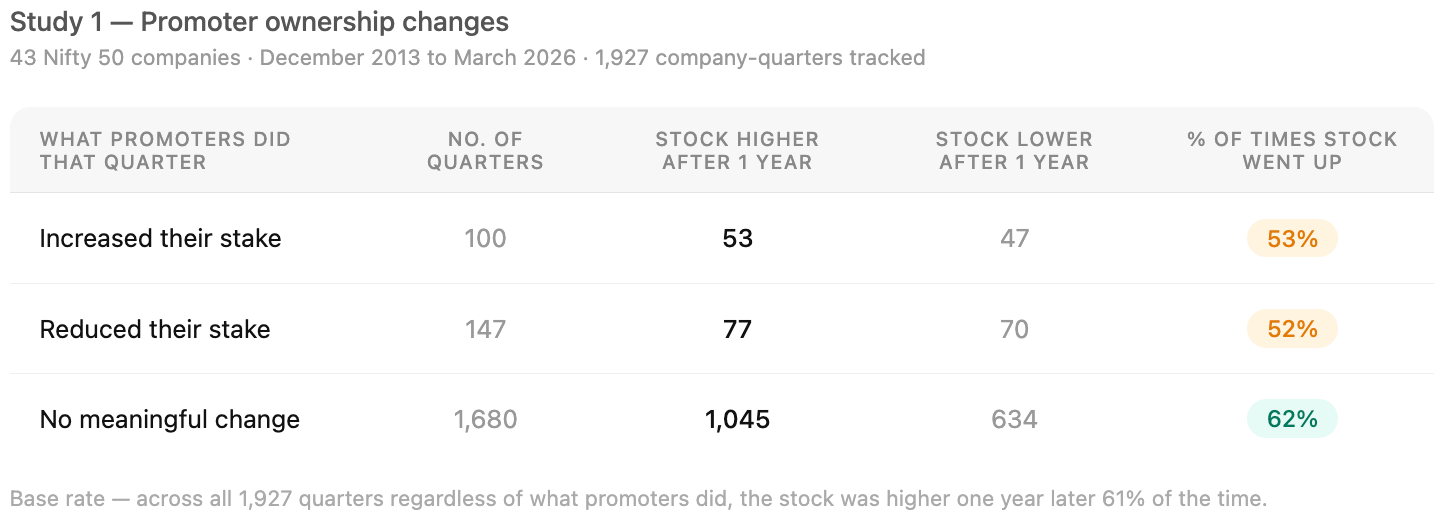
In 100 quarters where promoters increased their stake, the stock was higher a year later in 53 cases and lower in 47. That is a 53%.
In 147 quarters where promoters reduced their stake, the stock was higher a year later in 77 cases and lower in 70. That is also a 52% hit rate.
A coin flip is 50%.
The 1,680 quarters, where promoter ownership barely moved, produced a 62% hit rate.
The two groups were nearly identical, with promoter buying leading to positive one-year outcomes 53% of the time versus 52% for promoter selling.
The difference is just one percentage point.
If promoter ownership changes contained a strong signal about future stock performance, we would expect a much wider gap between these two groups. Promoter buying should consistently be associated with better outcomes than promoter selling.
That is not what the data shows.
Instead, stocks performed remarkably similarly after both promoter buying and promoter selling.
This does not mean promoter ownership is unimportant. Promoters remain the largest owners of many Indian companies and their actions can matter enormously in specific situations.
But across this dataset, small quarter-to-quarter changes in promoter ownership did not appear to provide a reliable clue about where a stock would be one year later.
The shareholding pattern tells us that ownership changed.
It does not tell us whether that change happened because of conviction, compliance requirements, family arrangements, dilution, liquidity needs, or something else entirely.
And that may be why the signal appears so weak.
The broader lesson is not that investors should ignore promoter ownership. It is that promoter ownership, by itself, may not be enough.
Study 2:
When institutions bought or sold
If promoter holding is the signal retail investors watch most, institutional holding is the one they trust.
The reasoning makes sense. Why wouldn’t they?
Institutions have research teams, analyst coverage, management access, and decades of market experience.
This 2nd study tests whether that trust was justified.
Across our dataset, institutional ownership moved up or down in 1,087 out of 1,927 observations. That’s far more often than promoter ownership, which suggests institutions were constantly buying, selling, and tweaking their positions.
We then looked at what happened to stock prices over the following year.
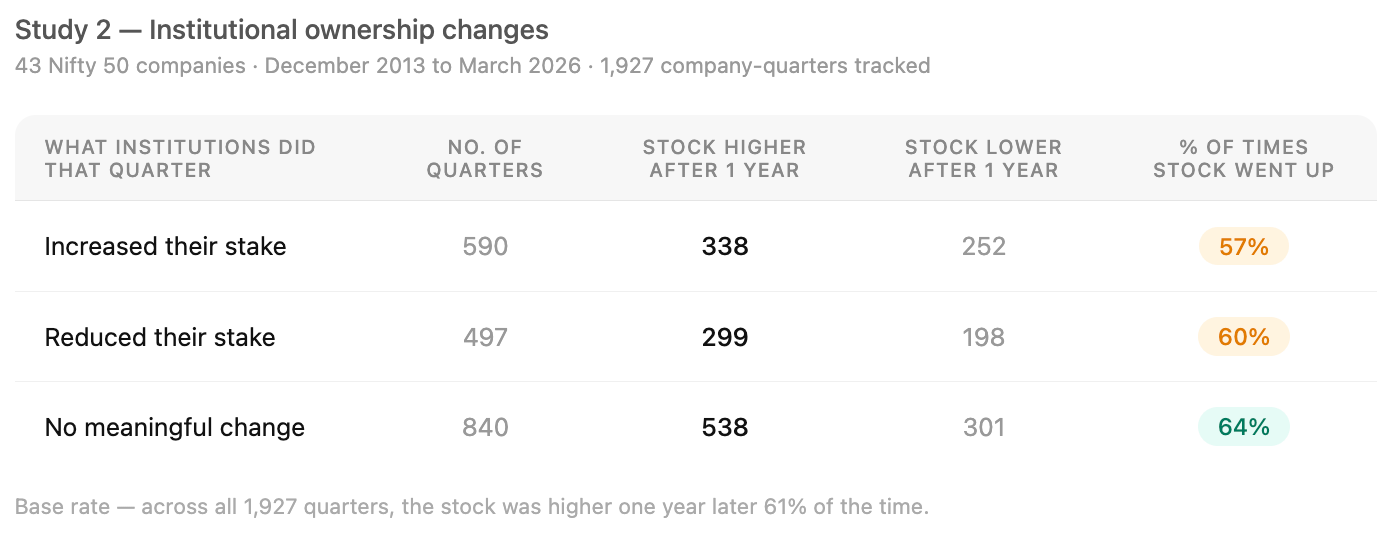
In 590 quarters where institutions increased their stake, the stock was higher a year later in 57% of observations. In 497 quarters where institutions reduced their stake, the stock was higher a year later in 60% of observations. The 840 quarters where institutional ownership barely changed saw stocks end higher one year later in 64% of observations.
One possible explanation is that institutional activity is often more complicated than it appears.
Institutions do not buy and sell stocks for just one reason. New money comes into funds. Investors withdraw money. Portfolios get rebalanced. Sector allocations change. Risk limits get adjusted.
The shareholding pattern tells us that institutions changed their position. It doesn’t tell us why.
Stocks performed broadly similarly after both institutional buying and institutional selling. The gap between the two was much smaller than most investors would probably expect.
Knowing whether institutions were buying or selling did not tell us much about where a stock would be one year later.
Study 3:
When retail and public ownership moved
The last group we looked at was non-institutional ownership. This includes retail investors, HNIs, family offices, trusts, and other non-institutional holders.
Opinions on this group are often completely opposite. Some investors see rising public ownership as a positive sign. More people are discovering the company and becoming shareholders. Others see it as a warning sign, arguing that institutions may be using retail demand as an opportunity to exit.
The data gave us a chance to test both ideas.
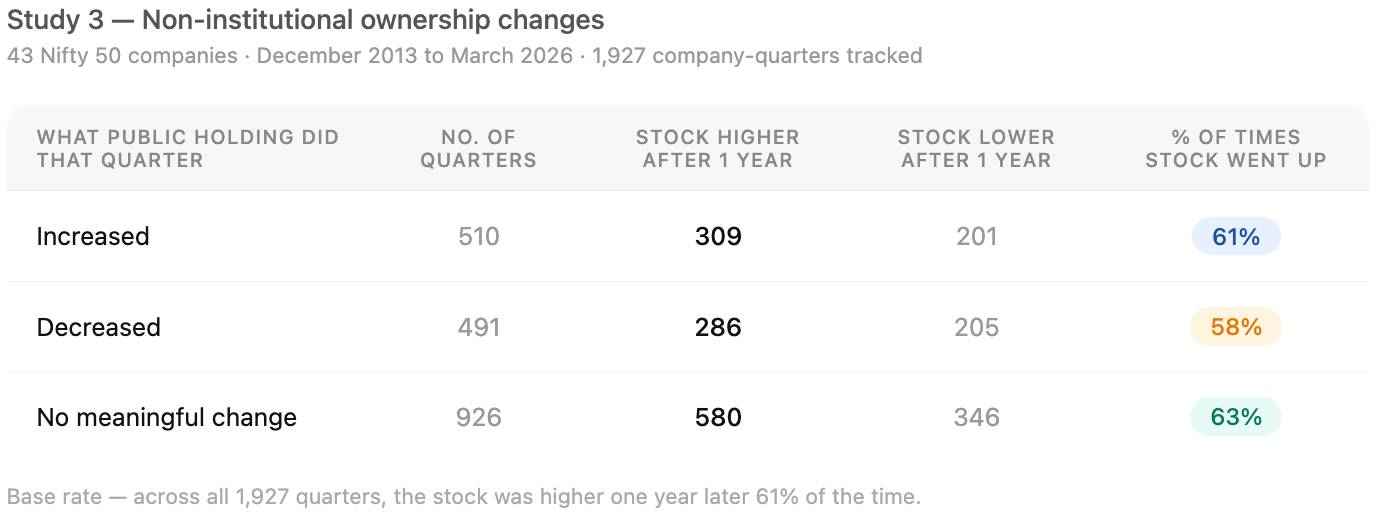
When non-institutional ownership increased, stocks were higher a year later 61% of the time (309 out of 510 cases).
When non-institutional ownership decreased, stocks were higher 58% of the time (286 out of 491 cases).
When ownership barely changed, stocks were higher 63% of the time (580 out of 926 cases).
61%. 58%. 63%.
Three numbers that are almost identical to each other.
Rising public ownership or falling public ownership or even ownership staying largely unchanged did not tell us much.
No matter what was happening in the shareholding pattern, stocks still ended up higher roughly six times out of ten.
Study 4:
When the trend kept going
The first three studies looked at ownership changes over just one quarter. But ownership often changes gradually. Institutions may keep selling for several quarters, or promoters may slowly increase or reduce their stake over time.
So instead of looking at one-quarter changes, we looked at ownership trends that continued for multiple quarters.
The idea is that if a change lasts for several quarters, it may be more meaningful than a one-time move. We then checked how often these stocks were higher one year later.
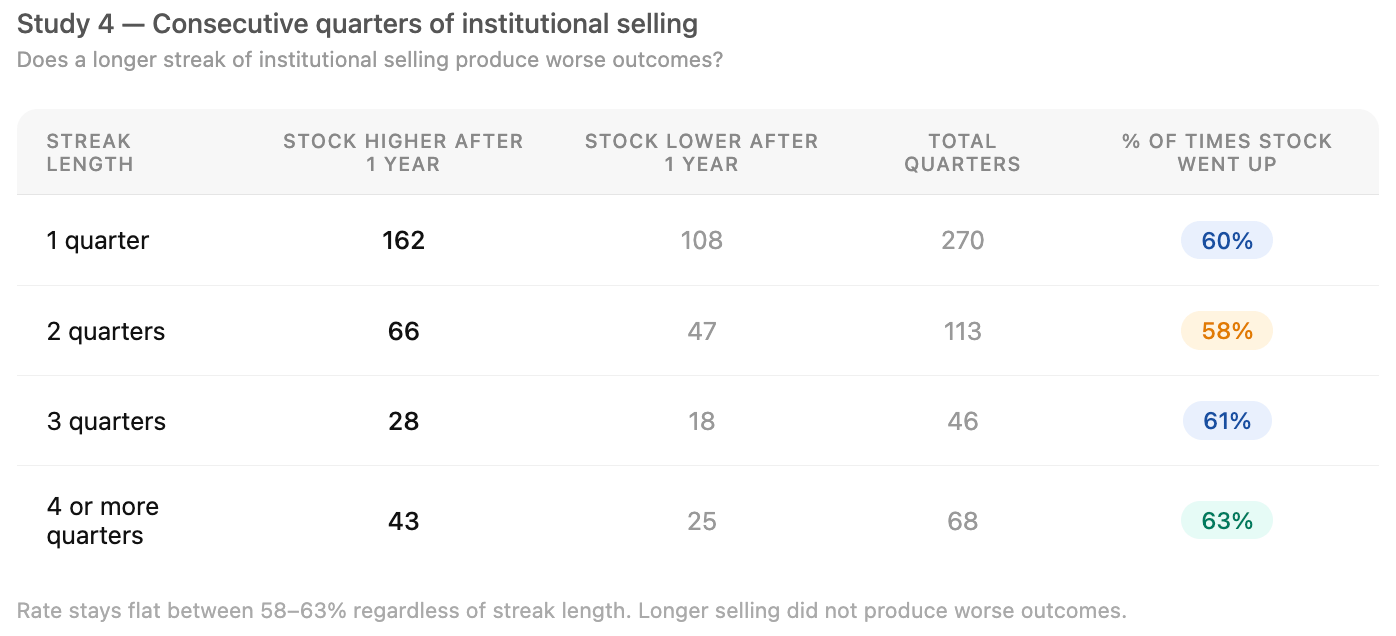
What stands out is how similar the results are. Whether institutions sold for one quarter or several quarters in a row, the chance of the stock being higher a year later stayed close to 60%.
If sustained institutional selling was a strong negative signal, you would expect longer selling streaks to lead to worse outcomes. But the data does not show that.
We saw a similar pattern with non-institutional ownership.
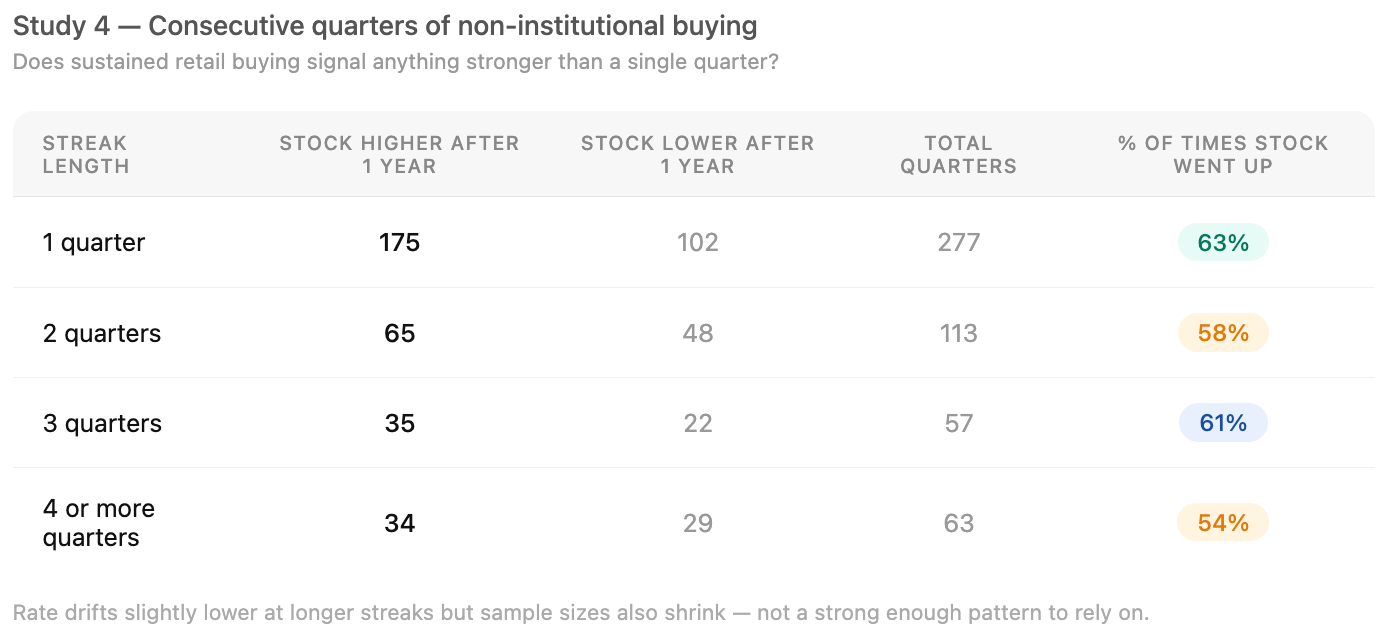
At first, this seems more promising because the hit rate falls as the ownership streak gets longer. But the decline is small and inconsistent. As the streak length increases, the number of observations also becomes smaller, making the results less reliable.
Promoter ownership showed a similar story. There were too few long streaks to draw strong conclusions, but longer trends did not appear to be any more useful than shorter ones.
This was one of the biggest surprises of the study. If ownership trends contained a strong signal, it should have shown up here. Instead, the results stayed remarkably similar across all groups. Whether ownership changed for one quarter or four, and whether it involved institutions, promoters, or non-institutional investors, the chances of the stock being higher a year later remained broadly the same.
Note:
We only used quarterly shareholding data, so we can see promoter ownership only four times a year. Any buying or selling within the quarter is not captured.
The analysis looks only at one-year stock performance. Results could be different over shorter or longer time periods.
Changes below 0.25% were excluded to remove noise. Some genuine promoter activity may therefore be missing from the dataset.
All promoter ownership changes were treated equally. A 0.3% increase was counted the same as a 12% increase.
Shareholding data shows what changed, not why it changed. Promoter selling can happen for many reasons, but all selling was grouped together in the analysis.
The study covers only 43 large-cap Nifty 50 companies. The results may not apply to mid-cap and small-cap companies.
The analysis is good however instead of treating the increase or decrease in the shareholding as well as the resultant stock price changes as binary event, can we actually include the change itself. This may give a different picture.
Good analysis