

A share is not a lottery ticket. It’s a small piece of a real business.
This was the big idea behind a book that was widely called as ‘The Bible of Investing’.
Written by two professors at Columbia University, Benjamin Graham and David Dodd, in 1934, called Security Analysis that shaped how generations of investors think about the stock market.
Graham believed that in the short run, the stock market acts like a voting machine, and in the long run, like a weighing machine.
Sounds familiar?
You might have heard it from one of Graham’s students, Warren Buffett, who studied under him at Columbia in 1950.
One of the world’s most successful investors, Buffett built his fortune by patiently buying undervalued businesses.
He popularised Graham’s idea by quoting it in a letter to Berkshire Hathaway shareholders.
But what did Graham mean when he compared markets to a voting machine and a weighing machine?
Simply put, a voting machine measures opinions.
In the stock market, investors react to headlines, rumours, fear, excitement and what everyone else seems to be doing. A stock can rise or fall simply because the mood changed.
In the long run, however, Graham believed markets measure what something is actually worth, like a weighing machine.
A weighing machine doesn’t care about opinions. For a company, the weight is what it earns, year after year.
The voting can go on for a long time. But Graham believed the weighing machine eventually has the final say.
Quarterly results are one of the most closely watched events in the market. Most investors assume that better earnings will push a stock higher.
But is that really true? Do strong quarterly results really move a stock? And if they don’t in the short run, does the weighing machine catch up later?
We decided to test this.
The Study
We analysed the quarterly results for the current constituents of the Nifty 50 from the June quarter in 2016 to March 2026 quarter.
This gave us the results of 50 companies across 40 quarters, which is 2,000 quarterly results overall.
In each quarter, we measured the year-on-year profit growth. Now, a 20% profit jump during a time when the economy is booming is normal. A 20% jump during a crisis like Covid is exceptional.
So we ranked the companies against each other in each quarter and put them into three baskets.
Strong: the top 1/3rd by profit growth that quarter or the highest profit growth
Middle: the middle third
Weak: the bottom third or the weakest profit growth
We compared each stock’s return with the Nifty 50’s return during the results season, to see whether the market rewarded stronger results.
The season starts on the last trading day of the quarter and ends on the first trading day after SEBI’s deadline for declaring results: 45 days after the quarter ends, or 60 days for the March quarter.
By then, every company’s numbers are public. We used the longer deadlines SEBI allowed during COVID in 2020 and 2021.
Some quarterly results had to be left out: where we did not have data for that quarter, where the company was not yet listed, or where a merger or demerger made the year-on-year comparison meaningless.
We also left out quarters where the company had zero or negative profit a year earlier, since percentage growth cannot be calculated from that base.
We were then left with 1,525 quarterly results to study if strong profits actually lead to strong stock returns.
Study 1
The companies in the strong basket beat Nifty 50, 54% of the time. The median profit growth of this group was 62%. And the weak basket also managed to beat Nifty 50 returns 43% of the time.
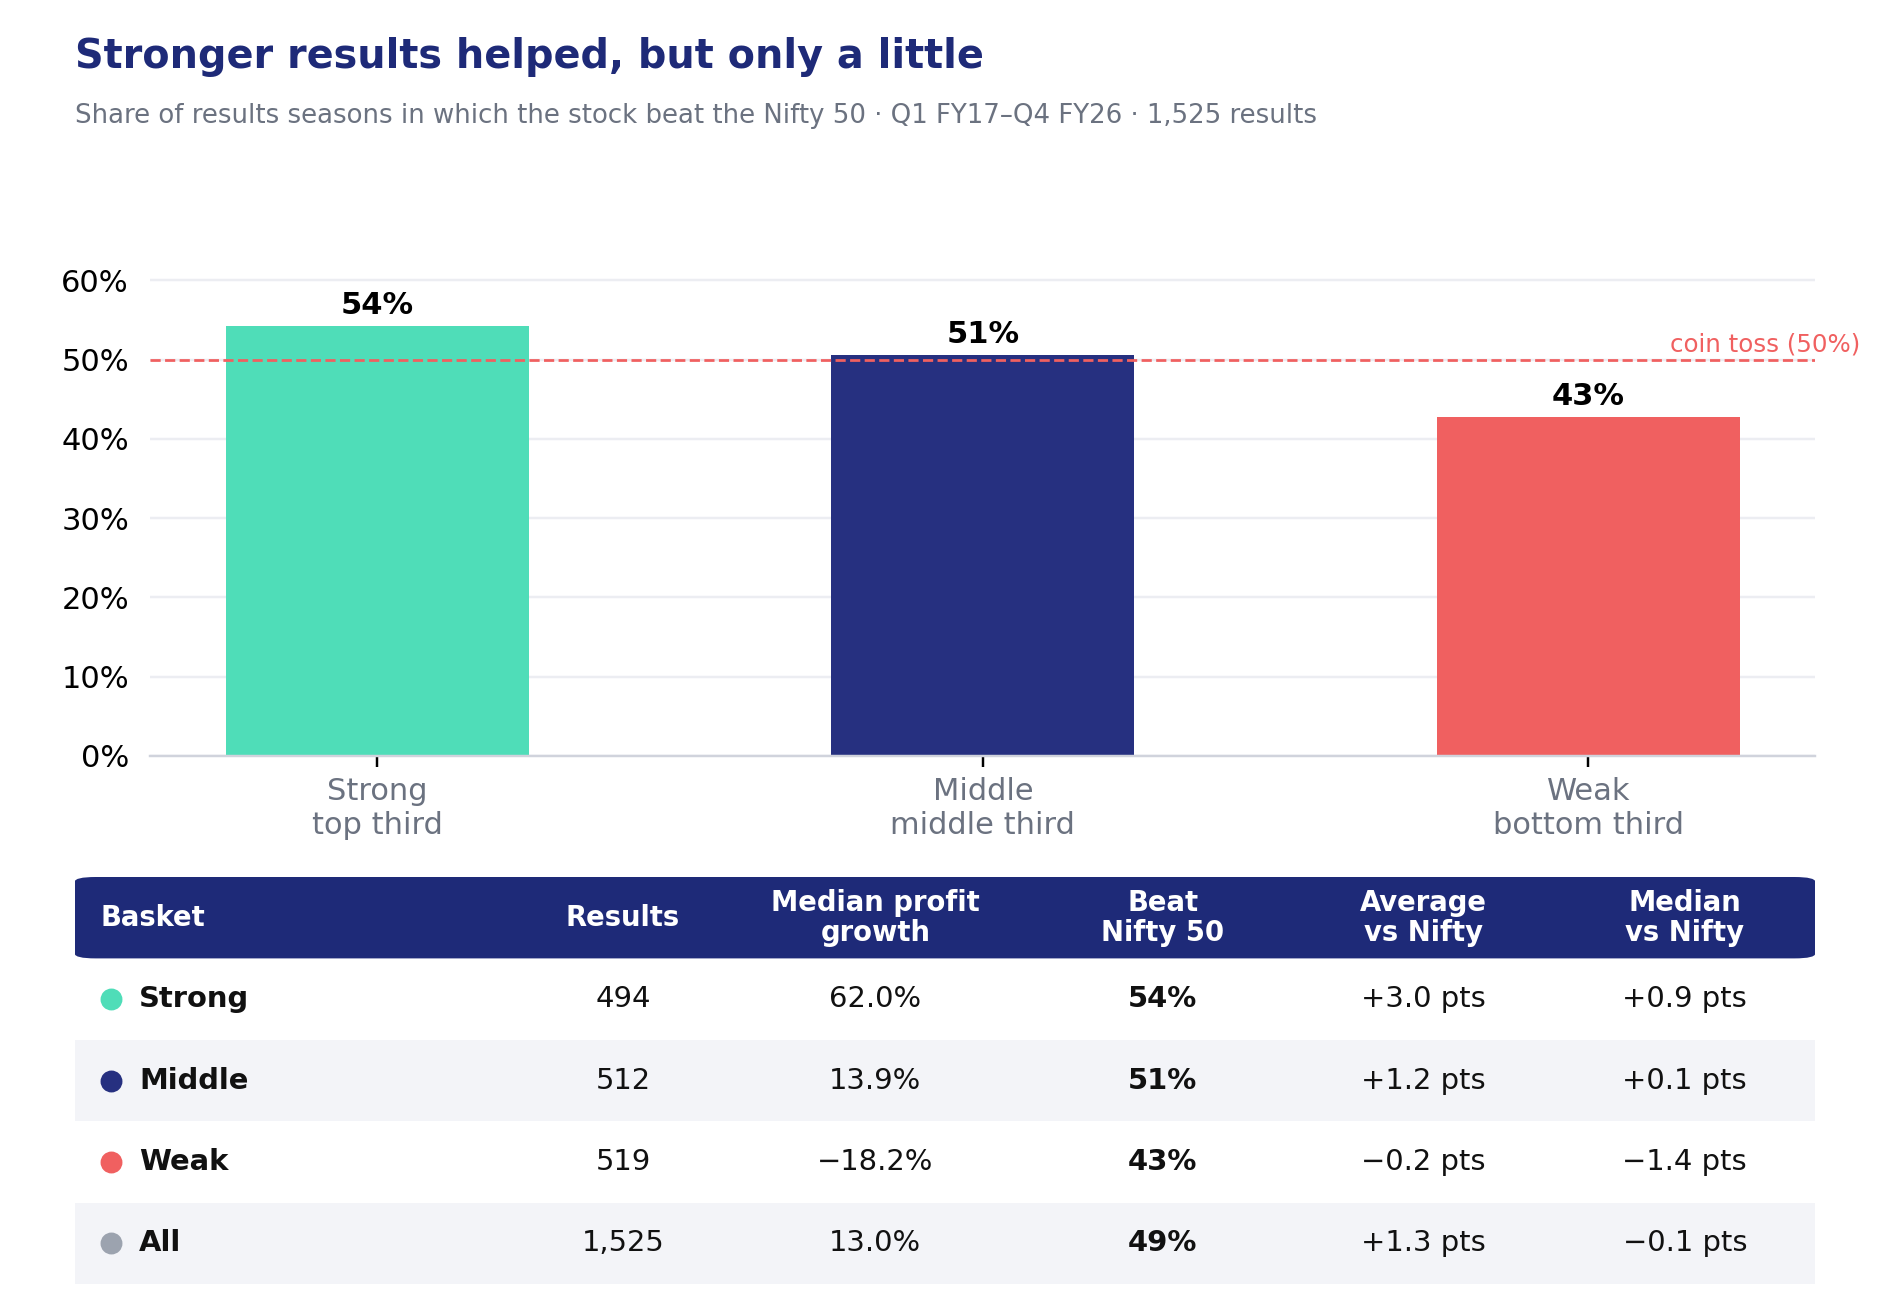
So stronger results did lead to better returns.
But the advantage is much smaller than most investors expect. Buying a stock simply because it announced strong earnings does not guarantee it will beat the market.
Despite the 11 percentage point gap, even the best companies lost to the index almost half the time.
On average, a Strong stock beat the Nifty by 3.0% over the season, while a Weak stock trailed it by 0.2%.
The typical (median) Strong stock beat the Nifty by only about 0.9%, while the typical Weak stock trailed it by 1.4%.
Stocks in the Strong basket still trailed the Nifty 50 in about 46% of the 494 strong quarters.
This holds true for weak quarters as well.
In 43% of the weak quarters, the stock beat the market anyway. In 75 of those cases, it beat the market by more than 10 points.
Hindalco was one of the extreme cases where profits grew massively.
In the March 2022 quarter (Q4 FY22), Hindalco’s profit grew 98.4% from a year earlier. A massive profit like that should be celebrated by investors right? But that is not what happened.
Yet over that results season, from 31 March to 31 May 2022, the stock fell almost 26%. Nifty 50 also fell 5% during this period.
But why?
Two things weighed on the stock. Its US subsidiary Novelis reported a 15% year-on-year fall in adjusted EBITDA for the quarter, citing higher operating costs.
And global aluminium prices were falling: Hindalco cut its domestic prices several times from late April 2022 as prices on the London Metal Exchange slid.
Any, or all of these could have led to the fall in the stock despite a spectacular result on paper.
Tata Steel represents the other end of the extreme.
The company’s profits fell sharply by 60% in Q2FY21 compared to the same period a year ago. With profits down by more than half, one would expect the stock to fall sharply as well.
In reality, the shares jumped 45% over the results season and beat the Nifty 50 by almost 31 percentage points.
This was because the damage was already done. Most investors expected bad earnings due to the impact of Covid. But they were seeing signs of recovery.
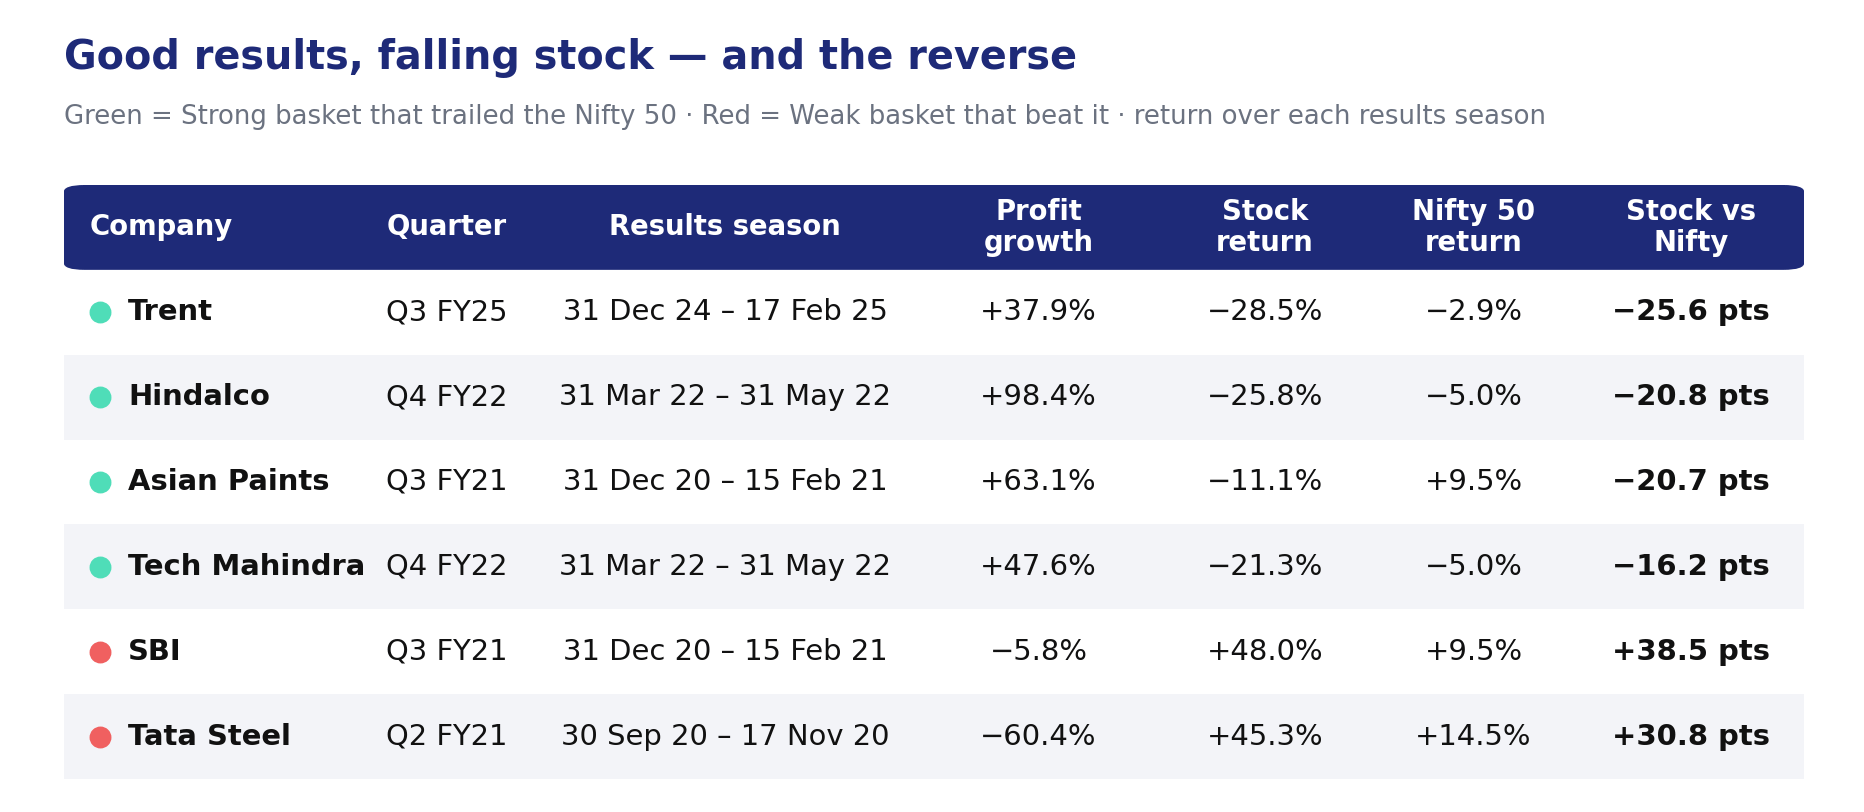
The table above shows a few more cases like these, from Trent to SBI.
The market was not ignoring the results in these exceptional cases. But typically, stock prices react to multiple factors at the same time.
Markets are forward looking. This means that by the time a company declares its earnings, analyst estimates, peer results etc have already given investors an indication of the company’s expected result. This gets factored into the stock price.
The valuation of the stock, market conditions and where its sector is in the cycle also matter.
The pattern of stronger earnings slightly outperforming weaker earnings held true in 9 out of the 10 financial years in our study. There was one exception, the Covid year.
In FY21, the pattern reversed: stocks in the Weak basket beat the Nifty slightly more often than the Strong ones (58% vs 55% of the time).
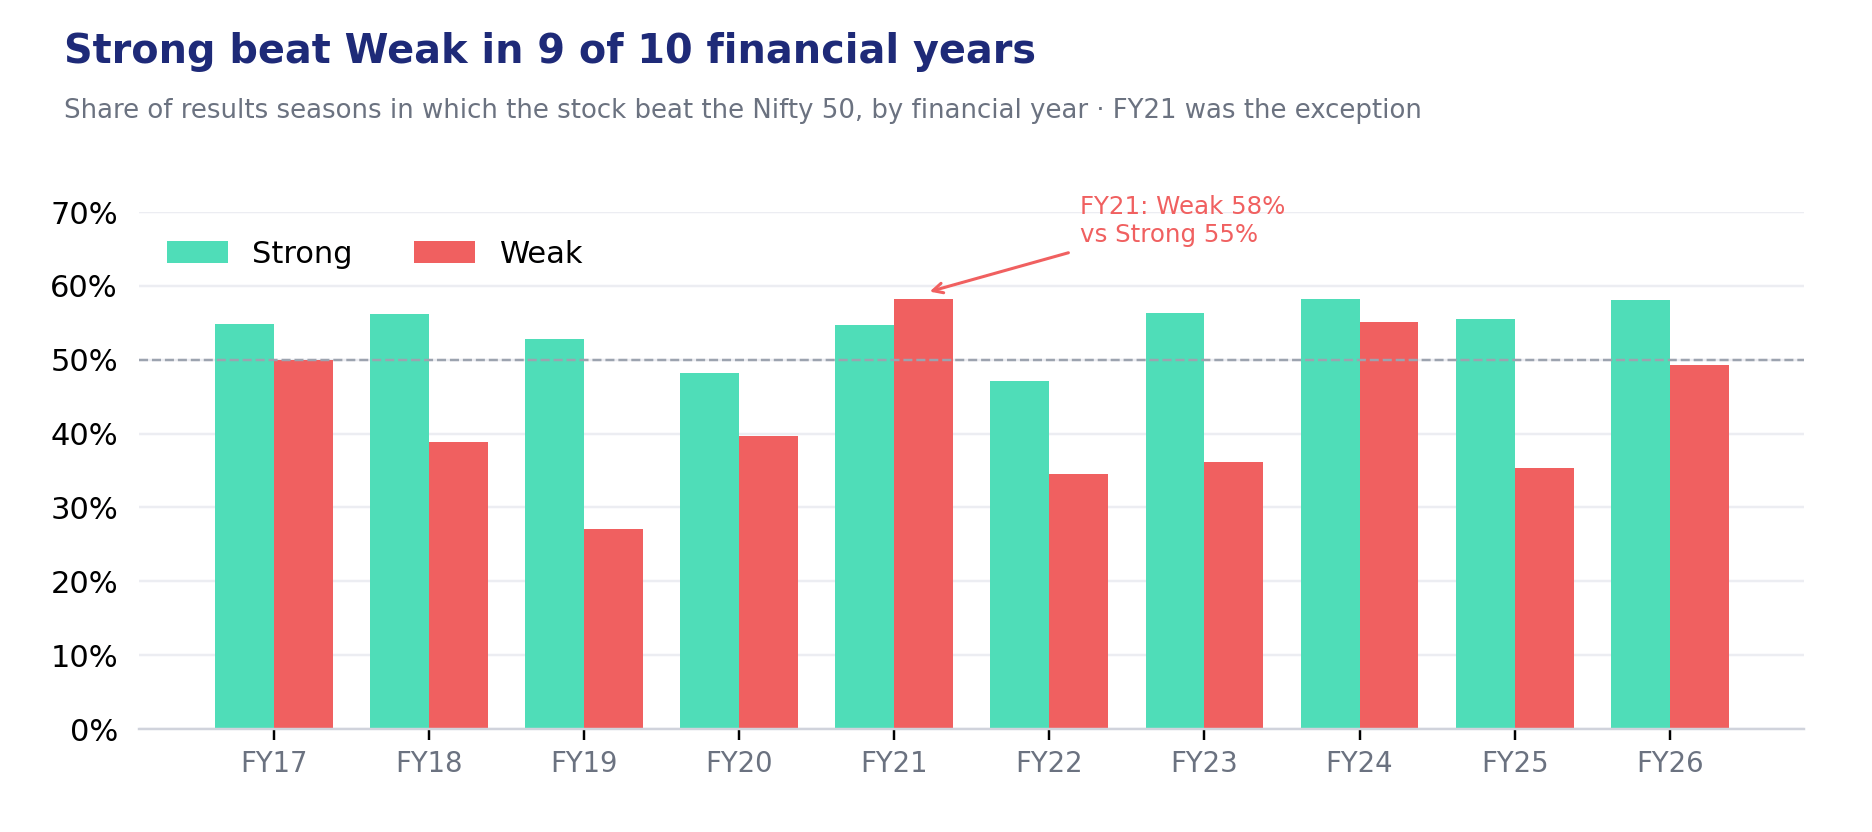
That is because the market had fallen significantly during Covid. So when conditions improved even a little, hopes of a recovery led to big gains in the stocks that had been hit hardest.
But if many factors play a role, shouldn’t earnings play a bigger role? How much of a stock price movement do earnings explain?
How much do the results explain?
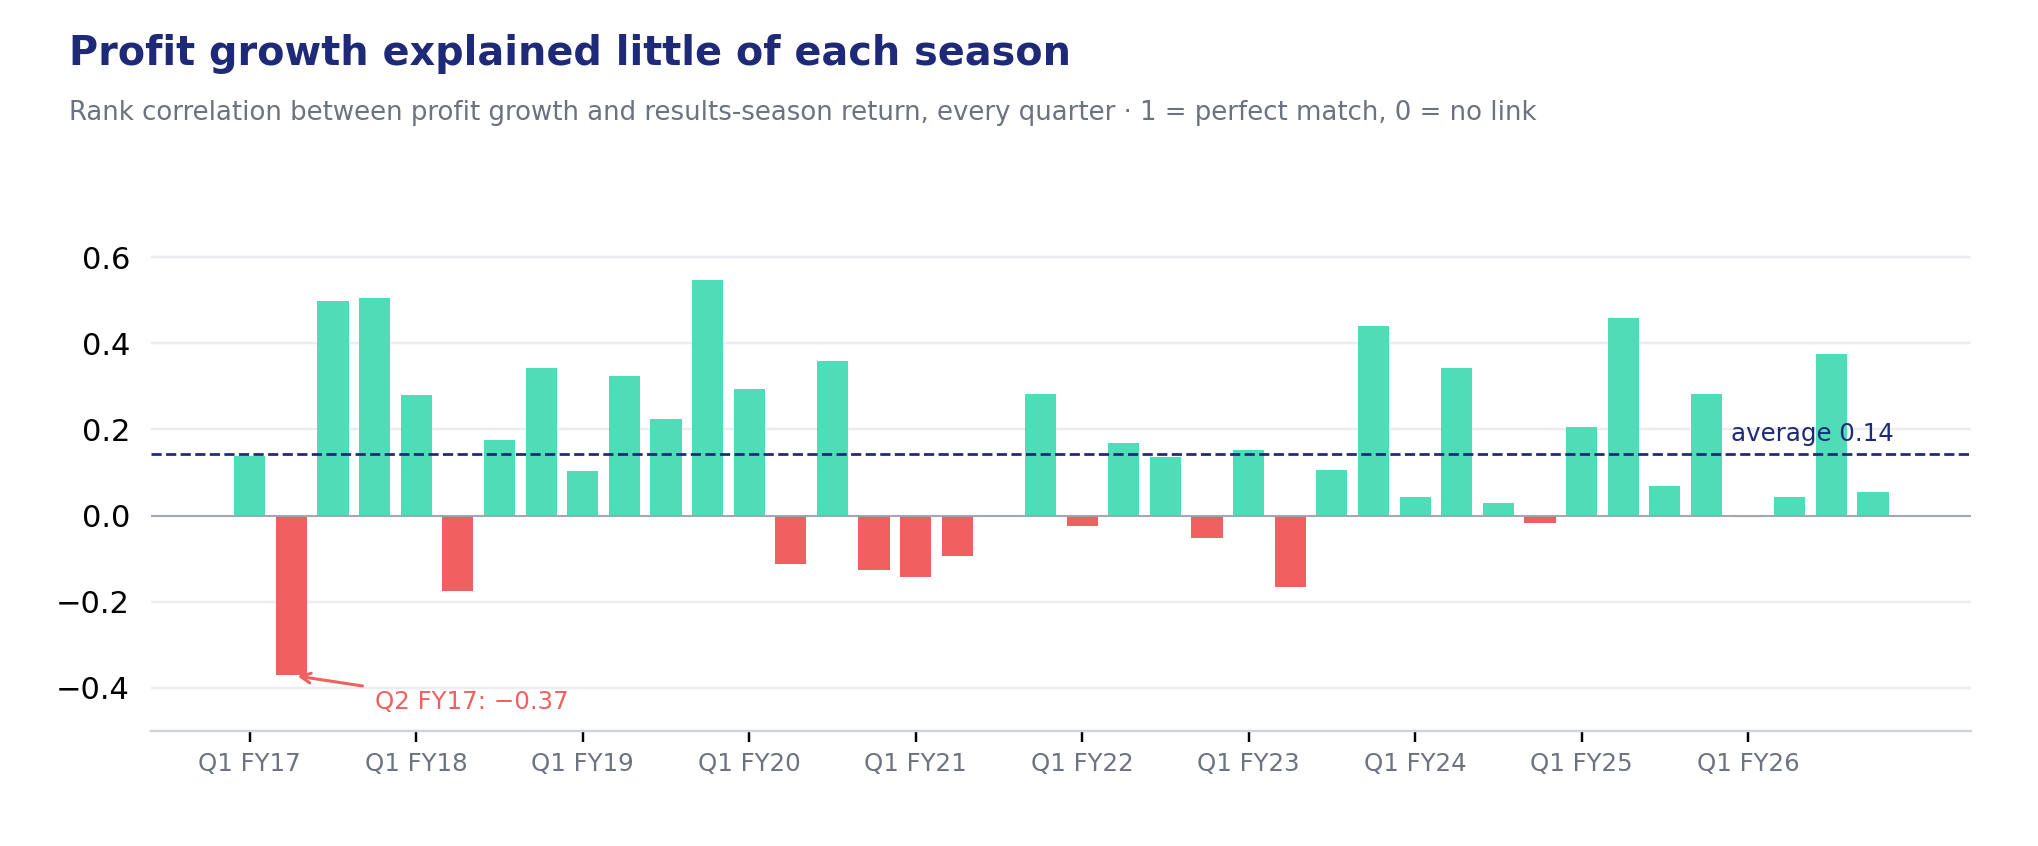
To quantify this, we looked at every single quarter to check if the companies with the fastest profit growth were actually the same ones whose stocks outperformed, and then used rank correlation instead of averages.
A correlation of 1 means the company with the highest profit growth had the best-performing stock, the second-highest had the second-best, and so on.
If the correlation is 0 that means there is no link between the profits and the stock performance. A correlation of −1 means they move in opposite directions.
In 29 out of 40 quarters, faster profit growth went hand-in-hand with better stock performance. But the average correlation across all 40 quarters was just 0.14, only slightly above zero. The link is weak.
Put simply, in a typical results season, profit growth explained only about 7% of why some stocks did better than others.
The remaining 93% came from other factors, and from things our study cannot see, like what investors were expecting.
This can be from management’s guidance for the next year, changes in debt levels, valuations, market expectations, etc. On an economy level, RBI interest rate decisions, GDP among other factors can also play a role.
Interestingly, in some other quarters, the correlation between profits and stock performance also flipped completely.
In the September 2016 quarter, the correlation between profit growth and share-price performance was −0.37.
Only 24 companies could be ranked that quarter, so a single reading like this can swing a lot.
That seems odd right? Why would the market reward the worst performers in September 2016?
That results season ran from 30 September to 15 November 2016. On 8 November, the government announced demonetisation. A shock of that size moved stocks for reasons that had little to do with the September-quarter numbers.
But this is the story of a single quarter, which is a shorter period of time. Over a span of just three months, a stock is highly vulnerable to daily noise, rumors, and fleeting sentiment.
How do stocks react to earnings over a longer period of time?
The Long Game
To assess the long term relationship between profits and stock performance, we looked at how the stock performed over a period of one, three, five and seven year windows. Then, we compared this to the change in Earnings Per Share (EPS).
We added the EPS for the last four consecutive quarters to calculate the earnings on Trailing Twelve Months (TTM) basis. This weeds out any extremes due to seasonality. For example, a company that sells air conditioners will do well in the June quarter as the sales go up during summer months.
Now, we compared this long term EPS growth against the change in the company’s share price over those exact same multi-year windows.
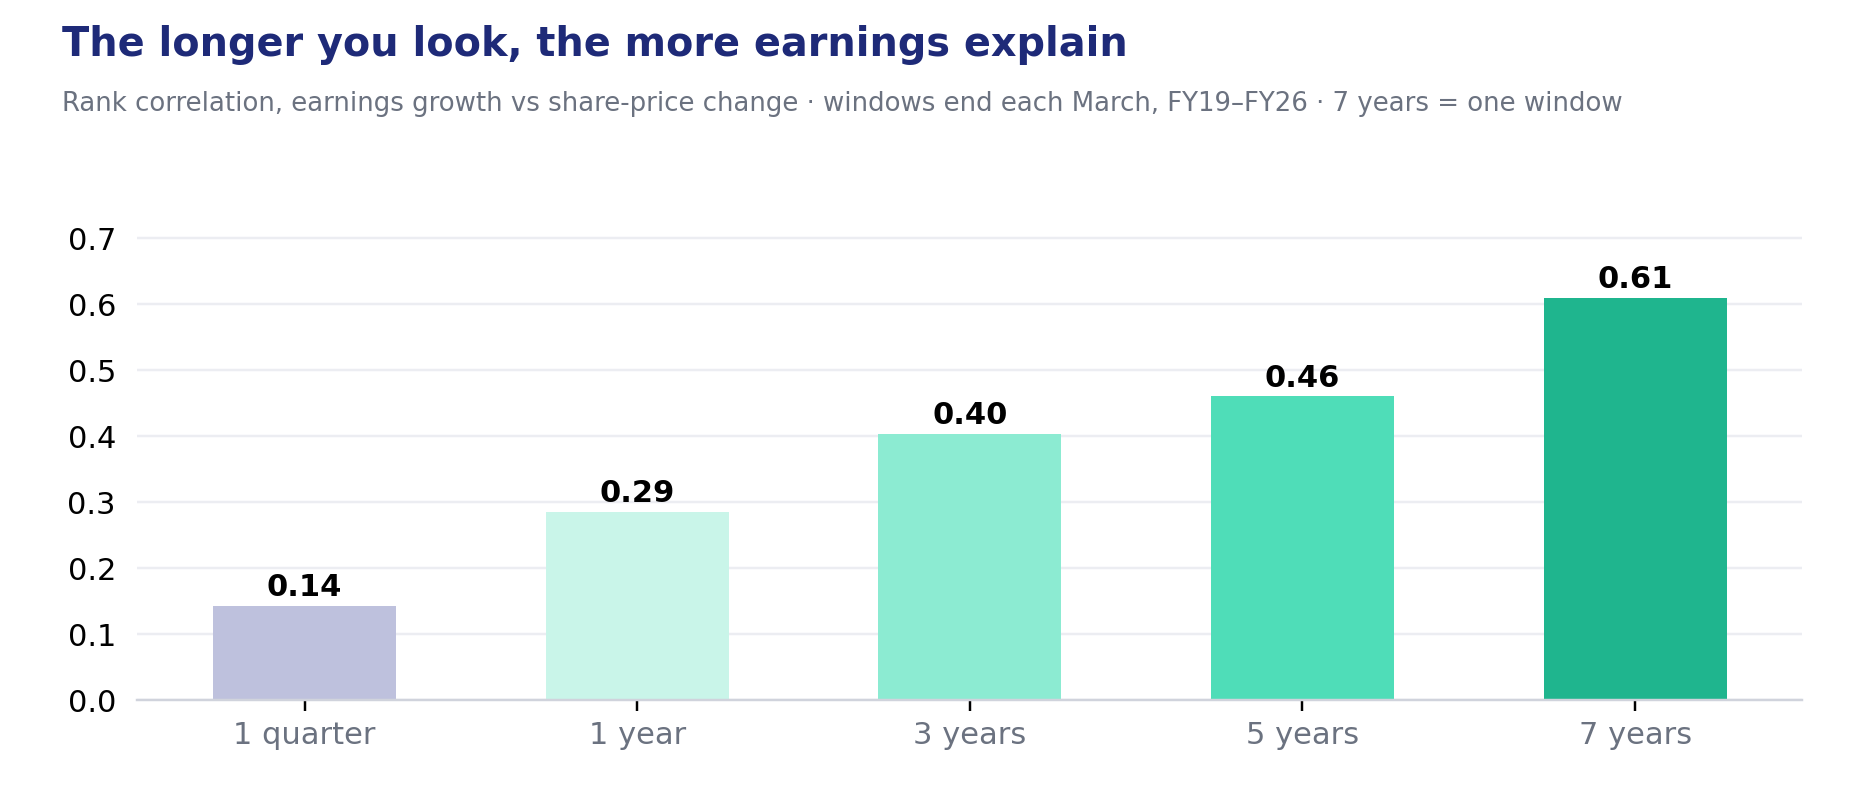
The results were starkly clear. The longer the timeframe, the stronger the relation between profitability and its stock price.
In one year, the correlation was 0.29. For three and five years, the correlation was stronger. Over three years it grew to 0.40 and by five years it rose to 0.46.
For context, over a single results season the correlation between profit growth and stock performance was just 0.14.
In a short period of time, such as a quarter, stock prices react a lot to news. News can be geopolitical or about the industry that the company operates in.
A company can report phenomenal earnings but if the market sentiment is reacting to a geopolitical conflict, the chances of the stocks falling are higher.
Over a slightly longer period of time, this hype or panic tends to fade away. Suppose the stock of a company has moved higher in anticipation of good results.
But the company fails to deliver profits. Then over the next couple of quarters, investors may lose patience and end up selling the stock. The reverse can also happen.
Over an extremely long period of 7 years, the correlation stood at 0.61 for our study. This is based on a single seven-year window, March 2019 to March 2026, covering 39 companies.
If a company has consistently delivered a good set of profits, it is more likely to be rewarded by the market as the fundamentals of the company take over.
Over the long run, the Nifty 50 companies whose earnings grew the most were largely the ones whose stocks rose the most.
A stock can rise because the company posted strong results. But it can also move up, if investors are more optimistic on the stock and its expected earnings. This is why when we talk about earnings, it is almost always with valuations.
EPS measures earnings, and the price-to-earnings (P/E) ratio measures valuation. The P/E ratio shows what investors are willing to pay for each rupee of those earnings.
We wanted to test if the stock gained because of real earnings or by a change in the mood (signaled by the P/E ratio).
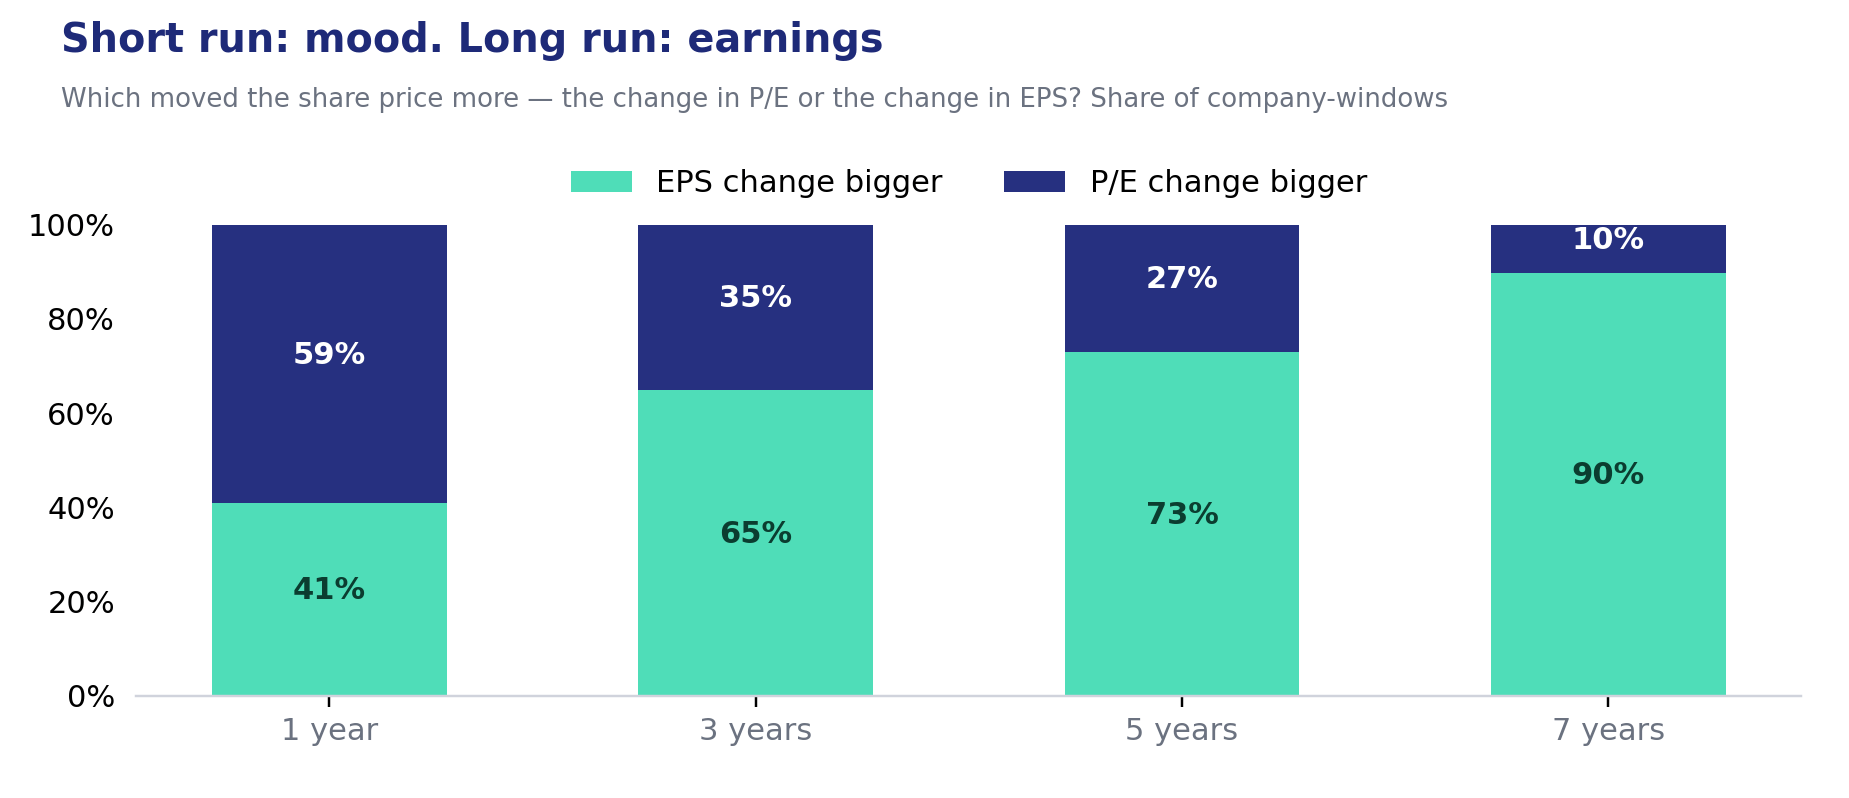
A shift in the valuation had a bigger impact on stock prices in the short term, compared to earnings. Over one year, the change in P/E moved the share price more than the change in EPS in 59% of cases. Earnings were the bigger driver in only 41%.
But this turns around over longer time horizons.
Over three years, EPS was the bigger driver in 65% of cases. Over seven years, it was the bigger driver in 90%.
So if earnings are the drivers in the long term, then buying only stocks with strong quarterly results should be the best investment strategy right?
Only the best
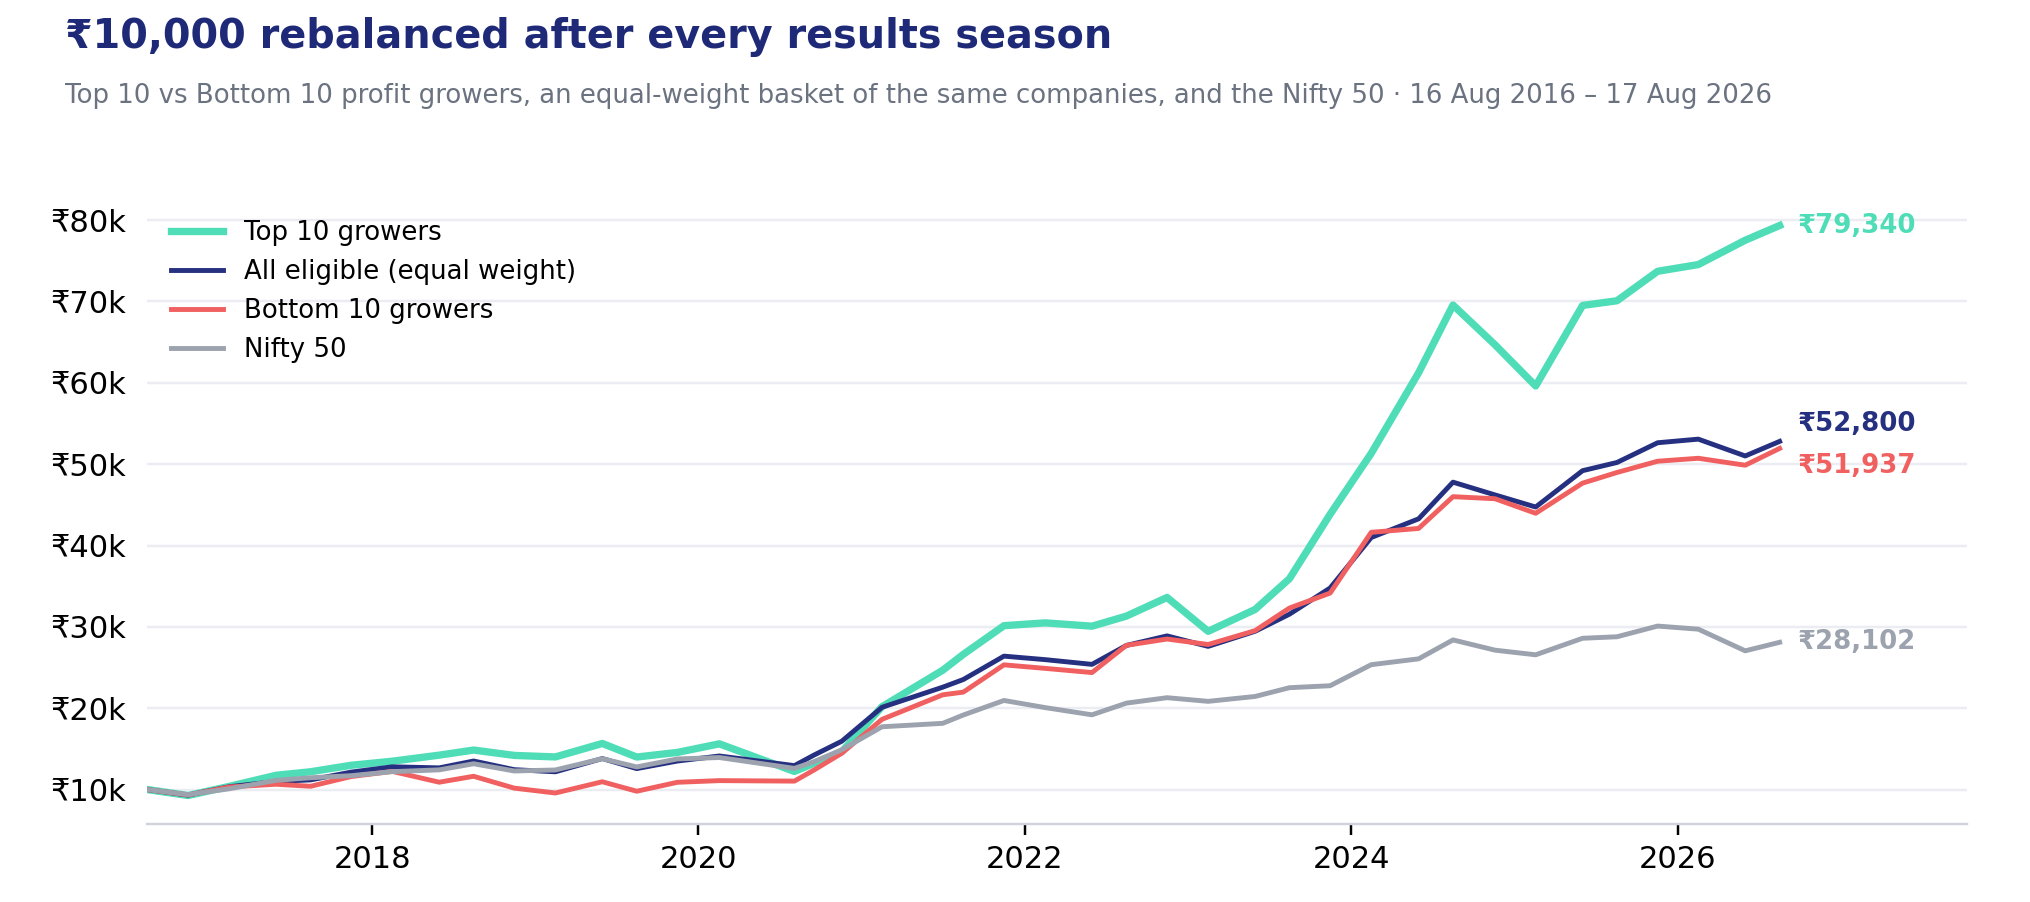
We assumed you only bought the 10 Nifty 50 companies with the fastest year-on-year profit growth, and held them until the next results season. Then repeat the process every quarter.
To check whether it was actually a good strategy, we compared it with three alternatives:
The Bottom 10 growers: Buying the companies with the worst profit growth.
All eligible companies: Buying a plain, equal-weight basket of all the stocks available in the study.
The Nifty 50: Buying the standard market index.
We ran a simulation of this exact strategy 40 times, spanning a ten-year period from August 2016 to August 2026 with an initial investment of Rs 10,000.
On the surface this looks like an attractive strategy.
If you had put Rs 10,000 in the Top 10 strategy, it would have fetched returns worth almost Rs 80,000 (Rs 79,340) at 23.0% CAGR. The Nifty 50 grew at 10.9% a year over the same period, turning Rs 10,000 into Rs 28,102.
However, it is important to note that the study tests the current composition of the Nifty 50. This means it leaves out companies that were in the Nifty 50 at some point since 2016 but later fell out of the index.
So the companies in our study were the ones that survived and grew enough to be in the top tier of the Indian stock market in 2026.
To make a fair comparison, we looked at the Top 10 strategy against an equal-weight basket of the exact same companies.
Since both carry the same bias, the gap between them is what matters. All eligible companies at equal weight returned 18.1%
The Top 10 strategy still had an edge of 4.9 percentage points.
When we dug deeper, the edge seemed to be on shaky ground.
The Top 10 strategy beat the equal-weight basket in only 23 of the 40 periods.
Most of the outperformance came between mid-2023 and mid-2024, so it was not consistent. It also did better in rising markets: when the Nifty rose, the Top 10 beat the basket in 18 of 29 periods, but when the Nifty fell, it did so in only 5 of 11.

That was not all.
The Top 10 strategy also turned out to be a riskier and more volatile bet.
Its returns swung more from quarter to quarter: a typical swing of 10.7%, against 7.6% for the basket and 6.3% for the Nifty 50.
This strategy delivered the worst fall in the study at 21.7% (between 17 February and 3 August 2020, when Covid hit markets).
Another point to add here is that the study does not include the real world costs of running this strategy.
Rebalancing a portfolio of 10 stocks four times a year means paying brokerage, Securities Transaction Tax (STT) and slippage (the gap between bid and ask prices) on every trade, plus short-term capital gains tax on profits (15% until July 2024, 20% since).
This can easily eat into the 4.9 percentage point edge.
In other words, that 4.9 percentage point edge exists before costs and taxes.
But how did the companies with the slowest profit growth fare?
This group still earned 17.9% a year, close to the 18.1% earned by the equal-weight basket. A weak quarterly result did not automatically condemn a stock over the following three months.
Conclusion
So, do quarterly results move share prices? Yes, but less than most investors think, and more the longer you wait.
Companies with the strongest profit growth beat the Nifty 50 in 54% of results seasons, against 43% for the weakest.
That is an edge, but a small one. In a typical season, profit growth explained only about 7% of how stocks ranked against each other. Expectations, guidance, valuations and the mood of the market did most of the work.
Stretch the horizon, and the picture changes. The link between earnings and share prices rose from 0.14 over a quarter to 0.61 over seven years.
Over a year, a change in valuation moved the price more than a change in earnings in 59% of cases. Over seven years, earnings were the bigger driver 90% of the time.
Chasing the best quarterly results did beat a basket of the same companies, by about 4.9 percentage points a year.
But it won in only 23 of 40 quarters, most of the gain came between mid-2023 and mid-2024, it suffered the deepest fall, and it ignores trading costs and taxes.
Earnings are not the only thing that moves a stock. In the short run, the market reacts to much more. In the long run, earnings are what it eventually follows.
So, Graham was right. In the short run, the market votes. In the long run, it weighs the earnings.
Limitations
Results season, not result day: we did not have each company’s announcement date, so each window also captures price moves before the results and other news during the season.
No analyst expectations: we compared each company’s profit growth with other Nifty 50 companies, not with what analysts expected. A “Strong” quarter could still have been a disappointment.
Gaps in history: ACE Equity data for 14 companies starts only in June 2018, Nestle India from September 2023, and SBI Life has no data. Quarters with missing data were excluded, not estimated. As a result, early quarters (FY17–FY19) compare 23–28 companies, against 32–49 later.
One-off items: the data does not separate exceptional items, so some profit jumps may include one-time gains or losses.
Survivorship bias: the study uses today’s Nifty 50 companies, which have all done well enough to be in the index now. This flatters absolute returns, especially in the backtest.
Corporate actions: quarters affected by the HDFC–HDFC Bank merger, the Shriram merger, and demergers at Reliance, ITC, Tata Motors, Grasim and Adani Enterprises were excluded where they broke the comparison.
Price returns only: stock returns exclude dividends, so all comparisons use the Nifty 50 price index. The backtest also ignores brokerage, taxes and slippage.
Long-horizon windows: the seven-year result comes from a single window (March 2019 to March 2026, 39 companies), and the five-year result from three windows.