

Did you know that the stocks in the Nifty 50 index carry different ‘weights’?
What does this exactly mean?
In a standard Nifty 50 Index Fund, your money is not divided equally among India’s 50 largest companies. Instead, each company receives a different allocation based on its free-float market capitalisation the number of shares available for trading in the market).
Simply put, the larger the company, the larger its weight in the index, and the more of your money gets invested in it.
For example, for every Rs 10,000 invested in a Nifty 50 Index Fund, roughly Rs 1,056 goes into HDFC Bank alone. Another Rs 832 goes into ICICI Bank, while Rs 827 goes into Reliance Industries.
Currently, the biggest 10 companies in the Nifty 50 account for nearly 50% of the entire index!
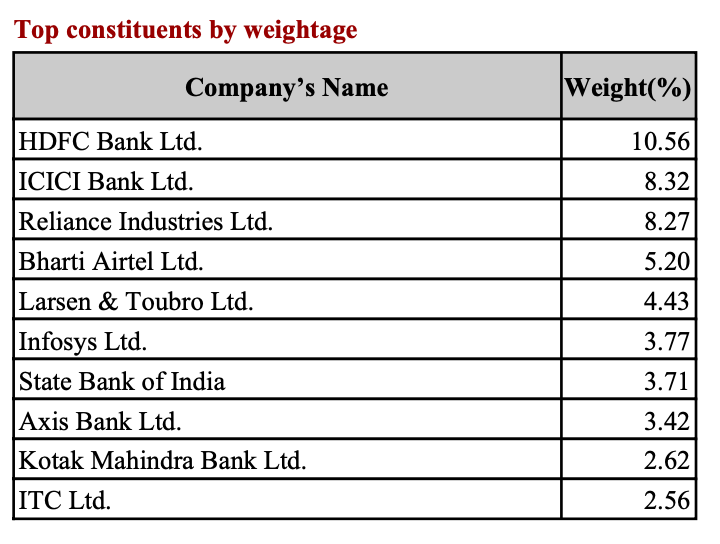
Source: NSE
This raises an interesting question. What if every company in the Nifty 50 received the same allocation? Would the returns differ?
We decided to test it out.
The Experiment
To test this idea, we compared Nifty 50 Index Funds with Nifty 50 Equal Weight Index Funds from the same fund house.
While the Nifty 50 Index assigns weights based on market capitalization, the Equal Weight Index gives every stock an equal weight of 2%.
The Nifty 50 Equal Weight Index was introduced by the NSE in 2017. Because of that, mutual funds tracking this index are relatively new, with most launched around 2020.
This is why the comparison period is shorter than our previous experiments.
To ensure a fair comparison, we only compared funds within the same AMC. This removes differences arising from fund management practices and allows us to focus purely on the impact of the underlying index methodology.
The fund pairs selected for the analysis were:
HDFC Nifty 50 Index Fund vs HDFC Nifty 50 Equal Weight Index Fund (Aug 2021 to June 2026)
DSP Nifty 50 Index Fund vs DSP Nifty 50 Equal Weight Index Fund (Feb 2019 to June 2026)
ABSL Nifty 50 Index Fund vs ABSL Nifty 50 Equal Weight index Fund (June 2021 to June 2026)
We assumed a simple SIP strategy for comparison: an investor puts Rs 10,000 every month into both the Nifty 50 Index Fund and the Nifty 50 Equal Weight Index Fund. The performance is tracked from the start date of each Equal Weight fund (or the point at which both choices became available to invest in) up to 1 June 2026.
This was done across all three fund house pairs and tracked how the investments grew over time during the respective comparison periods.
Results
Here is what the data showed:
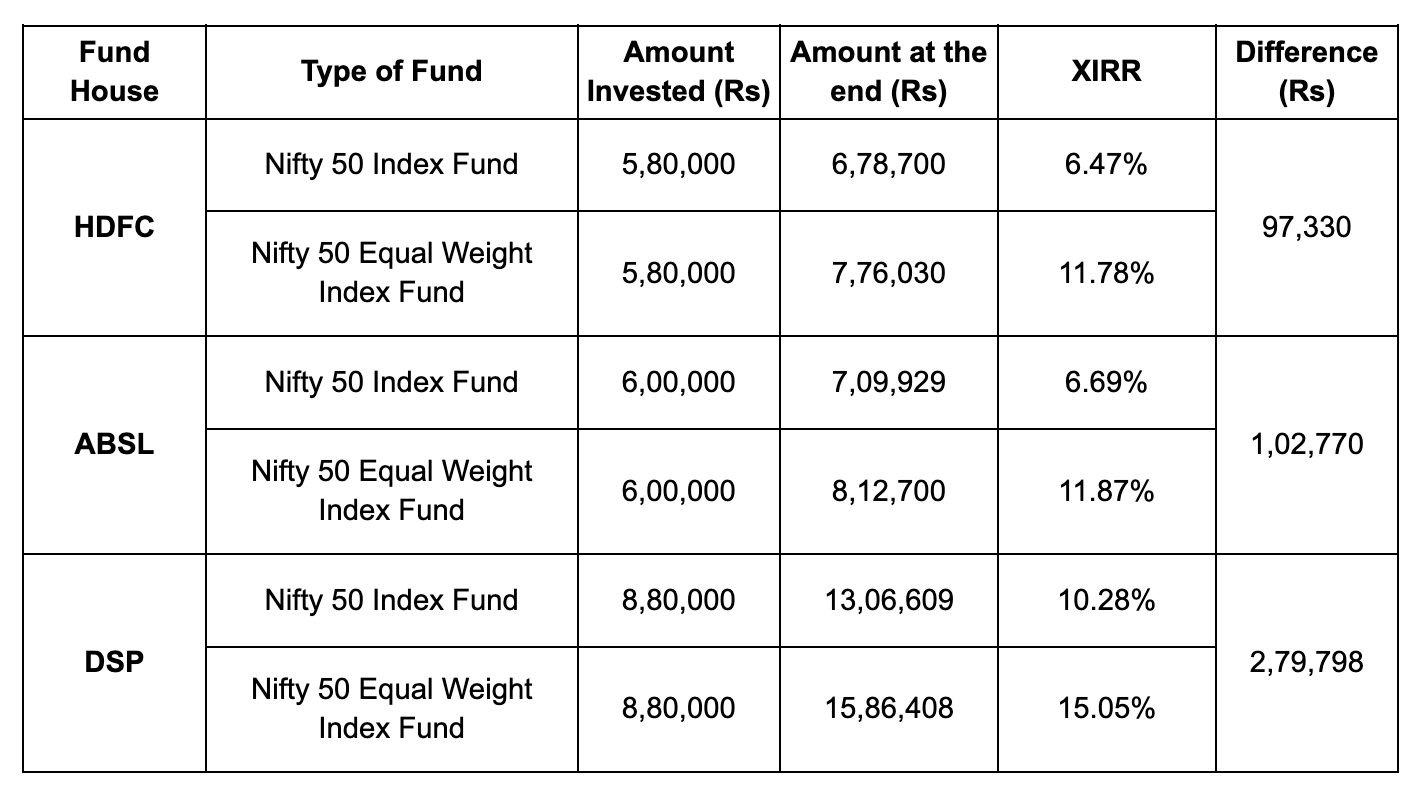
The equal weight index significantly outperformed the standard market-cap index across all three AMCs.
Why did this happen?
Why did this happen?
The answer lies in how both indices behave.
A Nifty 50 Index Fund is driven heavily by a small set of large companies. When these companies perform well, the index rises quickly. But when a few of them underperform, their large weight drags the overall returns.
An Equal Weight Index works differently. Every company contributes equally to performance. This means gains are not concentrated in a few stocks but spread across all 50 companies.
In simple terms, the Equal Weight strategy reduces dependence on a handful of giants and increases exposure to mid-sized companies within the index, many of which go through stronger growth phases over time.
However, this may also come with trade-offs. Equal weight indices may have higher volatility because smaller large-cap stocks are generally more volatile than mega-caps.
Equal weight index also involves more frequent rebalancing, which increases turnover. And importantly, performance is cyclical. This means equal weight does better when the broader market participates, but can underperform when a few large caps drive most of the returns.
Conclusion
The experiment shows that even when the underlying stocks are the same, the way an index is constructed can meaningfully change returns over time.
A Nifty 50 Index Fund is driven by a few large companies, which makes it more concentrated and dependent on their performance. A Nifty 50 Equal Weight Fund, on the other hand, spreads exposure evenly across all 50 stocks, allowing broader participation to play a bigger role in returns.
Neither approach is universally better. Each performs differently depending on market cycles. Sometimes concentration may help, and sometimes diversification within the index works in its favor.
Your investing outcomes are shaped not just by what you own, but also by how those holdings are weighted.
Limitations of the Experiment
The analysis is based on a specific time period, which may not reflect how the indices perform across full market cycles. Different phases of the market can lead to very different outcomes.
The period studied was relatively short in equity terms. Long-term performance patterns can change when tested over multiple decades and varying economic conditions.
Real-world costs such as fund expenses, rebalancing impact, tracking error, and transaction costs are not fully captured in the simplified comparison.
Past performance in this experiment should not be treated as an indicator of future returns.
It will best way to do the lumsum in volatile market with equal weight index fund.