

Paul the Octopus.
That was the name of an octopus living in an aquarium in Germany.
And he wasn’t just any ordinary octopus.
He became a global celebrity during the 2010 FIFA World Cup.
But why?
Well, Paul was known for predicting the winners of football matches.
Before each match, his keepers would place two transparent boxes inside his tank. Both boxes contained food, but each had the flag of one of the countries playing the match.
Whichever box Paul opened first was considered his prediction for the winner.
Now, an octopus predicting football matches sounds ridiculous.
But something interesting happened.
Paul correctly predicted the winners of all eight matches he was asked to predict during the 2010 World Cup.
It was statistically astonishing because the probability of that happening is just 1 in 256 times.
This led to people believing that Paul had predictive powers.
His predictions became so popular that when he picked Spain to beat Germany in the semi-final, some angry German fans called for him to be eaten.
Spain’s Prime Minister even joked about sending protection for him.
But there was something people paid less attention to.
Paul had also predicted the outcomes of Germany’s matches during the 2008 European Championship.
Back then, he got only four out of six predictions right.
He incorrectly predicted that Germany would beat Croatia and later that Germany would defeat Spain in the final.
Yet, his eight correct predictions in 2010 were enough to make him a global celebrity.
This tells us something interesting about how we think.
When we see a pattern working repeatedly, we tend to believe there’s a reason behind it, even when it could simply be luck.
And we often remember the times a prediction worked while paying less attention to the times it failed.
Something similar happens in the stock market.
Over the years, investors have developed several beliefs about when it is a good time to buy or sell shares.
Some believe that buying shares during Muhurat Trading on Diwali brings good fortune.
Others follow sayings such as Sell in May and Go Away, As January Goes, So Goes the Year, or the Santa Claus Rally.
These beliefs have survived for years, partly because there have been times when they worked.
But how often have these beliefs failed? And more importantly, would investors have earned better returns by following them?
With Diwali just around the corner and the special Muhurat Trading session coming up, we thought this would be a good time to find out.
So we picked four popular stock market beliefs and tested how well they worked in the Indian market between 2015 and 2025.
We looked at how often each belief worked and compared the returns with what investors would have earned
The Study
We picked four popular proverbs in the stock market and analysed if they held true across 2015 to 2025.
For every proverb, we asked three questions:
What would an investor following it have done?
How often did it work?
How did it compare with a normal period of the same length, chosen at random?
The third question matters most. A rule that “works” 8 times out of 10 means little if the market goes up 8 times out of 10 anyway.
For this, we used daily closing data from NSE Indices for the Nifty 50, the Nifty 50 Total Return Index (which includes dividends), the Nifty 500, the Nifty Midcap 150, the Nifty Smallcap 250 and the Nifty Auto.
Gold prices are the BSE spot price in Mumbai, in rupees per 10 grams. We also used monthly FPI equity flows from NSDL.
Study 1: Muhurat Trading
Investors believe that purchasing stocks and gold during the Diwali is auspicious and guarantees good luck and strong returns.
The stock market has a special one-hour session every year on Diwali called ‘Muhurat Trading’ that many investors look forward to.
So we decided to track the investments made in stocks and in gold during this festive window, from Diwali 2015 to Diwali 2024 to see if this belief actually holds water. We used Diwali 2015 to 2024 so that every Diwali in the study has a full year of returns after it.
The Muhurat Hour is actually positive.
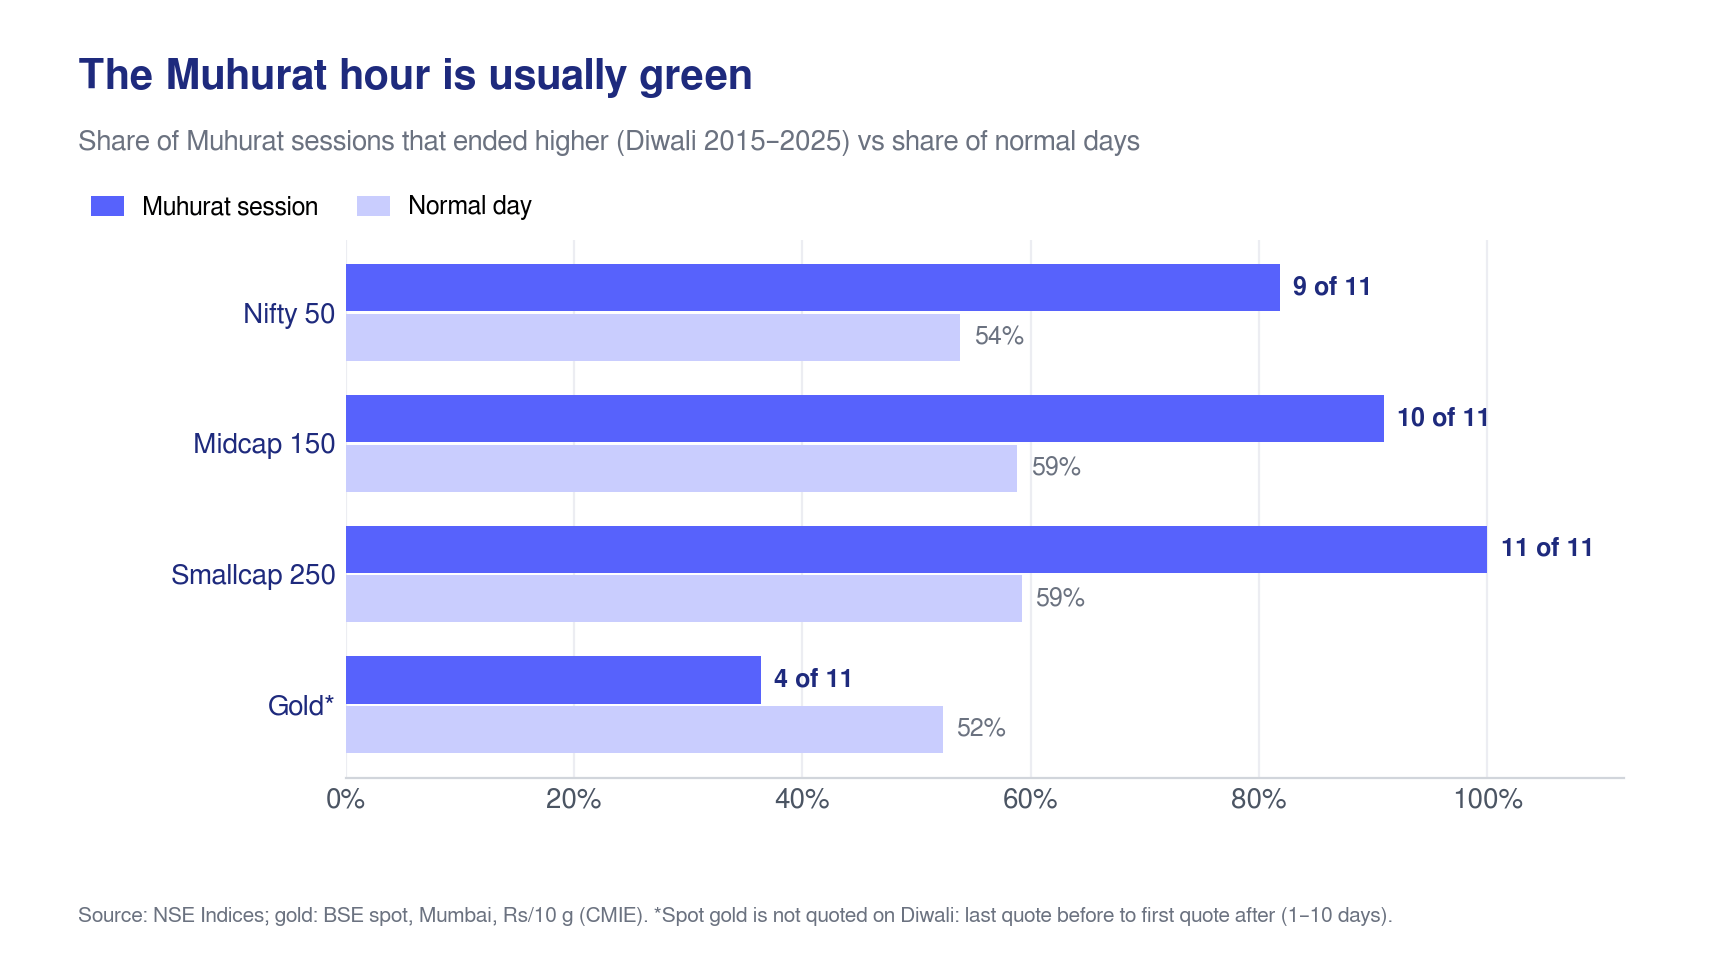
Nifty 50 has ended in green for 8 out of 10 years, a normal day is only 54% positive. The average move in these 10 years was 0.36%.
The broader market showed a lot more investor optimism. The Nifty Midcap 150 rose on 9 out of 10 occasions, and the Nifty Smallcap 250 was up on all 10 instances.
For gold, measured from the last spot price before Diwali to the first one after it (spot gold isn’t quoted on Diwali), prices rose in only 4 of 10 years, with an average move of just 0.04%.
The gap between those two prices ranged from 1 to 10 days, so this is a rough check rather than a like-for-like comparison with the one-hour session.
This shows us why this belief is popular. But the gains tend to fade over time.
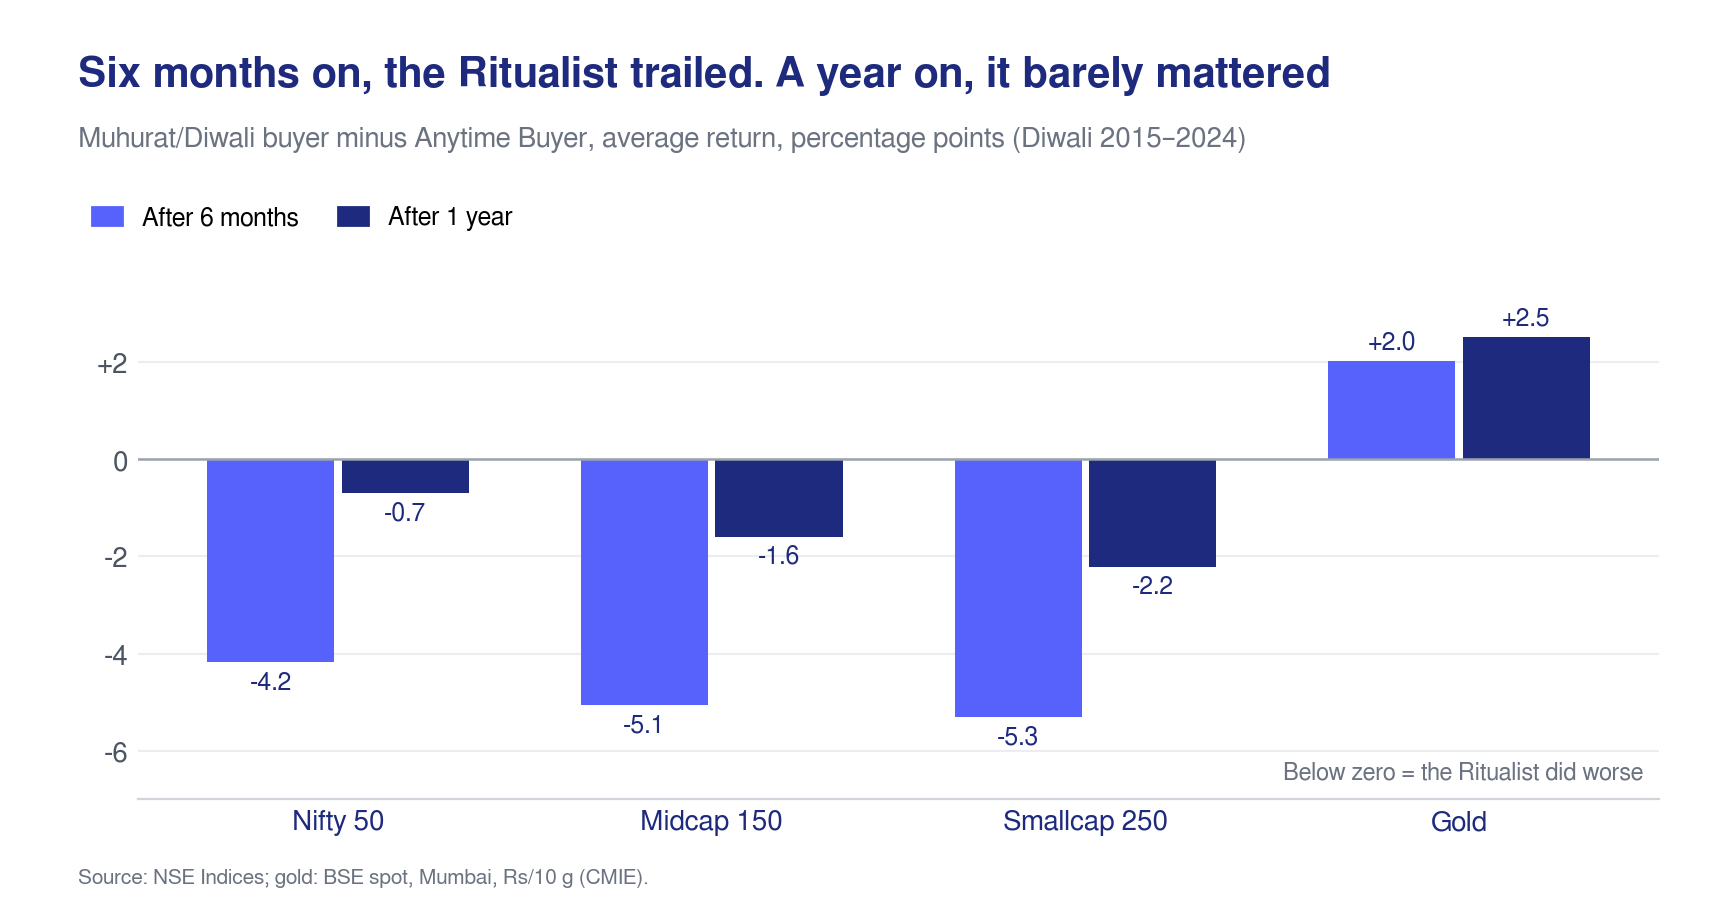
When we compared someone who buys exactly on Muhurat trading day (Ritualist) to another investor who bought on a random day, the results were different.
The random buyer made slightly more money over six months to a year.
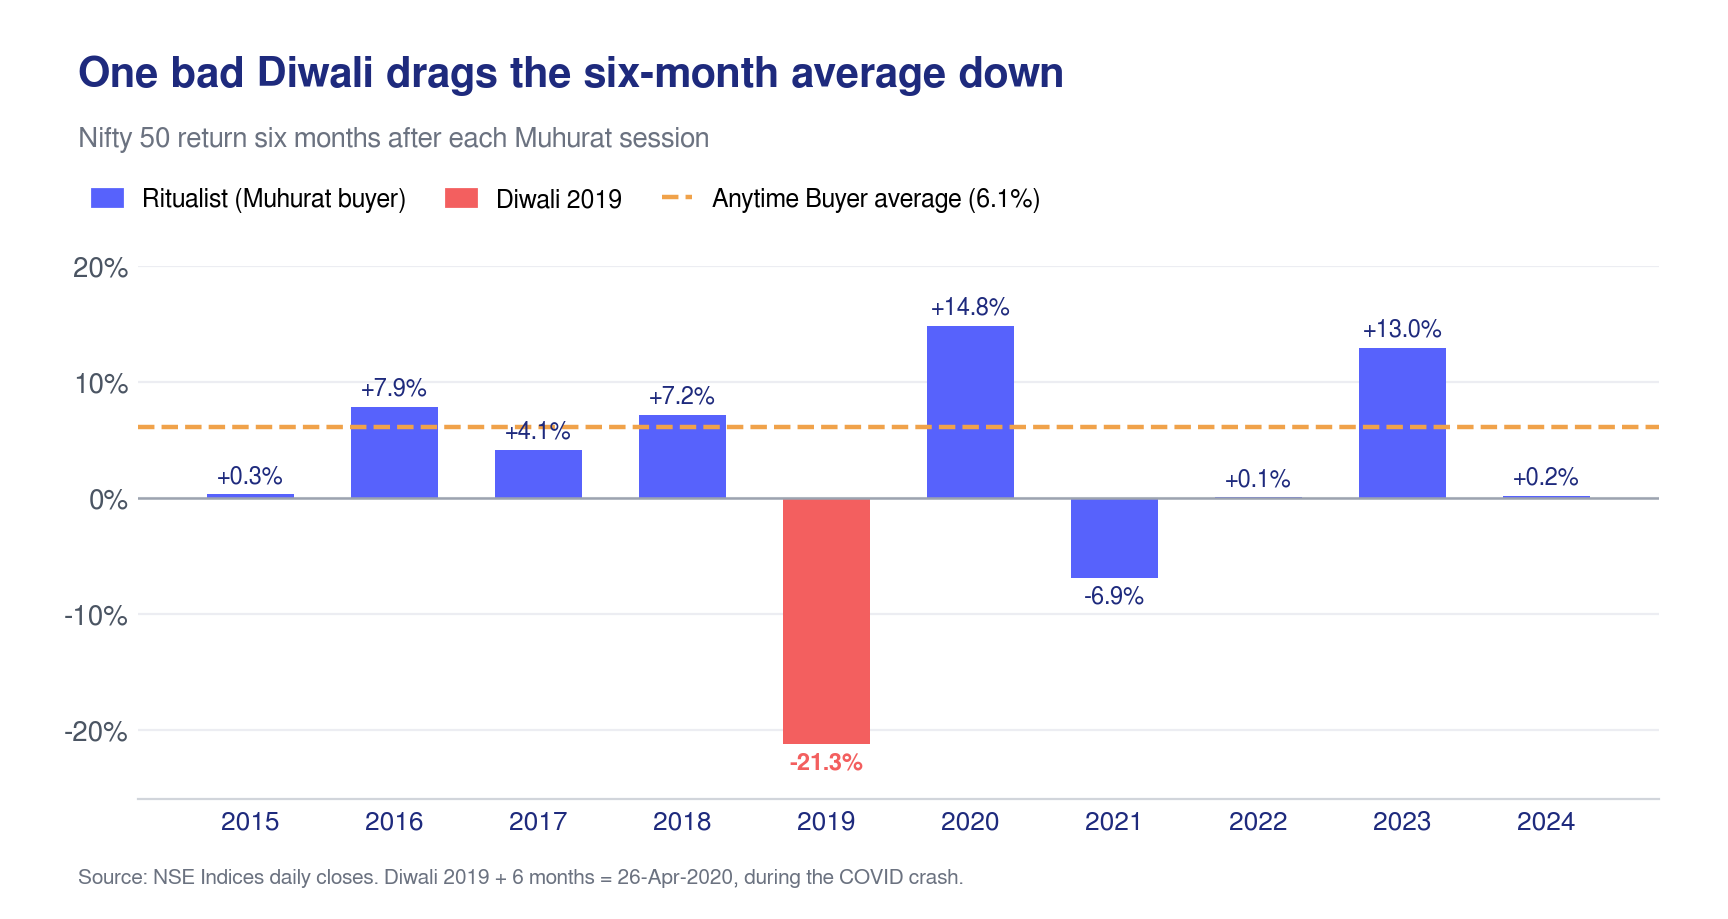
6 months in, Muhurat buyers earned 1.94% on average from Nifty 50, and 3.92% and 3.09% from midcap and smallcap indices. However, a random buyer made 6.12% from Nifty 50 itself.
This means the Muhurat buyer made one-third to half of what an average day buyer earned, six months after Diwali.
A year later, the gap between their returns reduced but the random buyer still had an edge.
Over a year, Gold beat Nifty 50 returns in 8 out of 10 years while the Nifty 50 outperformed the bullion only twice, in 2016 and 2020.
There are also other factors to consider like the market mood. An investor who bought smallcaps during Diwali 2017 saw their portfolio fall 22.5% a year later.
This could be due to multiple factors like the stretched valuations after that rally, a few regulatory changes like SEBI’s mutual fund recategorisation, return of long term capital gains tax in 2018, a weakening rupee and rising crude oil and the IL&FS default in September 2018, which squeezed NBFC funding.
Someone who bought Nifty 50 in Diwali 2019 witnessed a sharp fall of 21% in the investment in just six months.
Valuations, earnings growth trajectory, the debt taken by companies and many other reasons also factor into stock prices. So while the belief holds for D-Day, it did not hold for the longer term.
Gold has no Muhurat-session price, so we track it from the last price before Diwali.
For gold, we looked at the returns a month after Diwali trading for the short term. The results were not as shiny as the yellow metal.
Over six months to a year, gold bought around Diwali actually did slightly better than gold bought on a random day: 8.19% against 6.18% after six months, and 17.95% against 15.45% after a year. The first month was the weak spot.
8 out of 10 times, gold purchased around Diwali fell a month later with an average return of -1.25%. For context, during a normal month, gold rose about 56% of the time.
Auto stocks vs Festive Boost
Diwali is not just considered auspicious to invest in stocks and gold, but also to buy vehicles. Many people believe that the demand for cars and bikes will rise in this period, which will give a ‘festive boost’ to auto stocks.
According to the Federation of Automobile Dealers Associations’ (FADA) 42-day festive retail data, covering Navratri to 15 days after Dhanteras, festive vehicle sales have been rising:
In 2023: sales rose 19%, to 37.93 lakh vehicles from 31.95 lakh the year before
In 2024: registrations rose 11.76%, to 42,88,248 from 38,37,040
In 2025: sales rose 21%, to 52,38,401 from 43,25,632, with GST-led price cuts helping
(Note: The base figures get revised between releases,so year-on-year totals won’t chain exactly.)
This means auto stocks will outperform, right?
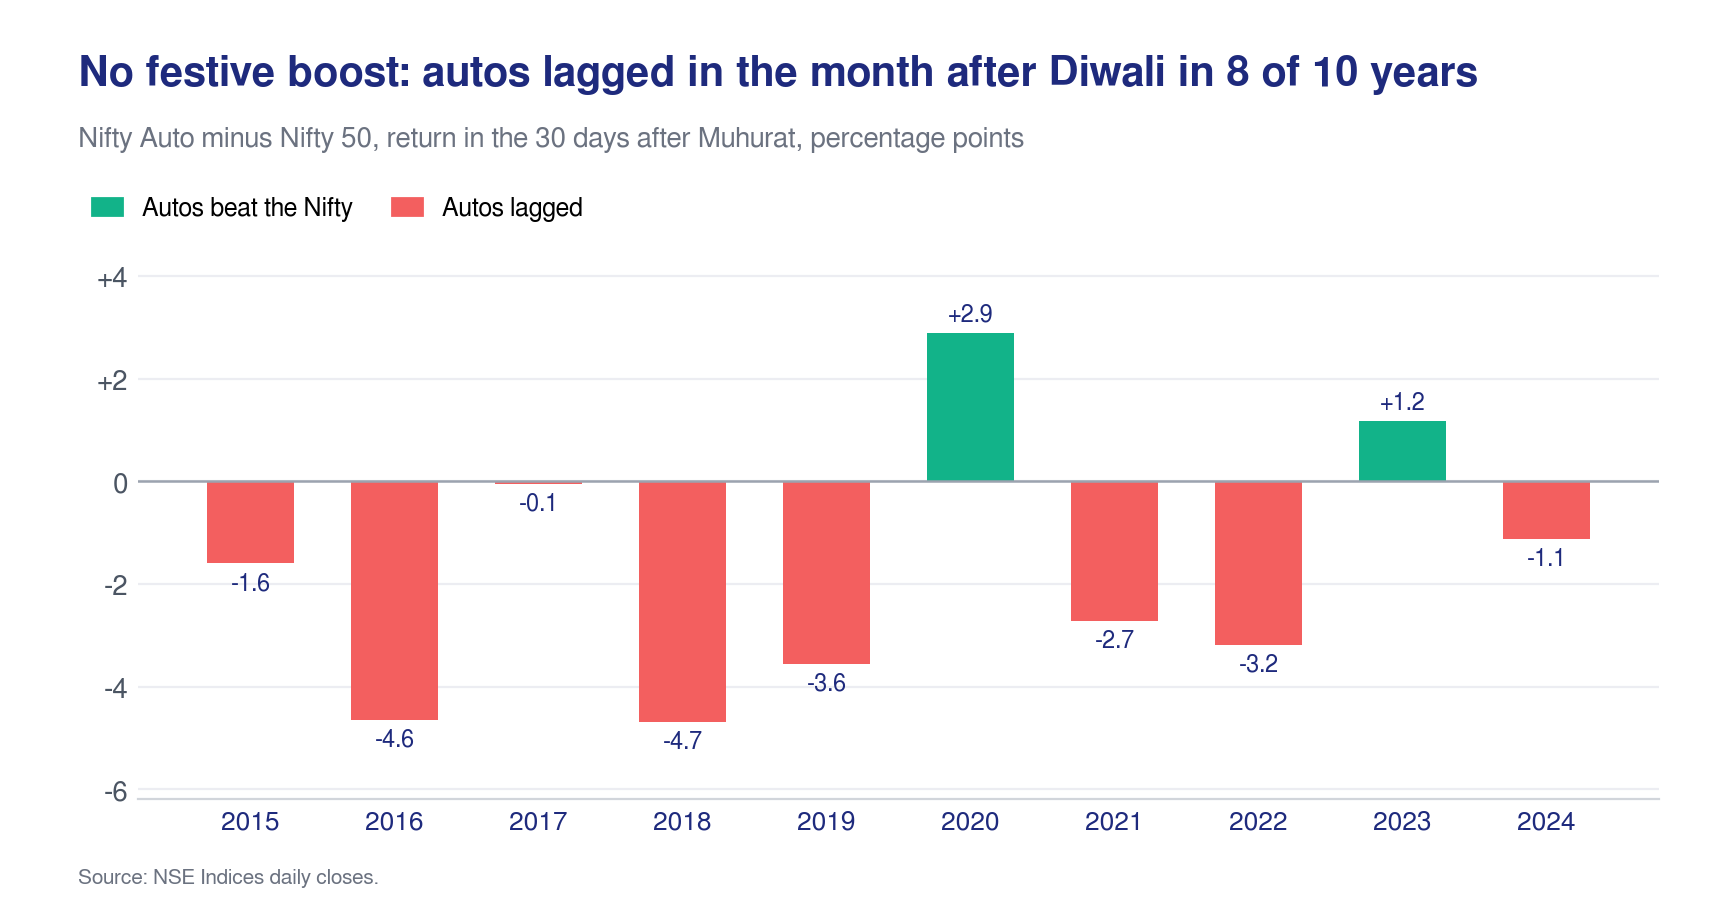
We studied the performance of the Nifty Auto index in the last decade from Diwali 2015 to Diwali 2024.
A month prior to Diwali, the Nifty Auto index beat Nifty 50, 6 out of 10 times. In a normal month, the index beat Nifty 50 52% of the time. So the edge was worth a coin toss.
Post Diwali, the auto index lagged the Nifty 50 in 8 out of 10 years, and fell outright in 7 of them.
Why did this happen?
While automotive sales can tick up during the festive season (as the FADA numbers above show), these may or may not show in the stock price immediately.
In some instances, the investor anticipation of auto sales inching higher is priced into the stock prices and it may move higher on expectation.
Take 2025. From 14 August, just before the GST overhaul was first announced (15 August), to 22 September, when it took effect, the Nifty Auto rose 12.6% while the Nifty 50 rose 2.3%.
From 22 September to Diwali, during a record festive season, it rose just 0.3%, against 2.6% for the Nifty 50.
On other occasions, the sales may take time to show up as earnings in the next quarter which is when the stocks may react more. Valuation of the stocks, interest rates, the investor sentiment in the market at the time will of course also matter.
Another thing to note is that the Nifty Auto index is composed of not just car and bike manufacturers, but also includes component and tyre makers whose sales aren’t tied to festive buying.
This could have also led to the auto index’s performance being weak in the period of our study.
To recap, the ‘Muhurat Blessing’ belief sticks because muhurat trading has yielded gains for investors most of the time. However, the session is short and the returns do not guarantee long term advantage.
What happens to your portfolio over the next year depends largely on global events, interest rates, and company earnings, not the festive day you clicked ‘buy.’
While the muhurat trading belief is popular in the Indian investing community, the concept of popular investing beliefs is quite global.
There are a few investing proverbs that are famously repeated and believed by investors in the US and other countries as well.
How does investing based on these globally popular beliefs fare? Do they work for Indian markets?
Study 2: The January Barometer
There is a famous proverb that claims “As January goes, so goes the year.” This means that the yearly returns tend to be good when January gives good returns and vice versa.
Investors who believe in this, wait to see if the markets start the year strong before deploying funds for the year.
We tested two versions of the proverb. First was looking at the first 5 trading days in January and comparing it with the returns for the rest of the year.
The other was comparing the returns of the whole month of January with the returns of the rest of the year (February through December).
The 5-Day Rule is a Coin Toss
In the first version of the proverb that looked at the returns for the first 5 days of January vs the rest of the year, the signal matched the year’s direction half the time.
Nifty 50 fell in the first five trading days of January in 5 out of 10 years in our study, and interestingly, in all 5 of those years, the Nifty 50 still rose over the rest of the year.
In the other 5 years, the Nifty 50 rose in the first five days and kept rising for the rest of the year.
There was no year in which a weak start was followed by a weak year.
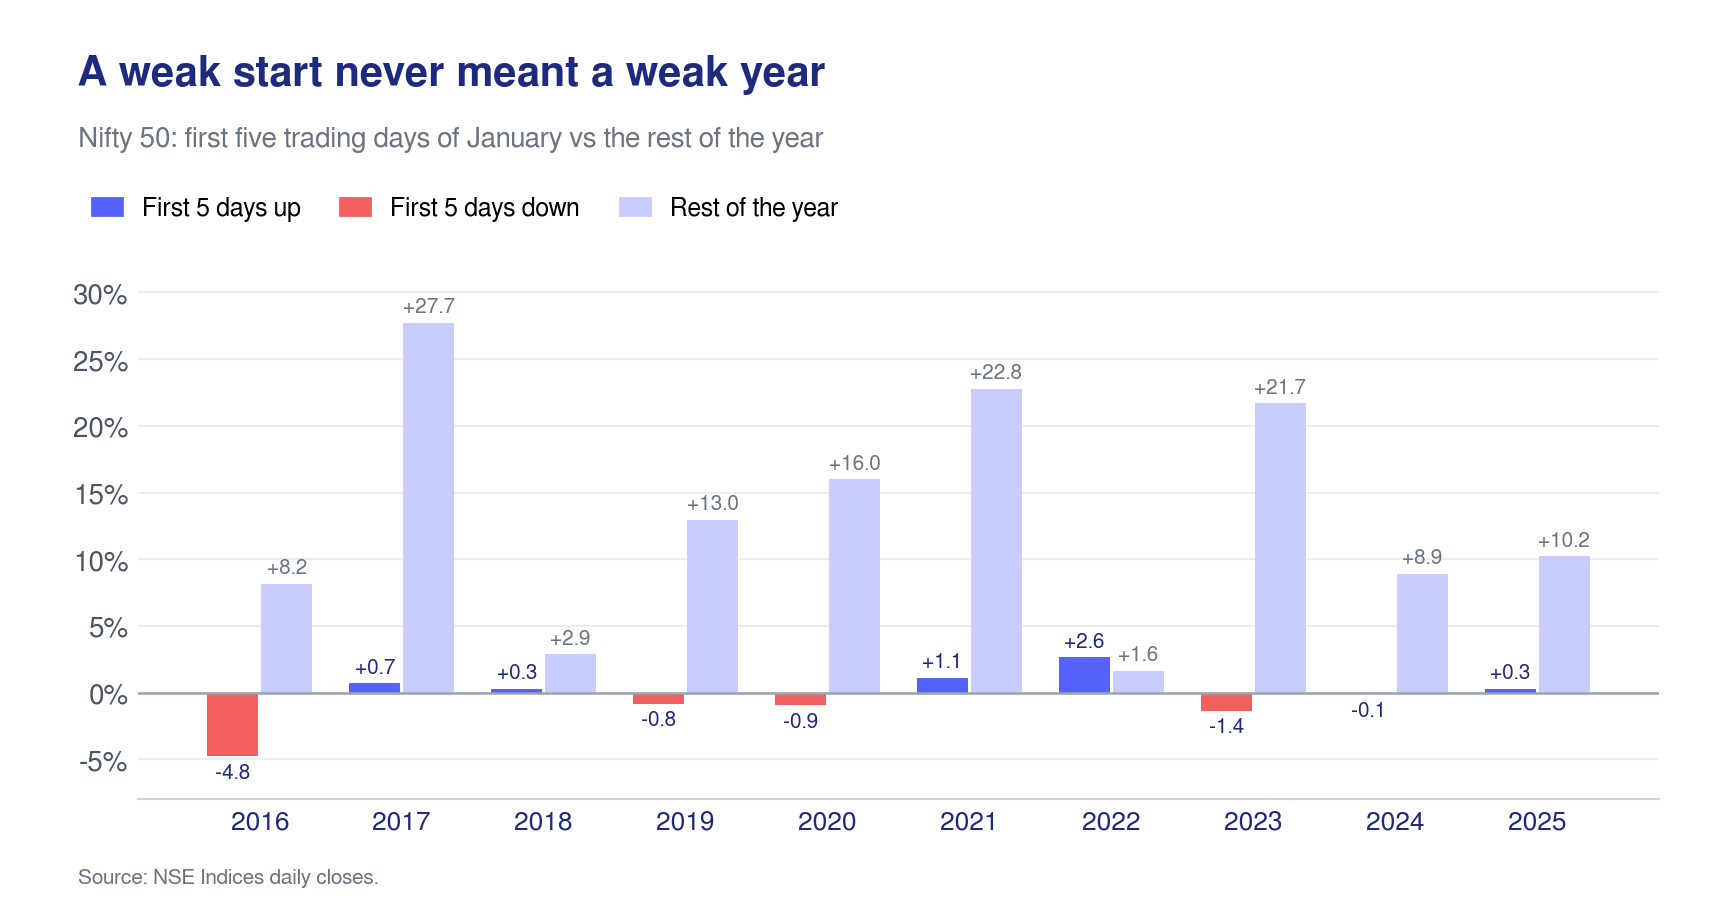
The Nifty 500 index did fall in 2018 by 3.38%, but the first 5 days of January returns of this year were positive which meant it failed to warn investors.
Between 2017 and 2025, the 5 day rule did match the rest of the year’s direction 4 out of 9 times for Nifty 500. (9 years: measuring 2016 needs the Nifty 500’s closing value on 31 December 2015, which is not in our dataset.)
The Full-Month Rule
While the first 5 day signal matched the market’s direction half the time (only because the market rose every year), the full month was almost always wrong.
January returns were negative 80% of the time in the last ten years. On all of those 8 occasions, Nifty 50 rose over the remaining 11 months.
The two years when January returns were positive the results were split. In 2017, a positive January was followed by the markets rising for the rest of the year.
But in 2018, a strong January return of 4.72% was followed by the market falling by 1.5% for the rest of the year. So the full-January proverb pointed in the correct direction only once in the last decade.
Waiting for the entire month of January to finish before investing yielded terrible predictions.
The biggest limitation of testing the January Barometer in this decade was that the Nifty 50 rose every year from 2016 to 2025. Because there were no down years overall, every negative January warning was a false alarm.
Falling for those false alarms cost investors heavily.
If you invested Rs 1 lakh and simply stayed in the market, it would have grown to about Rs 3.29 lakh.
If you sat out every year that had a bad first five days, your Rs1 lakh would have only grown to Rs 1.81 lakh. If you sat out every year with a negative January, it would have grown to only about Rs 1.21 lakh.
So the January Barometer sticks because a strong start of the year gives people a psychological sense of confidence. However, a few days, or even a month is just a tiny slice of time.
The market trajectory over the long term is driven by many factors, as we have discussed, trying to time your entry based on a single month usually just results in missing out on standard market gains and the power of compounding
Study 3: Sell in May and Go Away
This stock market proverb assumes that stock markets are typically weak during the summer months. As per this rule, investors can sell their stocks at the end of April and hold their cash safely, only to buy back into the market in November.
In India, May to October is actually the stronger half.
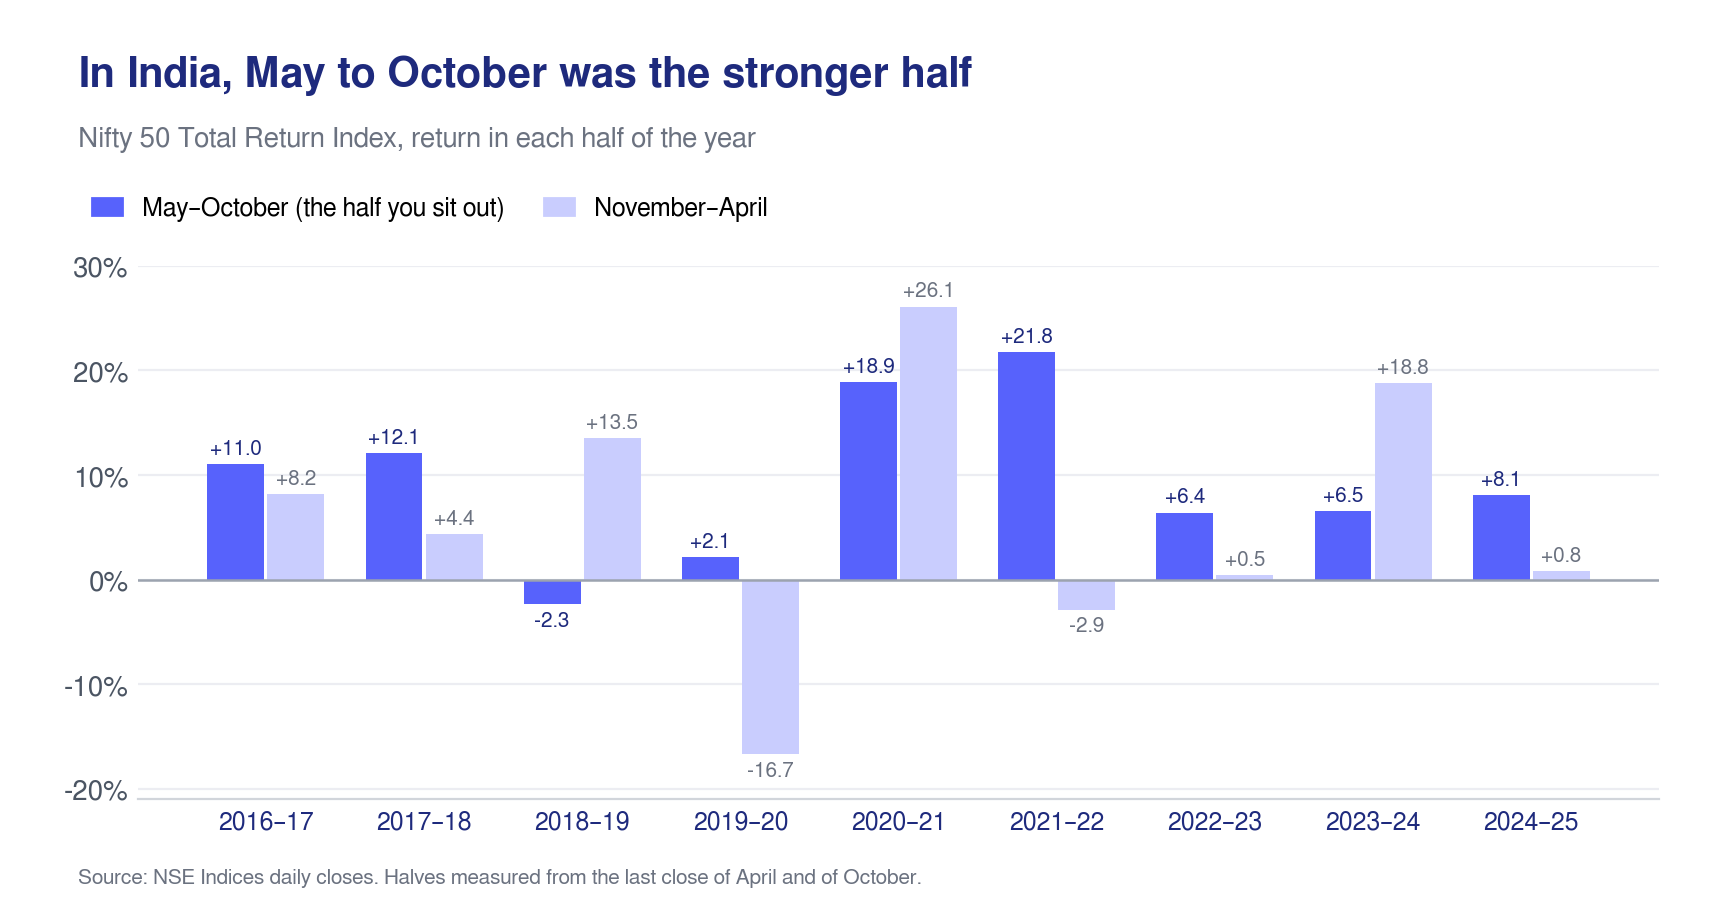
The proverb did not hold water in the Indian market. The May to October period that investors are supposed to sit out were much more profitable than the rest of the year.
The average returns in the May–October half was 9.40% while that of the November–April half was 5.85%.
In terms of consistency, the summer half beat the winter half in 6 out of 9 cycles. It lagged in the other 3, and was negative only once, falling 2.35% in 2018. (9 cycles: the 10th, May 2025 to April 2026, needs index data up to April 2026, which is beyond our dataset.)
The worst crash of the study came in the winter months between November 2019 and April 2020 when Nifty 50 fell almost 17%. A Seasonal Exiter, would have been completely invested in this period having bought back in November.
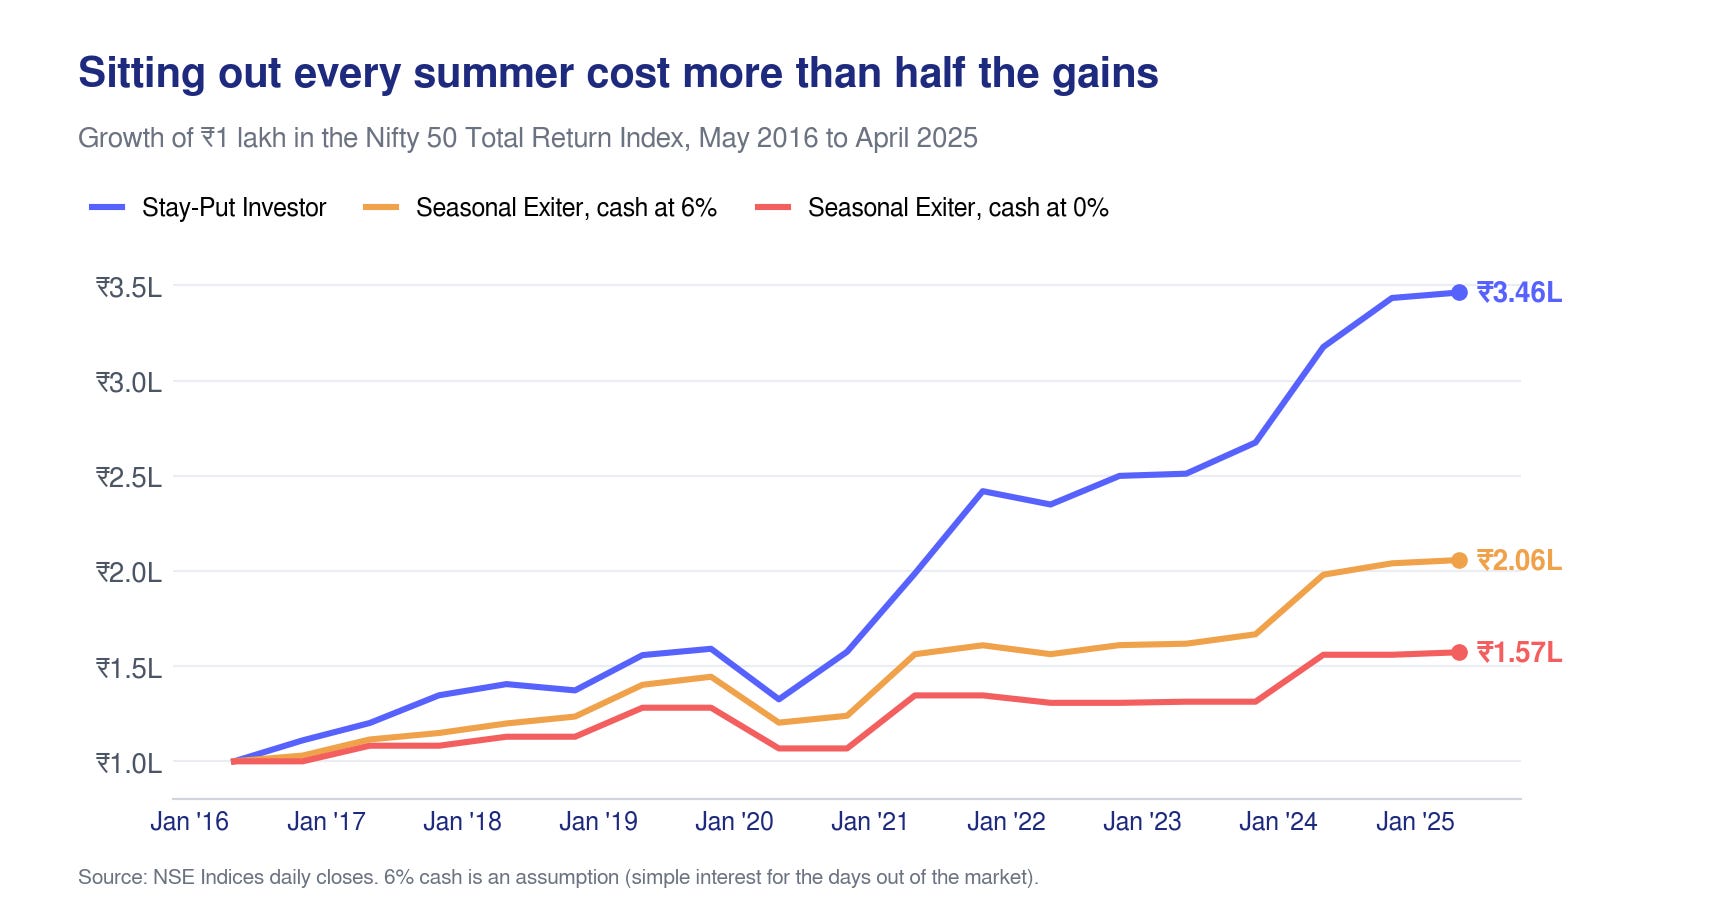
The cost of stepping away from the market in the summer months was also huge. If an investor put Rs 1 lakh into the Nifty 50 in May 2016, and stayed invested till April 2025, the corpus would have grown to Rs 3.46 lakh which is about 14.8% per annum.
If the investor sold in May and held cash earning nothing, the corpus would have grown only about 5.2% a year, to Rs 1.57 lakh.
For the Seasonal Exiter to just break even with the buy-and-hold investor, their cash sitting in the bank would have needed to earn a massive 18% a year every summer.
Some also believe that the proverb works for smaller stocks rather than largecaps, because trading is thinner in the summer months. Not in our data: smallcaps did better from May to October in 5 of 9 cycles, averaging 11.73% against 6.89% for November to April.
Smallcaps crashed 24.58% in the summer of 2018, the sharpest summer drop in our study, but they also jumped the most, 37.64% in summer 2020. Rs 1 lakh left in smallcaps grew to Rs 3.64 lakh; selling every May left Rs 1.55 lakh.
So while the proverb comes from Western markets, Indian markets defied this rule in the last decade, as stepping away for the summer was one of the most expensive mistakes an investor could make.
Study 4: The Santa Rally
The end of the year brings Christmas cheer to the stock market as well. At least that is what is believed to be true by investors in the case of a Santa Rally.
It is assumed that the last 5 trading days of December and first 2 trading days of January will see the markets inch higher.
We decided to test this by assuming that an investor buys just before this window and sells it at the end of the window.
This is the one proverb that held up.
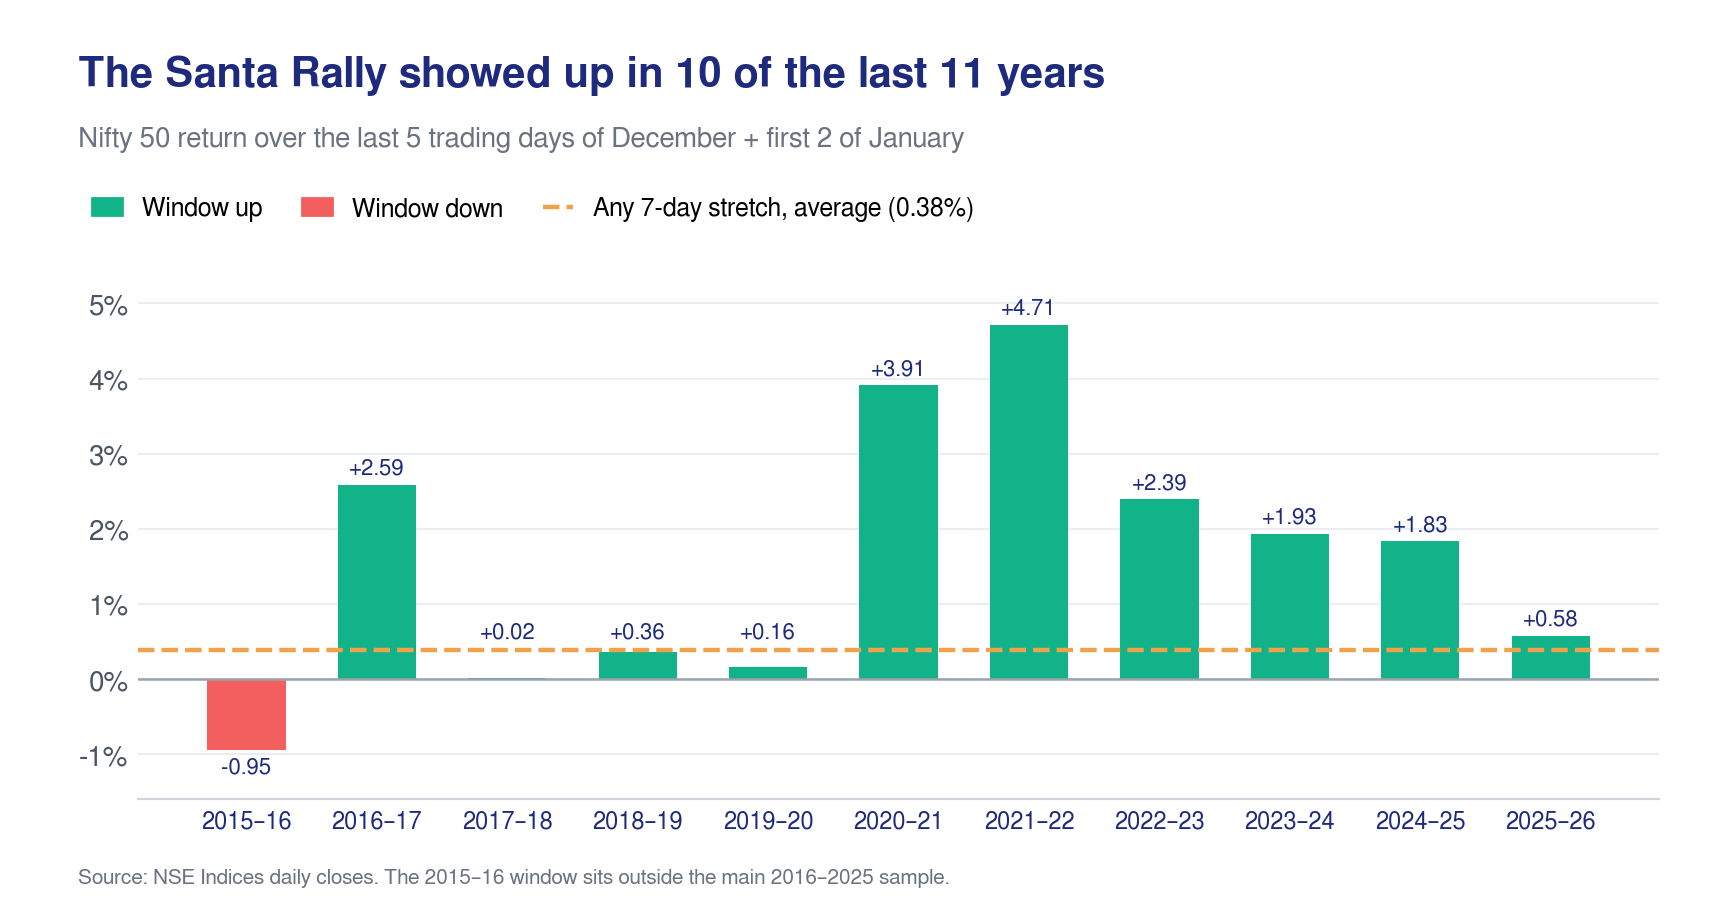
Nifty 50 rose in 10 out of 10 santa windows (December 2016 to January 2026) with an average return of 1.85%. Investing in a random 7 day stretch over the same period rose only 60% of the time with an average return of 0.38%.
Smaller stocks did even better. The Nifty Midcap 150 index rose on all 9 instances with a higher average returns of 3.02%. Smallcap index also rose on all occasions and gave an even higher average return of 3.98%. (9 windows: our Midcap and Smallcap data ends on 31 December 2025, so the December 2025 to January 2026 window can’t be measured.)
The catch however, is that it is a small prize. An investor who only invested in the market during the Santa window turned Rs 1 lakh into Rs 1.20 lakh over the decade. But an investor who stayed invested in the Nifty 50 over the same period made Rs 3.30 lakh.
A common explanation is that foreign investors go on holiday, leaving thin markets that drift up.
The FPI data however, does not support it.
The net FPI flow in December was smaller than the median month in 6 out of 10 years, so yes it is a relatively quieter month. But in 2020 and 2023, December was the single biggest month of foreign buying of the year.
And the rally did not depend on foreign buying.
FPIs were net sellers in December of 2016, 2021and 2025. The Santa window was still positive each time, and 2021’s was the best of the decade at 4.71%.
So the Santa Rally has worked enough times to be remembered but the mistake is treating a one week pattern as a strategy.
And a pattern everyone knows can be traded away.
If enough people buy earlier, the gain moves earlier or disappears, and one shock in a thin holiday week could undo several years of small wins.
The money also has to sit somewhere for the other 51 weeks; if it is in the market anyway, the Santa trade adds nothing.
In rupee terms, the Santa trade earned about Rs 20,000 over the decade, against about Rs 2.3 lakh for simply staying invested.
We have not considered taxes in the study but short term capital gains, brokerage and STT will apply and eat into some of the gains.
Conclusion
Investing in the markets based on certain proverbs does not always pan out. The Muhurat trading window did little harm and little good for the buyers in the period.
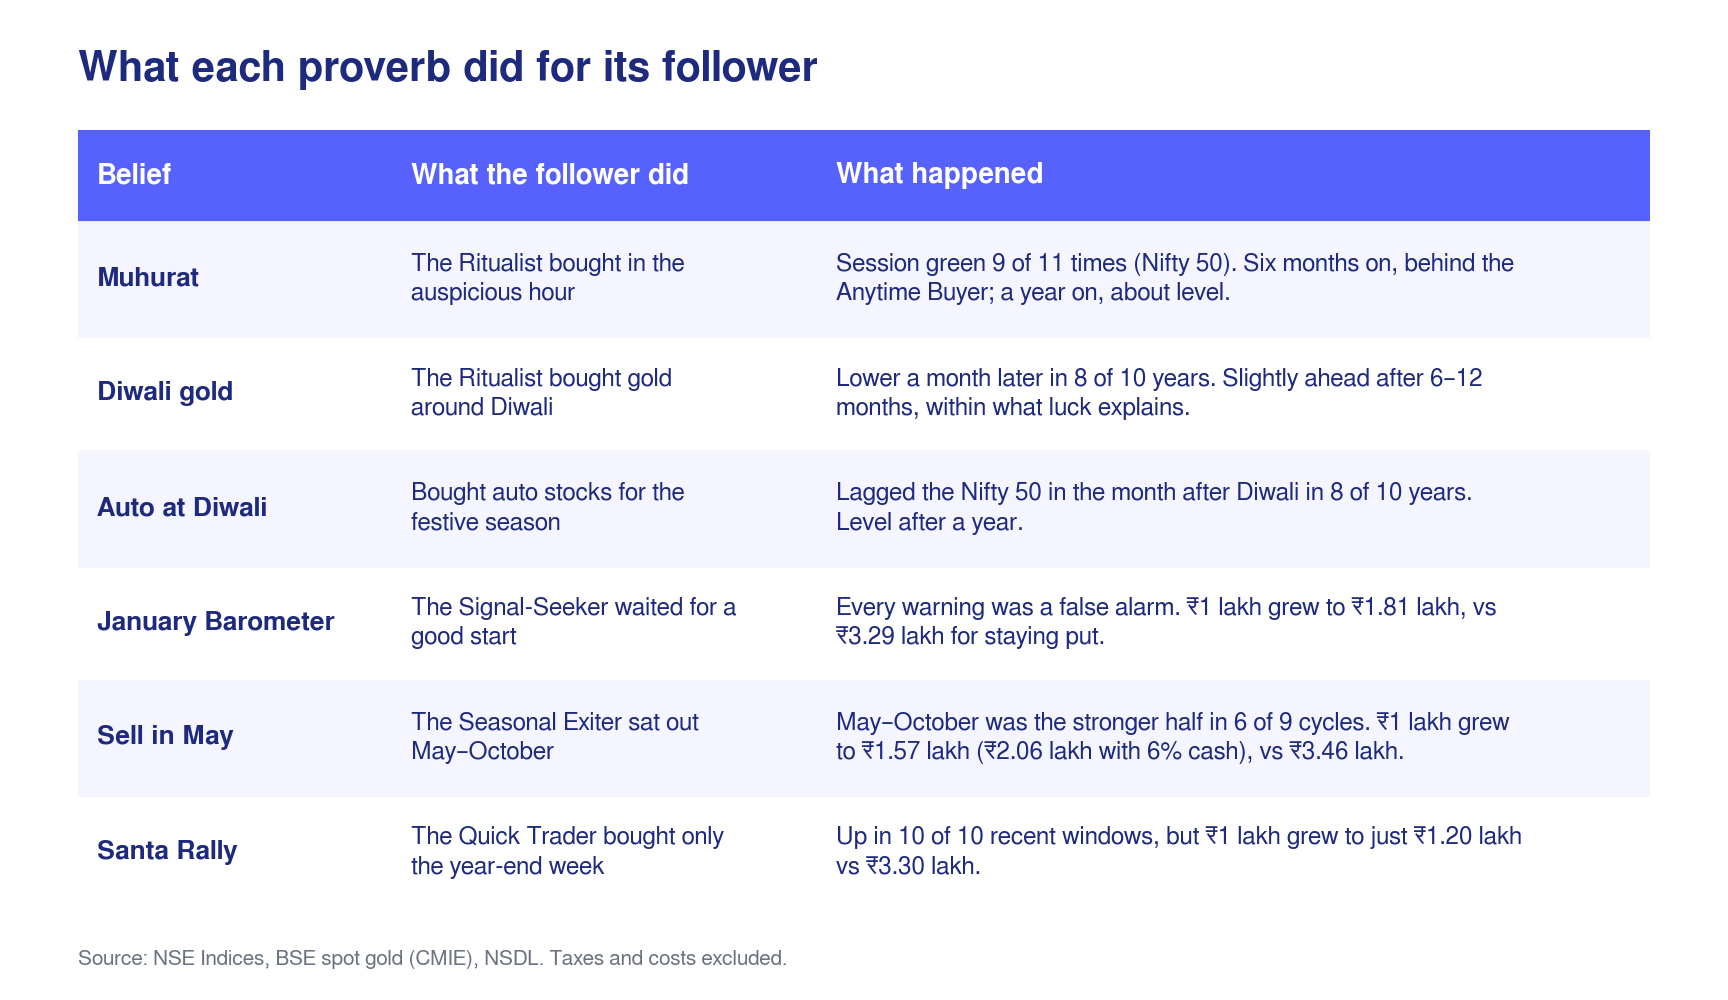
Muhurat buyers of stocks earned slightly less than investors who bought on any other day.
Diwali gold buyers lost ground in the first month but did slightly better over six months to a year.
An auspicious day did not always translate into an auspicious year.
Globally well known proverbs that tell you to step out of the market often cost you the most.
Sell in May and Go Away and predicting markets based on the January returns did far less for investors compared to those who did nothing.
They did not avoid bad periods, but they did miss the good ones.
The Santa Rally pointed to a pattern that did hold up but it is important to remember that this is a pattern not a strategy for wealth creation. A week of gains is too small against a decade of compounding.
Each proverb offered investors a reason to act on the calendar but ultimately, the market
rewarded staying invested more than any of the proverbial investing.
Limitations
Index data: NSE Indices daily closing values for the Nifty 50, Nifty 50 Total Return Index, Nifty 500, Nifty Midcap 150, Nifty Smallcap 250 and Nifty Auto.
Gold: BSE spot price, Mumbai, Rs per 10 grams (CMIE). Spot gold is not quoted on most Diwali days, so the entry is the last available price before the Muhurat session. Gold’s Diwali move compares the last price before Diwali with the first price after it; the gap between the two was 1 to 10 days.
FPI flows: NSDL, monthly net investment, equity.
Sell in May assumes the investor holds cash earning nothing between May and October.
Muhurat dates and session returns: NSE index data.
Returns are price returns unless stated and exclude dividends. The main Sell in May comparison uses the total return index.
Muhurat: Diwali 2015-2024. One month = 30 days, six months = 182 days, one year = 365 days, using the last available price on or before each date. 12-month returns cover every Diwali in the study.
January Barometer: 2016-2025 (Nifty 500: 2017-2025). Sell in May: May 2016-April 2025, with re-entry at the last October close. Santa Rally: Nifty 50, December 2016-January 2026; other indices, December 2016-January 2025.
Baselines use every trading day in the same period with a full forward window available.
Taxes and transaction costs are excluded. They would hurt the frequent-trading strategies further.
Sample sizes are small (9-10 observations per study). These are historical observations, not predictions.
Past performance does not guarantee future results.