

1924, Boston. Massachusetts Investors Trust.
That was the name of America’s first modern open-ended mutual fund.
Investors could put money into the fund and, whenever they wanted to leave, redeem their units directly with the fund.
That basic structure eventually became the model for modern mutual funds.
But there is an interesting story behind the word “Trust” in its name.
It actually has its roots in real estate.
Back then, some investors in Massachusetts wanted to pool their money and buy properties together.
But there was a problem.
Companies could not simply buy buildings just to rent them out. They were generally allowed to own property only if they needed it for their own business, like an office or factory.
So some Boston lawyers and investors found a loophole.
Instead of forming a company, they used an older legal structure called a trust.
A few people, called trustees, would legally hold and manage the properties. The people who put in money would get certificates giving them a share of the income and value of those properties.
Because a trust was not technically a company, the restriction on companies did not apply.
So even if one person could not afford a large property, many people could pool their money and invest together.
By the late 1800s, these real estate trusts had become fairly common.
They also had a tax advantage. From 1913 to 1935, they were generally not taxed like normal companies.
But in 1935, the US Supreme Court changed how these trusts were taxed.
The trust could now be taxed on the income it earned. And when that money was passed on to investors, they could be taxed again.
So the same income could effectively be taxed twice.
A year later, the rules changed for funds that invested in stocks, so they no longer had to deal with this extra layer of tax.
Real estate trusts were left out.
That changed in 1960.
At the time, the US Congress, basically the American version of Parliament, was passing a law called the Cigar Excise Tax Extension Act.
It was mainly about taxes on cigars, but lawmakers can also add other provisions to a bill that is already being passed.
One of those provisions was about real estate trusts.
Until then, these structures went by names such as Massachusetts trusts, business trusts and common-law trusts.
The 1960 law gave qualifying trusts a common legal identity: Real Estate Investment Trusts, or REITs.
So what exactly is a REIT?
Understanding mutual funds will help you understand REITs.
A mutual fund pools money from thousands of investors and uses it to buy stocks.
A REIT does something similar, except it uses that money to own real estate, such as office buildings, malls and other large properties.
But there are two important differences.
First, a REIT does more than just hold properties. It also runs them and signs leases, collects rent and maintains the buildings.
So in that sense, it is closer to a landlord business than just a portfolio of investments.
The second difference is how the money comes back to investors.
In a mutual fund, dividends and gains usually stay inside the fund and show up in the NAV. You generally get the money when you sell your units, unless you have chosen a payout option.
A REIT is different.
In India, REITs are required to distribute at least 90% of their net distributable cash flow to investors.
Most listed REITs make these payouts every quarter. India introduced REIT regulations in 2014.
Now, if you want to invest in real estate through the stock market, you now have two options.
A developer company that mainly makes money by building and selling properties or a REIT that mainly owns completed properties, rents them out, and earns regular income from them.
Both give you exposure to real estate, but they work very differently.
Do REITs and real estate developer stocks, also called realty stocks, actually behave the same way? And which factors matter more for their returns?
That is what we decided to test.
Results
Did real estate stocks follow house prices?
We started with the most obvious question: if house prices rise or fall, do REITs and real estate developer stocks move in the same direction?
We compared them from March 2021 to March 2025, starting after Brookfield was listed, which gave us 16 quarters.
For all six investments, along with the Nifty 50 and Nifty Realty, we used quarter-end closing prices and compared them with the RBI All-India House Price Index, or HPI.
For every quarter, we checked whether house prices went up or down and whether each REIT or developer/realty stock moved in the same direction.
If these investments closely followed house prices, they should have matched them most of the time.
They did not.
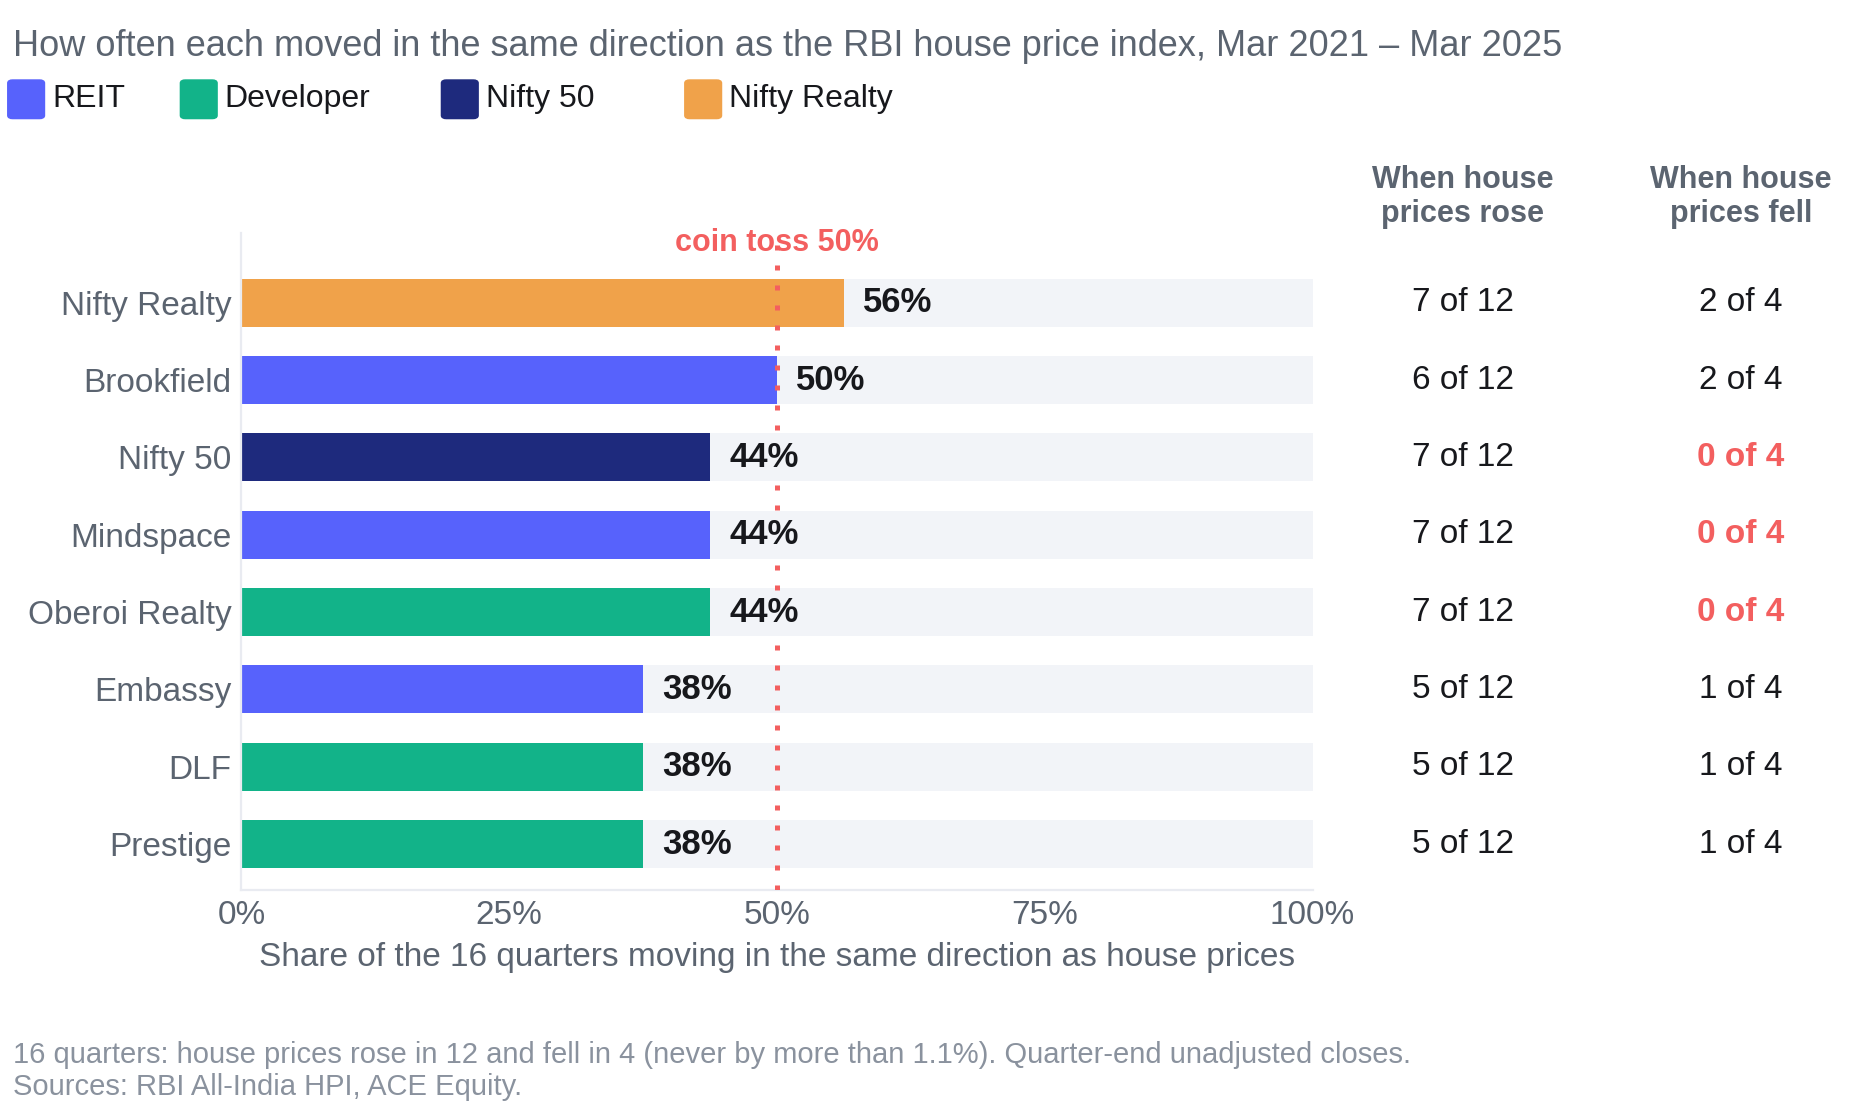
As the chart shows, none of the six REITs or developer/realty stocks matched house prices more than 50% of the time.
The relationship looked a little better when house prices were rising, with match rates of around 42% to 58%.
But in the four quarters when house prices fell, never by more than 1.1%, the relationship became much weaker.
Brookfield and Nifty Realty matched in 2 of the 4 quarters, Embassy, DLF and Prestige matched in just 1, while Mindspace, Oberoi Realty and the Nifty 50 did not match in any of them.
The size of the moves told a similar story.
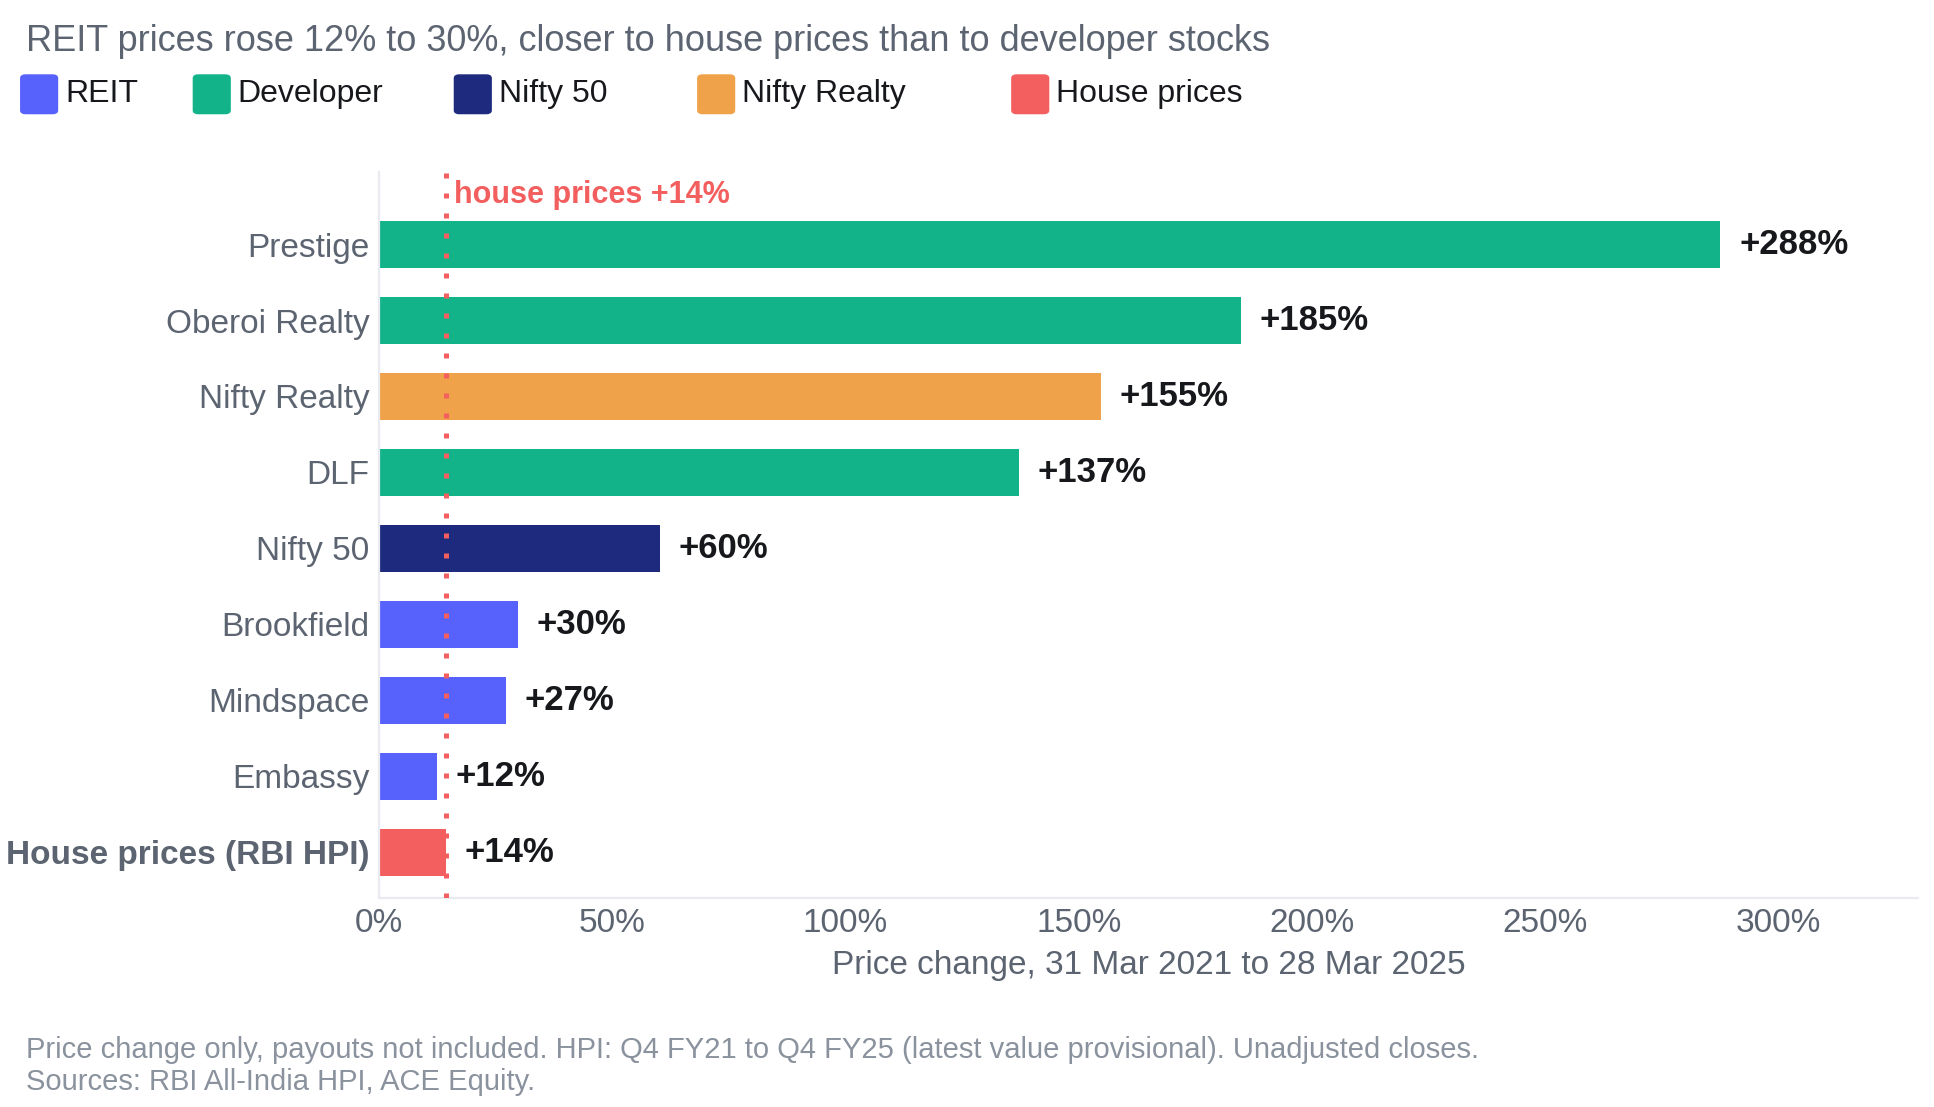
Over the four years, house prices rose around 14% and REIT prices rose around 12% to 30%, but developer/realty stocks rose far more and even outpaced the Nifty 50’s roughly 60% gain.
So why weren’t these investments moving with house prices?
One reason could simply be timing.
The RBI’s house price index is based on property registrations. A property deal may have been agreed earlier, but it can show up in the data only when the registration happens.
Stock prices do not have that delay.
They can react immediately to earnings, new projects, policy changes or even a change in overall market sentiment.
That is why we also compared the total move over the full four-year period, where this timing gap matters less.
But timing is only part of the story.
A listed real estate stock can move for many reasons that have little to do with house prices.
A developer can launch a new project, report better profits, reduce debt or simply rise because the broader stock market is doing well.
Property prices also usually move much more slowly. If a homeowner does not like the price being offered, they can simply wait. A listed stock cannot do that. Its price changes every day as buyers and sellers react to new information.
And there is another important difference when we look at REITs.
The RBI HPI tracks residential house prices. The REITs in our study mainly own office properties. So there is no reason to expect both to move in exactly the same way.
Put all of this together, and the result makes more sense.
Rising house prices alone were not enough to explain how these investments moved. Other factors were clearly playing a role.
That brings us to REITs. REITs earn rental income from office properties and regularly distribute a large part of that cash to investors.
So investors can compare the income from a REIT with what they can earn from safer investments like government bonds.
If interest rates rise, those safer investments can become more attractive. If rates fall, REIT income can start looking more attractive again.
So if house prices were not explaining REIT prices very well, the next question was quite natural:
Did interest rates have a bigger role in moving REIT prices?
What did they respond to instead?
If house prices were not explaining REIT prices well, the next thing we tested was interest rates. We compared the three REITs and three developer/realty stocks with India’s 10-year government bond yield, or G-sec yield.
This is the return investors earn by lending money to the government for 10 years. Since the government has very low default risk compared with a company, this yield is often treated as a benchmark.
The logic is simple. If government bond yields rise, safer bonds become more attractive. REITs cannot suddenly increase the rent they earn from their buildings. So one way their own yield can become more attractive is if their market price falls. In theory, the opposite should happen when government bond yields fall.
We split the four years into three periods: before the RBI started hiking rates, during the rate hikes and after the hikes ended.
March 2021 to April 2022
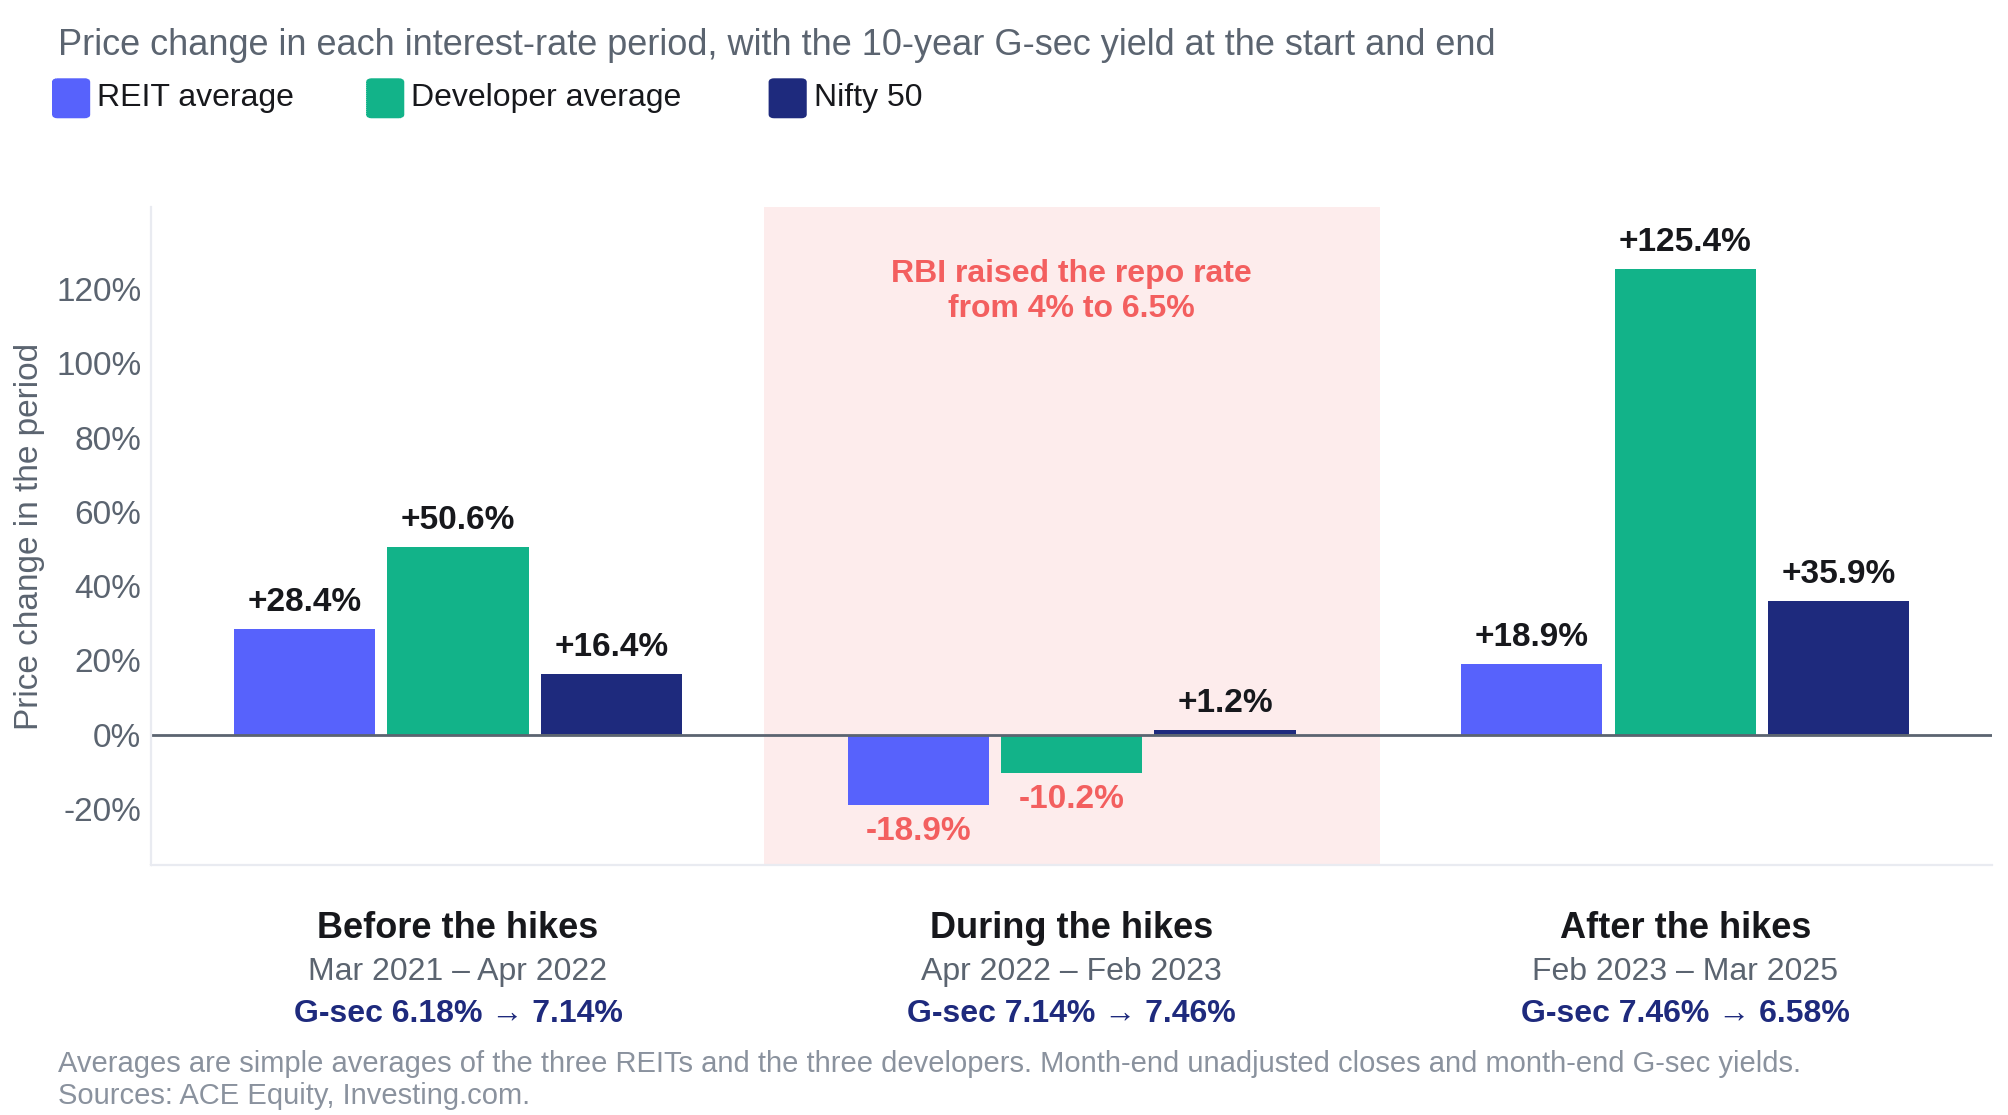
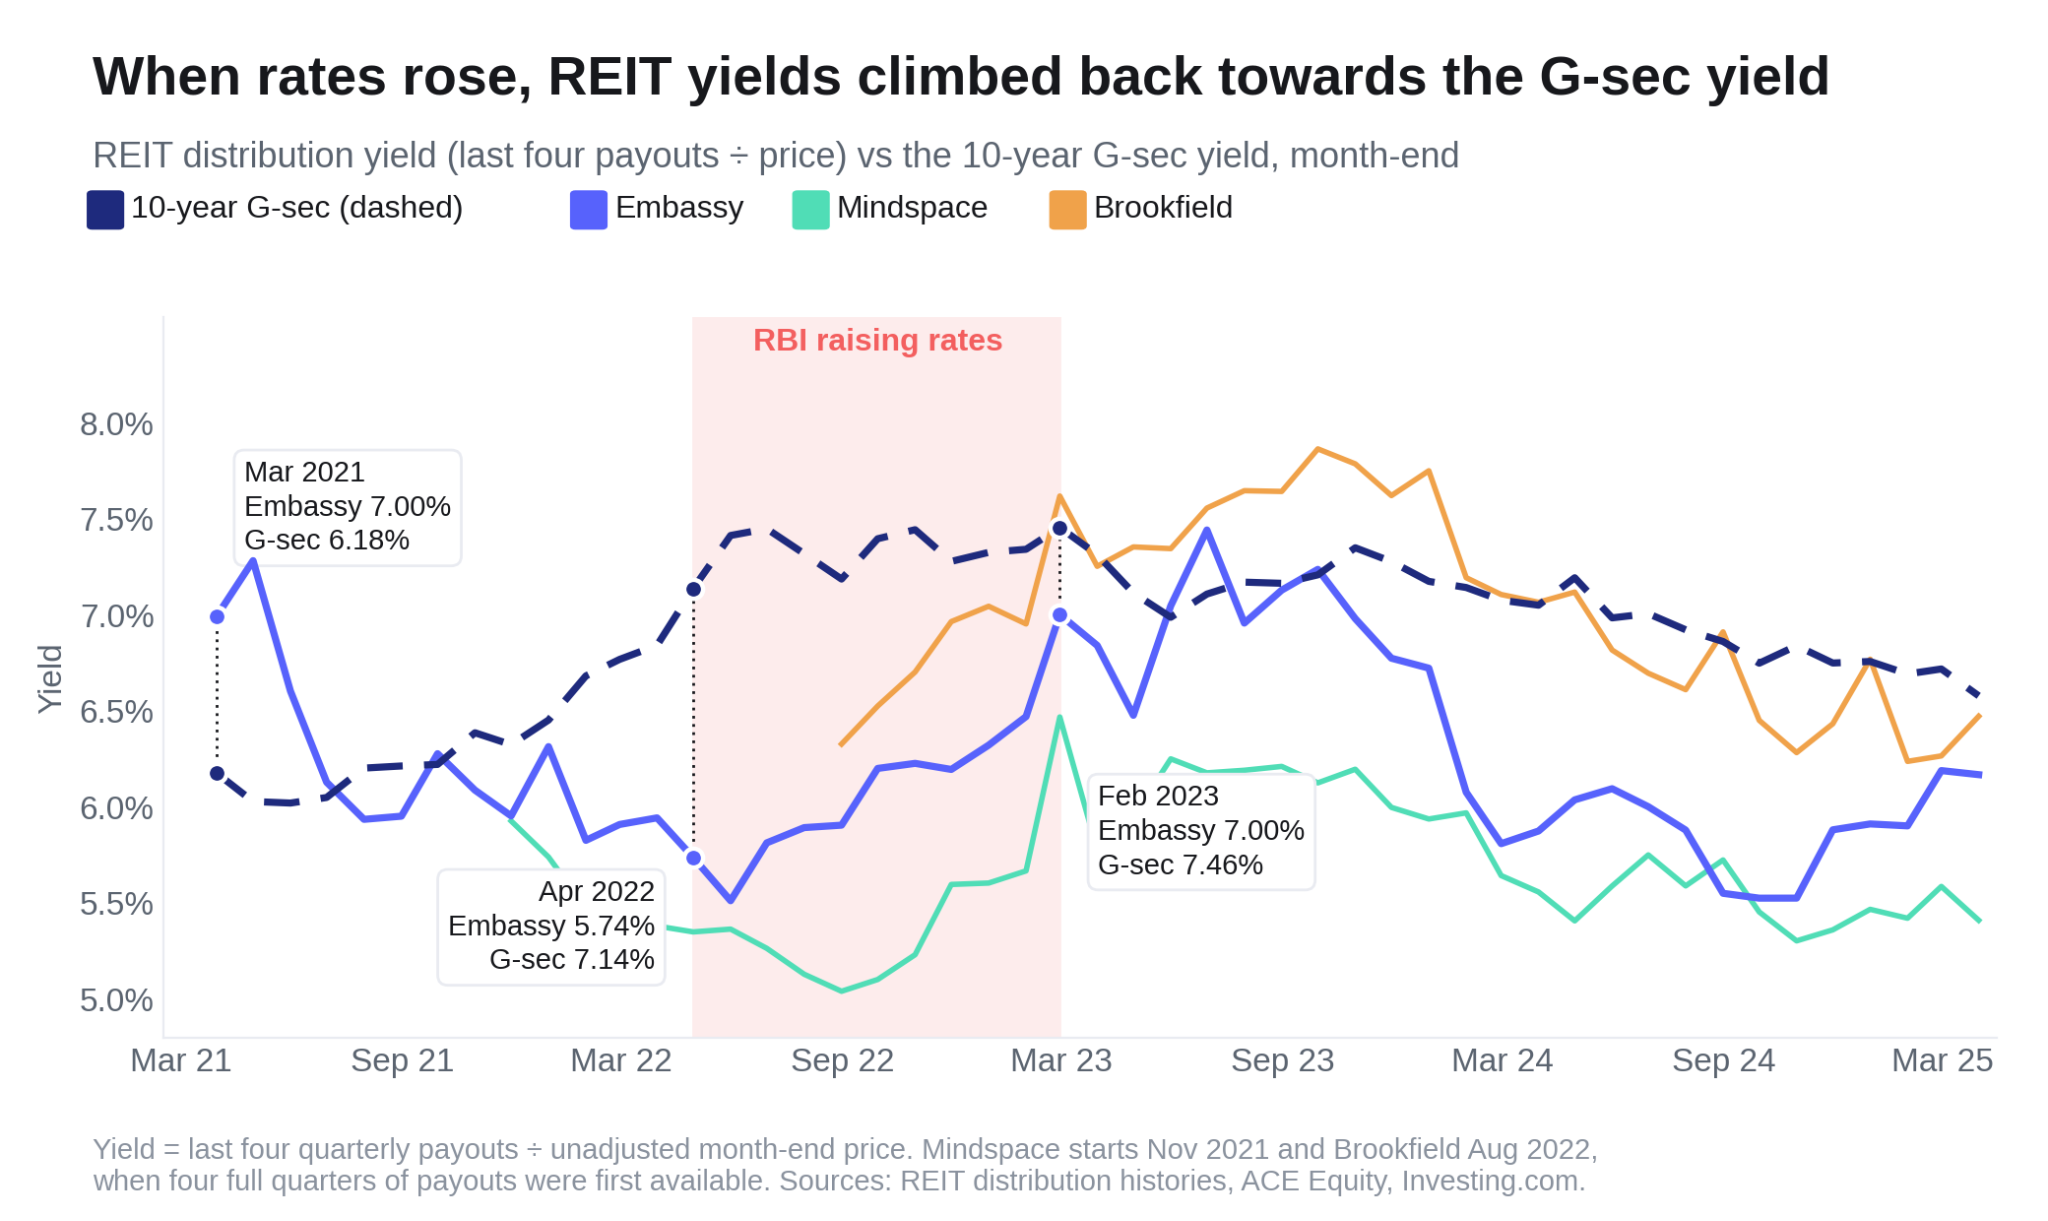
Before the RBI started hiking rates, the 10-year G-sec yield rose from 6.18% to 7.14%. If interest rates were the only thing moving REITs, their prices should have fallen.
But they did not.
The average REIT price rose 28%. Brookfield gained 48.7%, while Embassy rose 18.3%.
Embassy’s own yield actually fell from 7% to 5.74%. So investors were willing to pay more for the same income even though government bonds were also offering higher yields.
One possible reason was offices reopening after Covid. During the pandemic, there was a fear that work from home could permanently reduce demand for offices. As companies brought employees back, that fear reduced and investors may have become more positive about office REITs.
Developer/realty stocks also rallied strongly. Prestige and Oberoi rose 55.3% and 67%, while the three developers gained around 50.6% on average. The broader post-Covid stock-market rally and company-specific factors could also have helped.
So this period showed us that interest rates were clearly not the only thing moving REIT prices.
April 2022 to February 2023
This is where the relationship became much clearer. The RBI raised the repo rate from 4% to 6.5%. The 10-year G-sec yield stayed around 7.1% to 7.5%, much higher than the roughly 6% levels seen in early 2021.
All three REITs fell between 16% and 21%, with the average down almost 19%. Developer/realty stocks also fell, but by much less. The Nifty 50 actually rose 1.2%.
What makes this interesting is that the REITs were still paying almost the same amount of cash.
Embassy continued paying around Rs 5.26 to Rs 5.46 per unit every quarter, while Mindspace and Brookfield also had fairly steady payouts. The buildings were still earning rent.
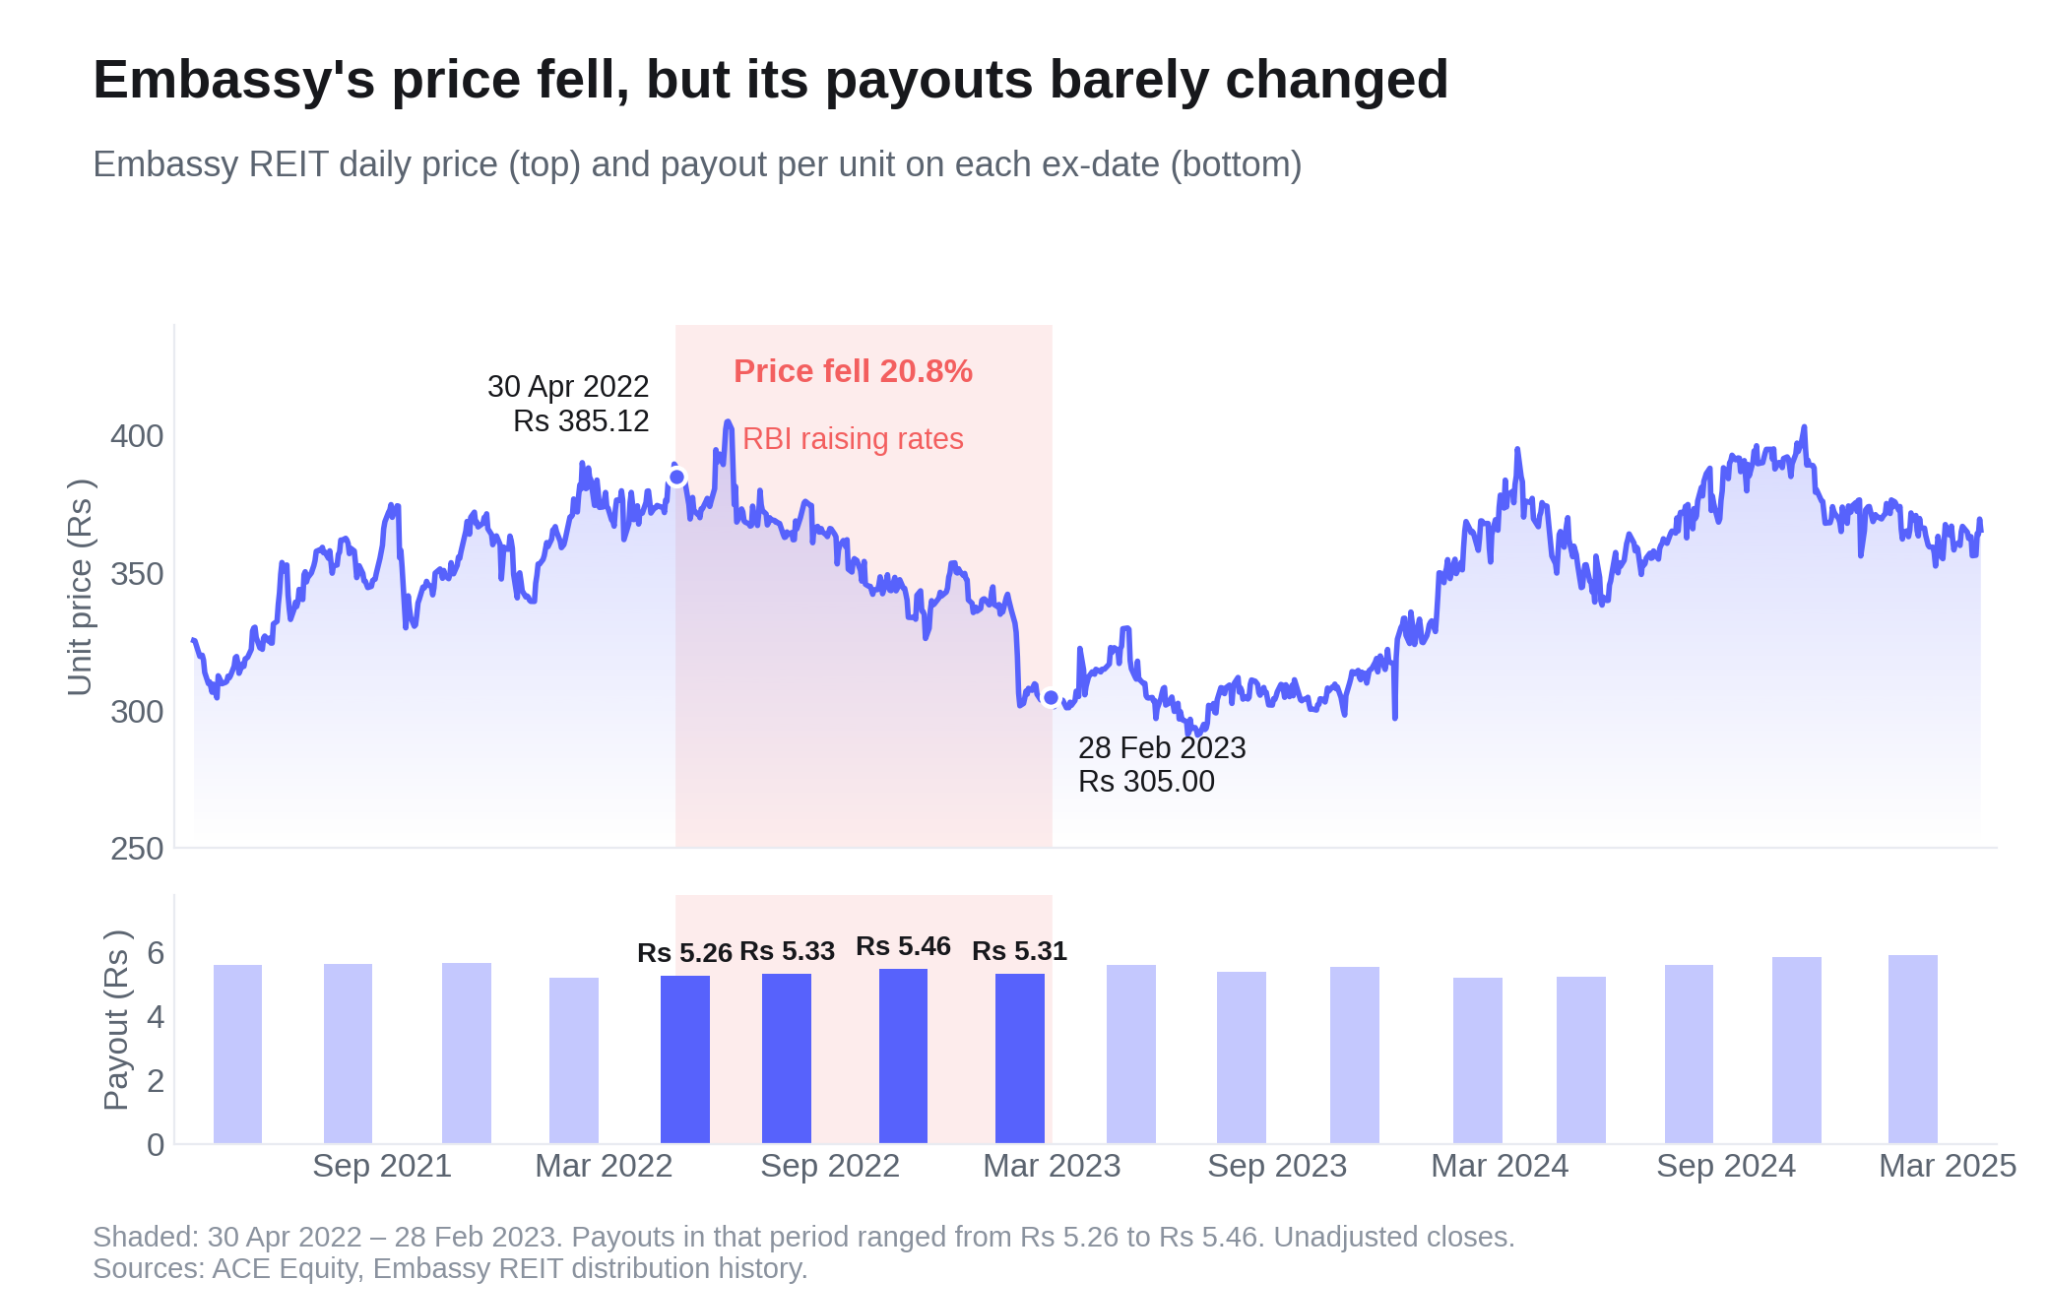
What had changed was the return available elsewhere. Government bonds were now offering higher yields.
Since REITs could not suddenly raise rents, their prices fell. That pushed their own yields higher and made them more competitive with bonds.
Embassy’s yield rose from 5.74% to 7%, while Mindspace’s yield rose from 5.35% to 6.47%. This is similar to how bonds behave: when market yields rise, prices tend to fall. During this period, REITs behaved a lot like fixed-income investments.
Higher interest rates can hurt developers too because home loans and borrowing become more expensive. Developer/realty stocks did fall, but less than REITs. Strong sales, new projects and other company-specific factors may have helped cushion the fall.
February 2023 to March 2025
Then the direction changed again. The 10-year G-sec yield fell from 7.46% to 6.58%. The average REIT price rose 18.9%.
By March 2025, REIT yields had fallen to around 5.4% to 6.5%, compared with a G-sec yield of 6.58%.
Developer/realty stocks, however, rallied much more. They rose 125.4% on average. DLF and Oberoi nearly doubled, while Prestige nearly tripled.
One possible reason was that lower interest rates made equities more attractive and supported borrowing and economic activity. The broader stock market was also doing well, while earnings, valuations and company-specific factors could have added to the rally.
So what did we learn?
Interest rates did matter for REITs.
During the rate-hike period, they behaved a lot like fixed-income investments.
But the first period showed that the relationship was not perfect. Office demand, rents and leases, new property acquisitions, taxes and other business factors could still move REIT prices.
Developer/realty stocks behaved differently. They moved in much bigger swings and appeared to respond more to the broader stock market and company growth. They also fell when rates rose, but less than REITs.
And that led us to the next question.
So far, we have only compared prices. But REIT investors also receive regular cash payouts. What did investors actually earn after including those payouts?
What did you actually earn?
So far, developer/realty stocks looked much better than REITs. But comparing only their price returns is not completely fair.
Developers can keep most of their profits and use that money to buy land or build new projects. REITs work differently because they have to distribute a large part of the cash they generate to investors.
So for a developer, more of the return can show up in the share price. For a REIT, a bigger part can come as regular cash payouts. That means looking only at price can make REITs look worse than they actually performed.
Comparing total returns
To make the comparison fair, we calculated the total return of all six investments from March 2021 to March 2025. We used their actual, unadjusted market prices and added every dividend or REIT distribution ourselves.
For the Nifty 50, we used the Nifty 50 TRI, which already includes dividends. We also assumed that every payout was immediately reinvested into the same investment.
And this made a big difference for REITs.
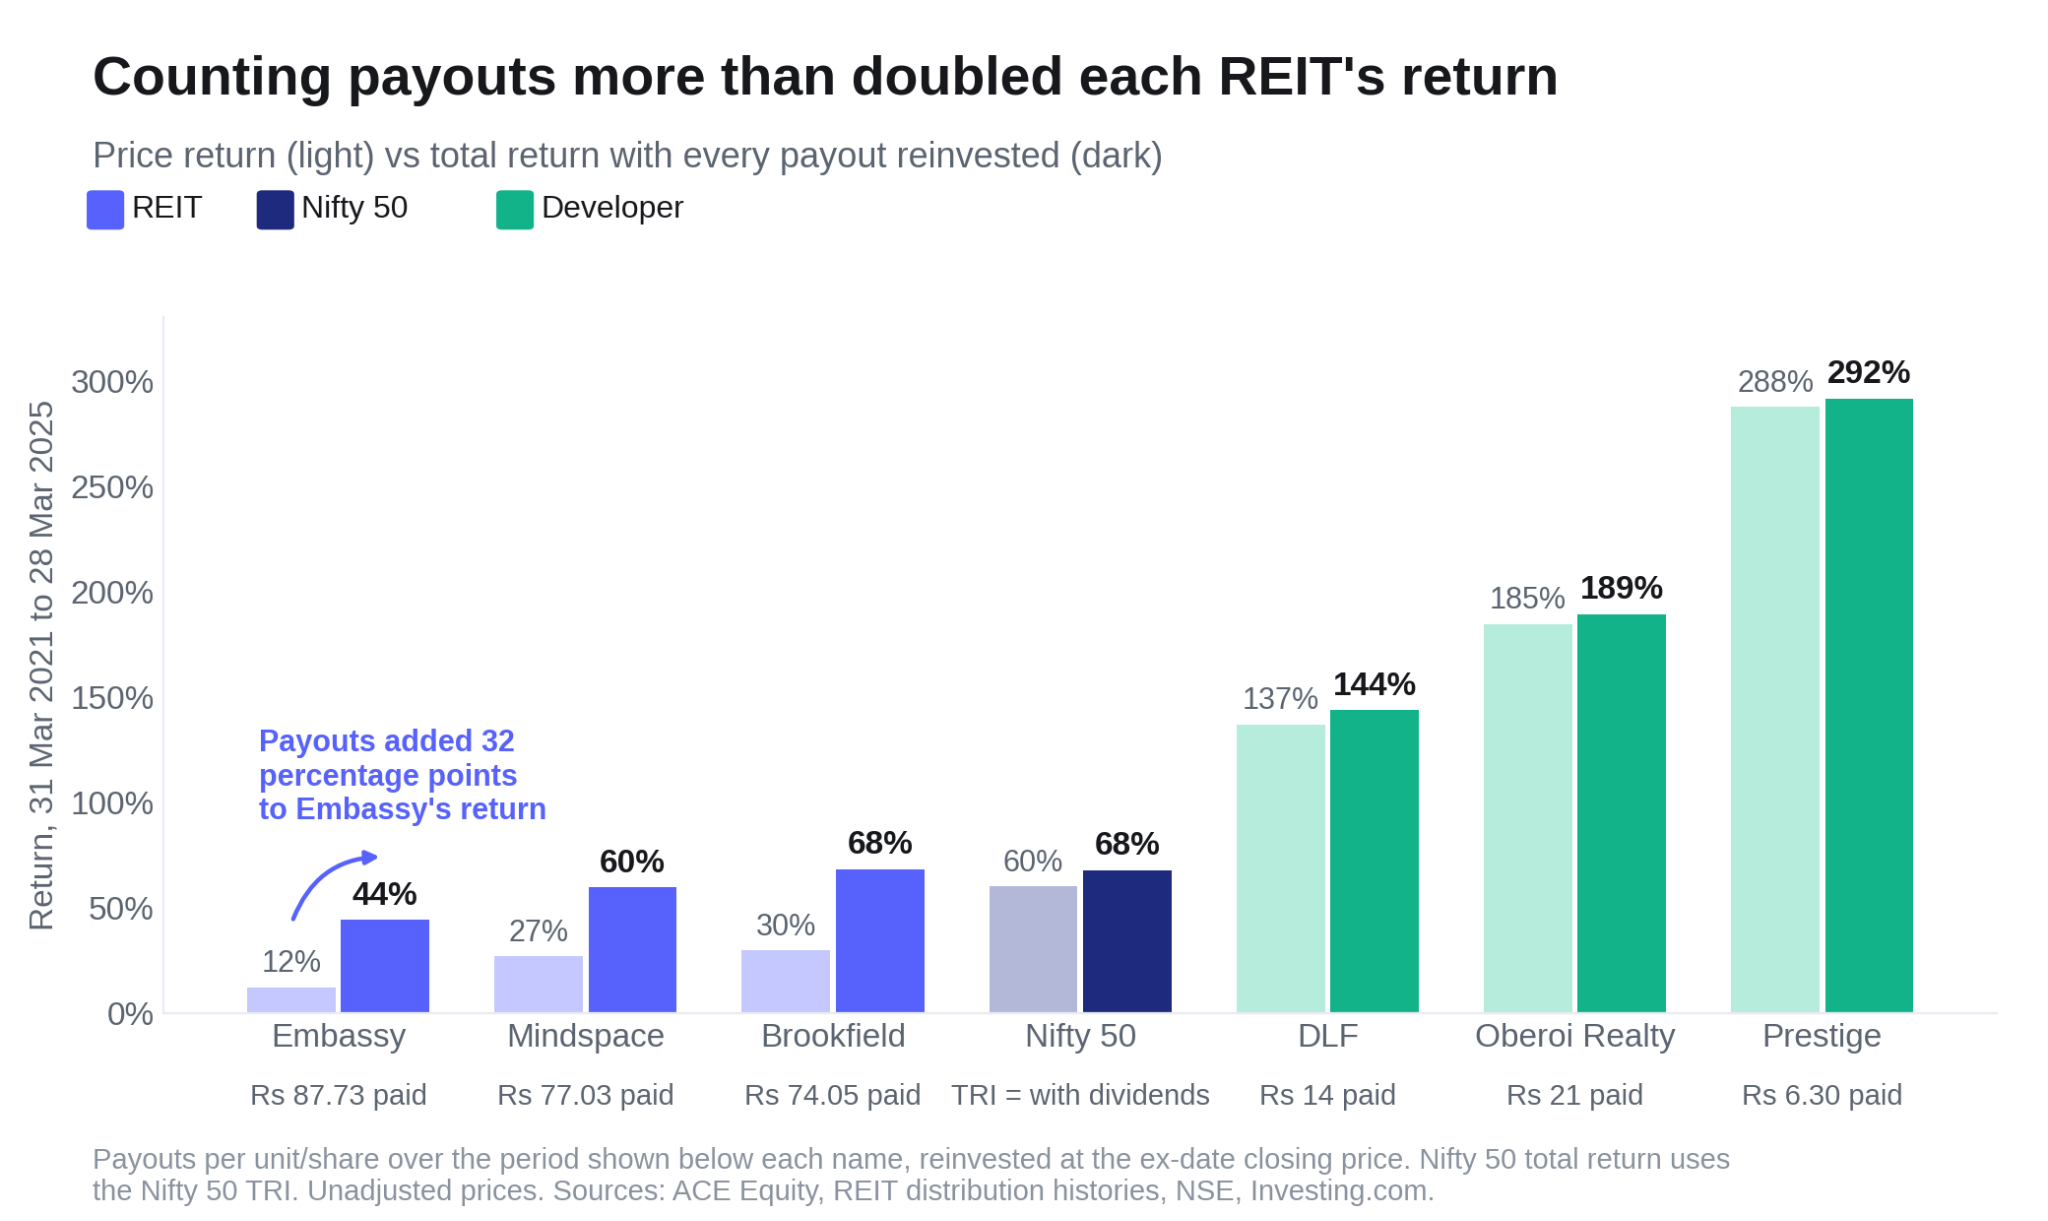
Embassy’s price rose only 12.3%, but it also paid Rs 87.73 per unit over the four years. Once those payouts were reinvested, its total return became 44.3%.
Brookfield’s price rose 29.8%, but its total return was 68.4%, almost the same as the Nifty 50 TRI. Mindspace’s total return was around 60%.
Developer/realty stocks still did better. DLF’s price rose 137.1%, and after including dividends, its total return became 143.7%.
The difference was much smaller because developers do not have to regularly distribute cash the way REITs do. So even after including payouts, developer/realty stocks still outperformed the REITs in our study, but the gap became smaller.
For example, DLF’s lead over Embassy was around 125 percentage points when we looked only at prices. On total returns, that gap fell to around 99 percentage points.
So the takeaway is simple: for REITs, price return alone does not show the full picture. The cash payouts are an important part of what investors actually earn.
Conclusion
Even though REITs and realty stocks both come under real estate, investing in them is very different.
When you buy a realty stock, you are investing in a company just like you would with any other stock. Its share price can move because of its sales, profits, new projects, debt, future growth and what is happening in the broader stock market.
The company can also keep most of the money it earns and use it to buy more land or build more projects. If investors believe this will lead to higher profits in the future, the stock price can rise.
A REIT works differently. It owns properties that earn rent and distributes a large part of the cash it generates to investors. So a bigger part of an investor’s return may come through regular payouts, rather than only through a rise in the REIT’s price.
And that is exactly what we saw in our study.
Housing prices alone did not explain the movement of either REITs or realty stocks. Realty stocks showed much bigger swings and appeared to react more like regular stocks, with company performance and the broader market playing an important role.
REITs behaved differently. At times, especially when interest rates were rising, they behaved more like fixed-income investments. But office demand, rents and other business factors mattered too.
We also saw why comparing only prices can be misleading. Once the cash payouts were included, the gap between REIT and developer-stock returns became smaller.
So the two may both give you exposure to real estate, but they give it to you in very different ways. A realty stock is an investment in a business that builds and sells property. A REIT is largely an investment in properties that earn rent and distribute cash.
And our study shows that neither can be understood by looking at housing prices alone.
Note
The study covers only March 2021 to March 2025 and one major rate-hike cycle.
The sample is small: 3 REITs and 3 developer/realty stocks.
Study 1 has only 16 quarters, and house prices fell in just 4 of them.
The RBI HPI tracks residential property prices, while the REITs mainly own offices.
Study 2 depends on the chosen interest-rate periods. Different dates could change the exact numbers.
Mindspace and Brookfield yield data starts later because four quarters of payout data were needed.
Total returns assume every payout was reinvested at the ex-date closing price.
Taxes and transaction costs are not included.
Data came from ACE Equity, NSE and Investing.com, so figures may differ slightly from official sources.
The study shows patterns, not causes. Other factors could also have moved prices.
Past performance does not guarantee future results.