

October 2024.
A South Korean car-maker was listing its Indian subsidiary outside of Korean markets for the first time ever.
And that’s not all.
They aimed to raise a record-breaking amount- over Rs 27,000 crore, which made it the largest IPO in the history of Indian markets and the largest IPO in Asian markets in 2024.
This was the Hyundai Motor India IPO which grabbed both headlines and investor attention.
The company had started selling cars in India in 1996 and became the second largest car-maker in India by understanding Indian customers and Indian roads.
Hyundai Motor India was a profitable business when it came up with an IPO. The company’s net profit had grown almost 29% to Rs 6,060.04 crore in the financial year 2024.
But despite being in the spotlight and being profitable, the company listed at below its IPO price. Why did this happen?
Bigger IPOs typically get spoken about a lot, and one would assume that this results in good performance. But do bigger IPOs give investors higher returns?
The Study
We took the top 5 IPOs in terms of size every year, for the last ten years, and looked at their performance on listing day versus over a period of time.
Three companies had to be dropped for want of reliable adjusted price history, so the study covers 47 companies rather than 50. IPO data from final prospectus of companies. Prices from ACE Equities.
When a company enters or lists on public markets, three scenarios can happen. It can list or open at a price higher than its issue price, which is called the ‘listing premium’. Or it can list lower than the IPO price, which is called ‘listing at a discount’.
The issue price is the upper end of the IPO’s price band.
Sometimes companies end up opening at the exact same price as their IPO price, which is called a ‘flat listing’.
Most retail investors subscribe to IPOs hoping to benefit from what is called a ‘listing pop’. Listing pop means that the company lists at a very high premium and allows investors to exit with massive gains.
So it is fair to say that for many investors, listing gains are an important factor to consider an IPO.
Results
Six out of ten times, the biggest IPO of that particular year, failed to make listing gains.
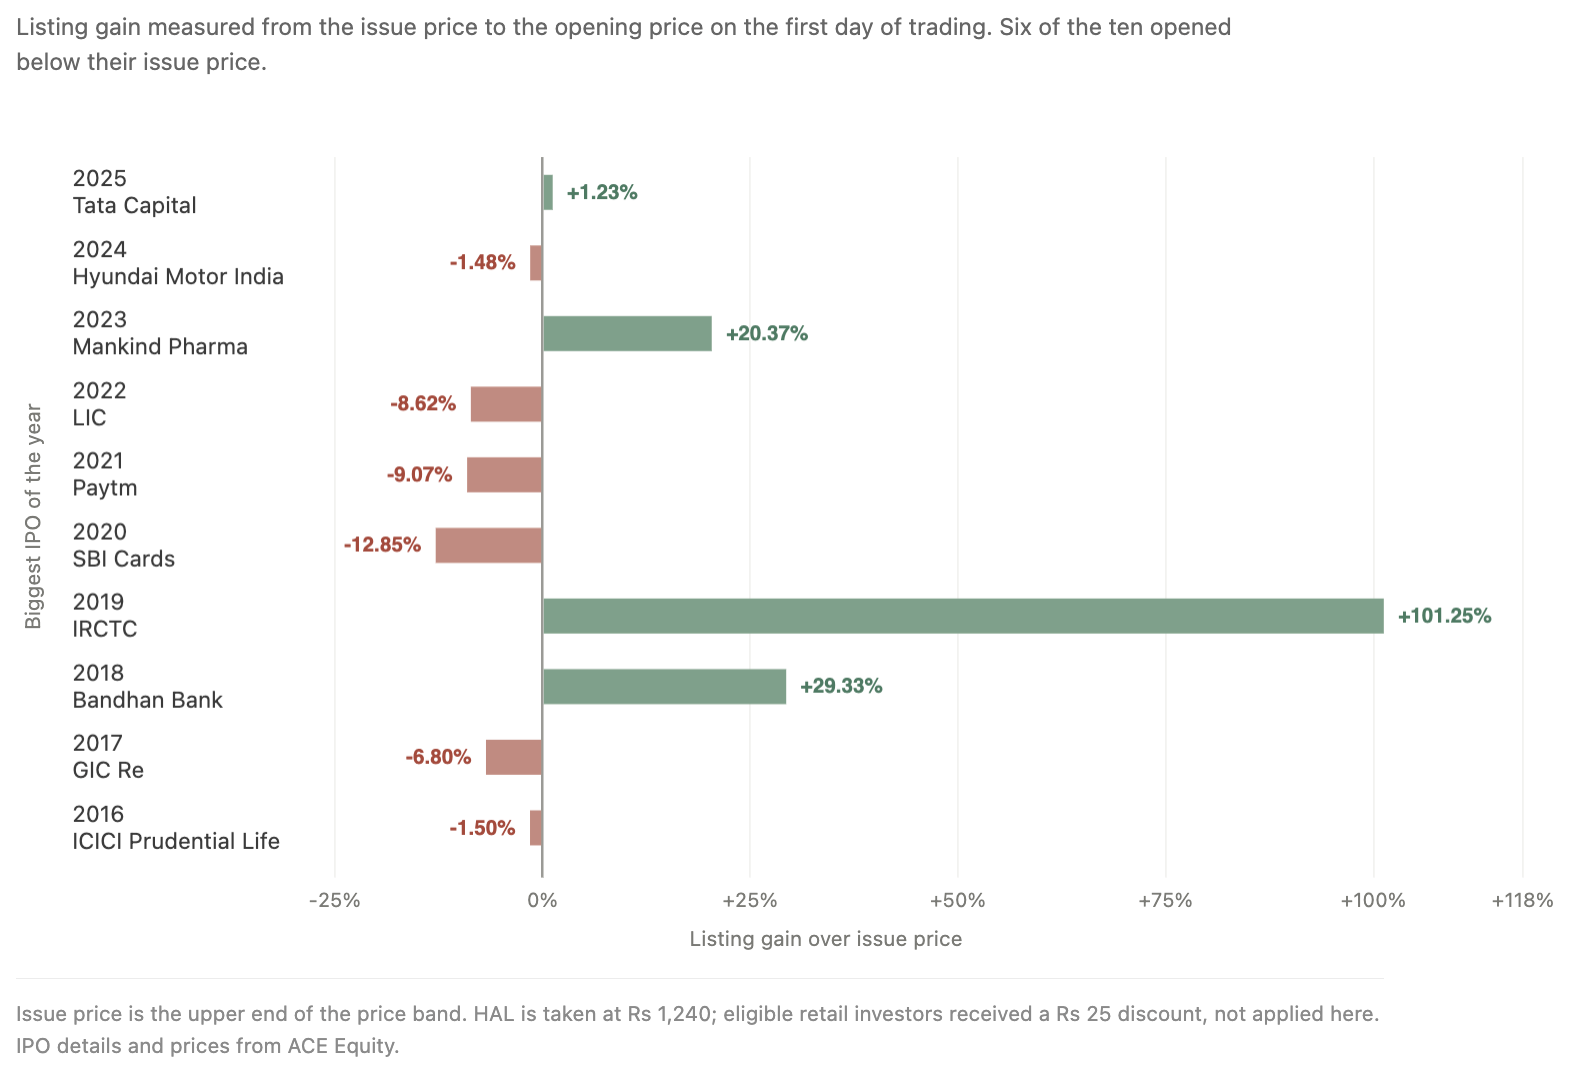
Hyundai Motor India is a recent example of this. The biggest IPO in India ever, listed on the exchanges at a discount of 1.5%.
Another was LIC, which listed 8.6% lower. PayTM, GIC, SBI Cards- biggest IPOs of the years, ended up listing at a discount.
The only exceptions to this were Bandhan Bank, IRCTC and Mankind Pharma. Tata Capital made listing gains but the number was quite small at 1.23%.
Looking at the broader dataset, exceptional listing gains were not common, despite the size of the IPO.Only a handful of companies delivered exceptional listing gains.
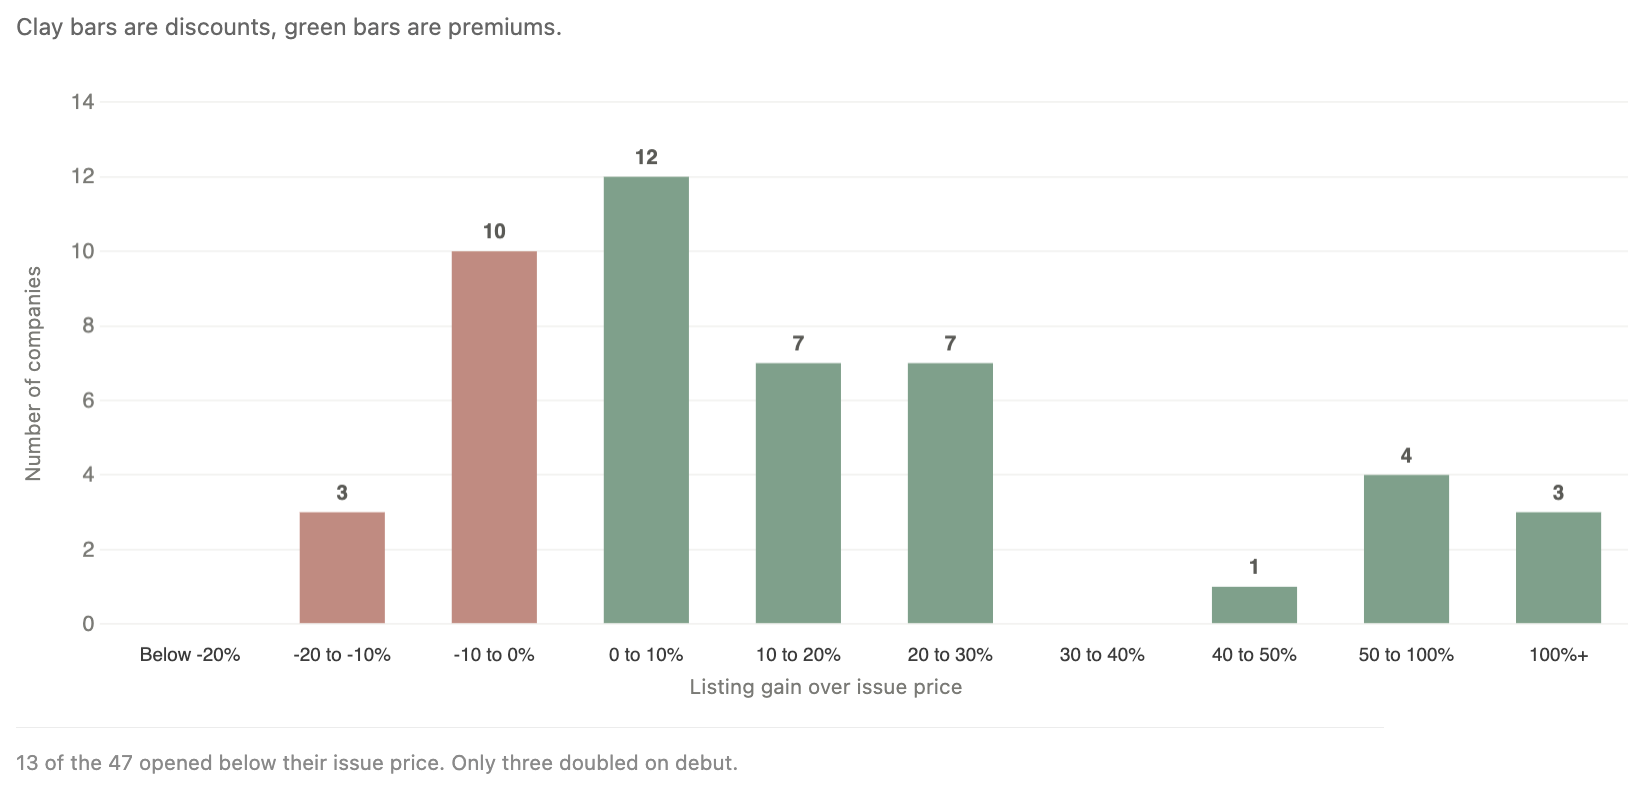
Most premiums were modest: 12 companies listed below 10%, seven between 10-20%, and seven between 20-30%.
Only one IPO listed between 40-50%, while just three delivered listing gains of over 100%.
13 companies however, listed at a discount- including Paytm, GIC Re, SBI Cards, Adani Wilmar, Star Health, Angel Broking (Angel One) etc.
Why did only some of these big IPOs see massive listing gains while others failed to make any gains? There are a couple of reasons for this.
Volumes
Larger IPOs usually come to the markets with a huge volume of shares. And while the investor demand for these shares can be strong, the high volume means there is less scarcity.
Think of it this way: if there are millions of Hyundai shares available on listing day, investors can buy them more easily. But if a smaller IPO has far fewer shares available, investors have to compete harder to get them.
Prices are a function of demand and supply, after all. So high volume of shares in big IPOs lead to more availability of shares and in turn can limit listing gains and vice versa.
Valuation
Mega IPOs are often priced at valuations that many investors perceive to be close to their fair value.
So there is less incentive to bid aggressively on listing day, reducing the chances of a listing pop.
This was one of the key concerns in the Hyundai IPO. Investor discussions and brokerage reports spoke on whether the valuations allowed for any scope of gains.
Large OFS component
The IPO is made up of two parts: a fresh issue and an offer for sale. A fresh issue usually means that the company aims to use these funds for growth purposes (setting up a new factory, purchasing equipment, or for general corporate expenses).
An offer for sale, on the other hand, means that existing investors are cashing out.
Even though it doesn’t imply poor performance, some investors prefer a company raising funds to invest in growth over one that provides an exit to shareholders.
Many of the mega IPOs that underperformed on listing day, including Hyundai, LIC, and ICICI Prudential Life, were purely OFS. SBI Cards and Payments had a higher OFS component.
Market conditions
If the markets rose significantly on the listing day of a particular company, then it is likely that the company will ride the wave of investor optimism.
The converse is also true.
When Hyundai listed on the exchanges, in October 2024, the sentiment had begun to shift.
The markets and IPOs had already witnessed two blockbuster years of high returns and many began to believe that the peak was achieved.
Nifty and Sensex made lifetime highs on September 27, 2024 and underperformed for over a year after that before making another high in January 2026.
October 2024 also triggered massive foreign selling in India.
This could have also been a factor for Hyundai’s weak listing.
So while bigger IPOs generate a lot of buzz, its size doesn’t guarantee listing gains.
Factors like high volumes, valuation and the OFS component in the IPO also play an important role. That’s why only some of the mega IPOs deliver on listing.
While listing gains are important, it is not necessary that a company that did not deliver listing gains is not worth investing in at all.
Listing day is only the beginning. Can a company that disappoints on listing day, still make meaningful returns for investors over the long term?
Long term returns
We looked at the company’s performance one year after its IPO listing and its performance till 16 July 2026 since listing to judge its longer term performance.
The one-year results leaned positive, but not decisively.
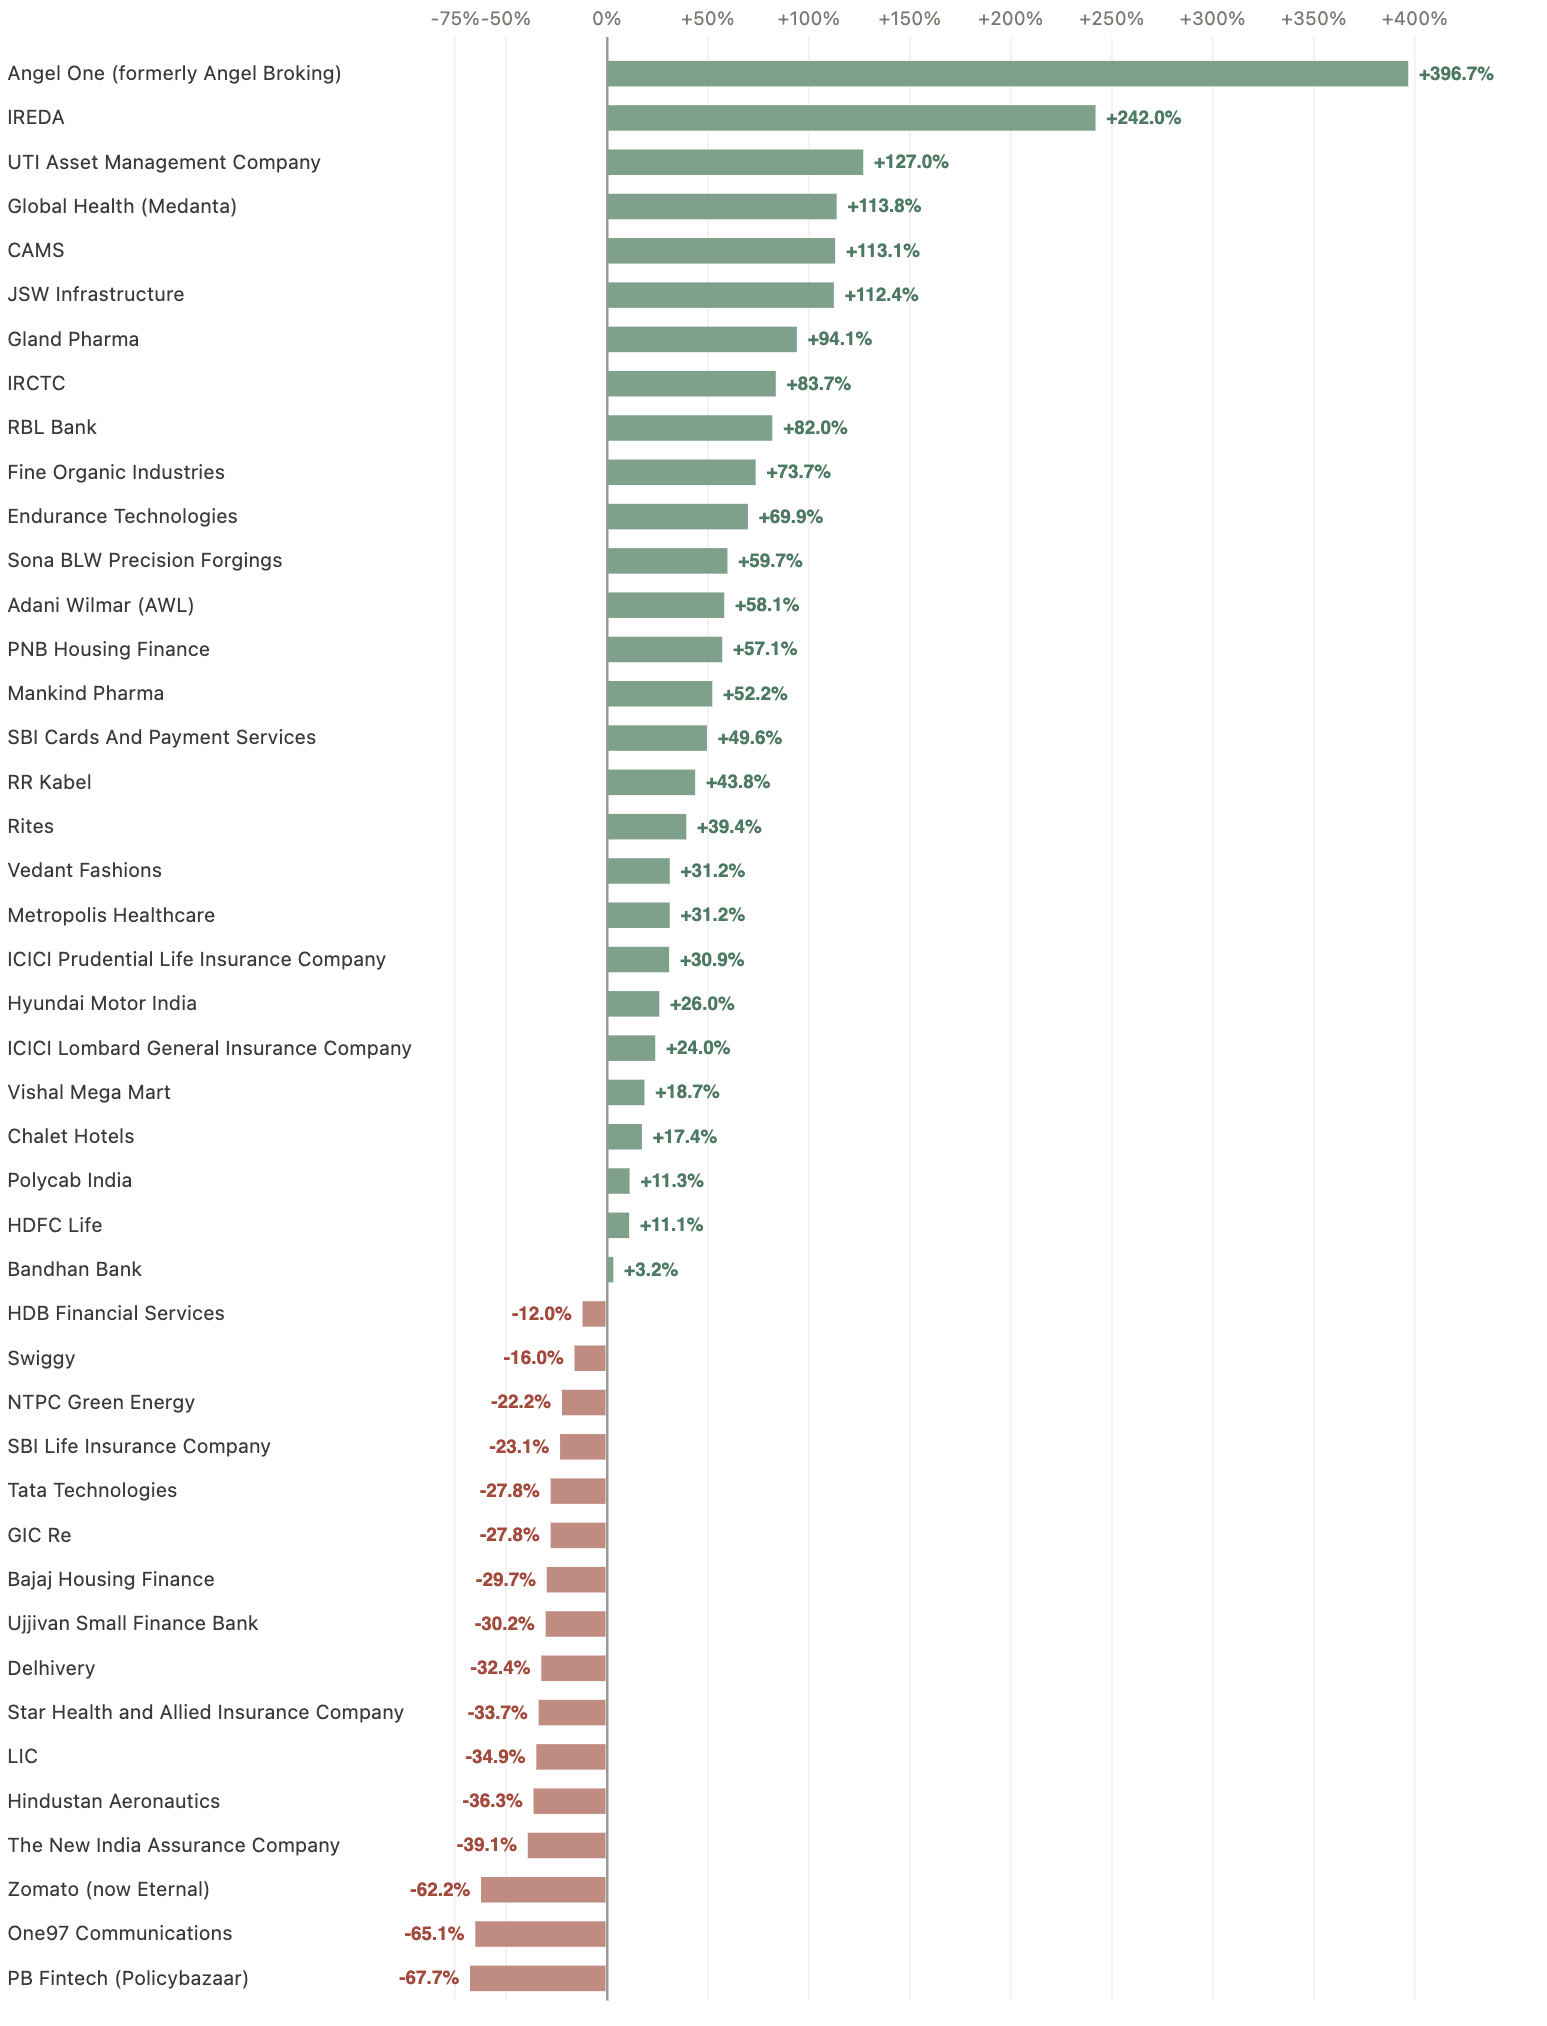
28 of 44 companies remained higher than the listing day closing price a year later. 16 companies fell below it.

NOTE: All prices used are adjusted closing prices, so stock splits and bonus issues do not distort any return. Ten companies in the study had a split or bonus.
Three of the 2025 IPOs had not completed one year as of 16 Jul 2026, so they are excluded from the one year study.
Six of the 44 companies more than doubled investors’ money within a year of listing.
Here, a multibagger refers to a stock that gained over 100% from its listing day closing price.
The highest one-year return was delivered by Angel One at 396.74%, followed by IREDA at 241.96% and UTI Asset Management at 126.96%.
While some companies made sharp gains, there were many that made much smaller ones.
PB Fintech declined the most, falling 67.71% below its listing day closing price after one year. Paytm, Zomato and New India Assurance were among the other companies that also traded below their listing day price after a year.
The results suggest that listing day performance alone did not determine one-year returns. Some companies that delivered modest or no listing gains went on to outperform over the following year, while several strong listing-day performers failed to sustain those gains.
Clearly, listing day wasn’t everything.
Hyundai, which listed at a discount, was up 25.99% a year later. Bandhan Bank, which listed at a 29.33% premium, had gained only 3.23%.
But do the number of multibaggers also go up in the long term?
To get a better idea about the long term gains after a big ticket IPO, we also looked at the performance of a company since listing.
One limitation of this analysis is that companies listed recently have had less time to generate long-term returns. For companies that listed in 2025, the performance since listing covers less than a year, while for 2024 listings it covers only around one to two years.
Even with this limitation, the longer-term picture appears stronger than the one-year results.
32 of the 47 companies were above their listing day closing price on 16 July 2026. 15 were below it.

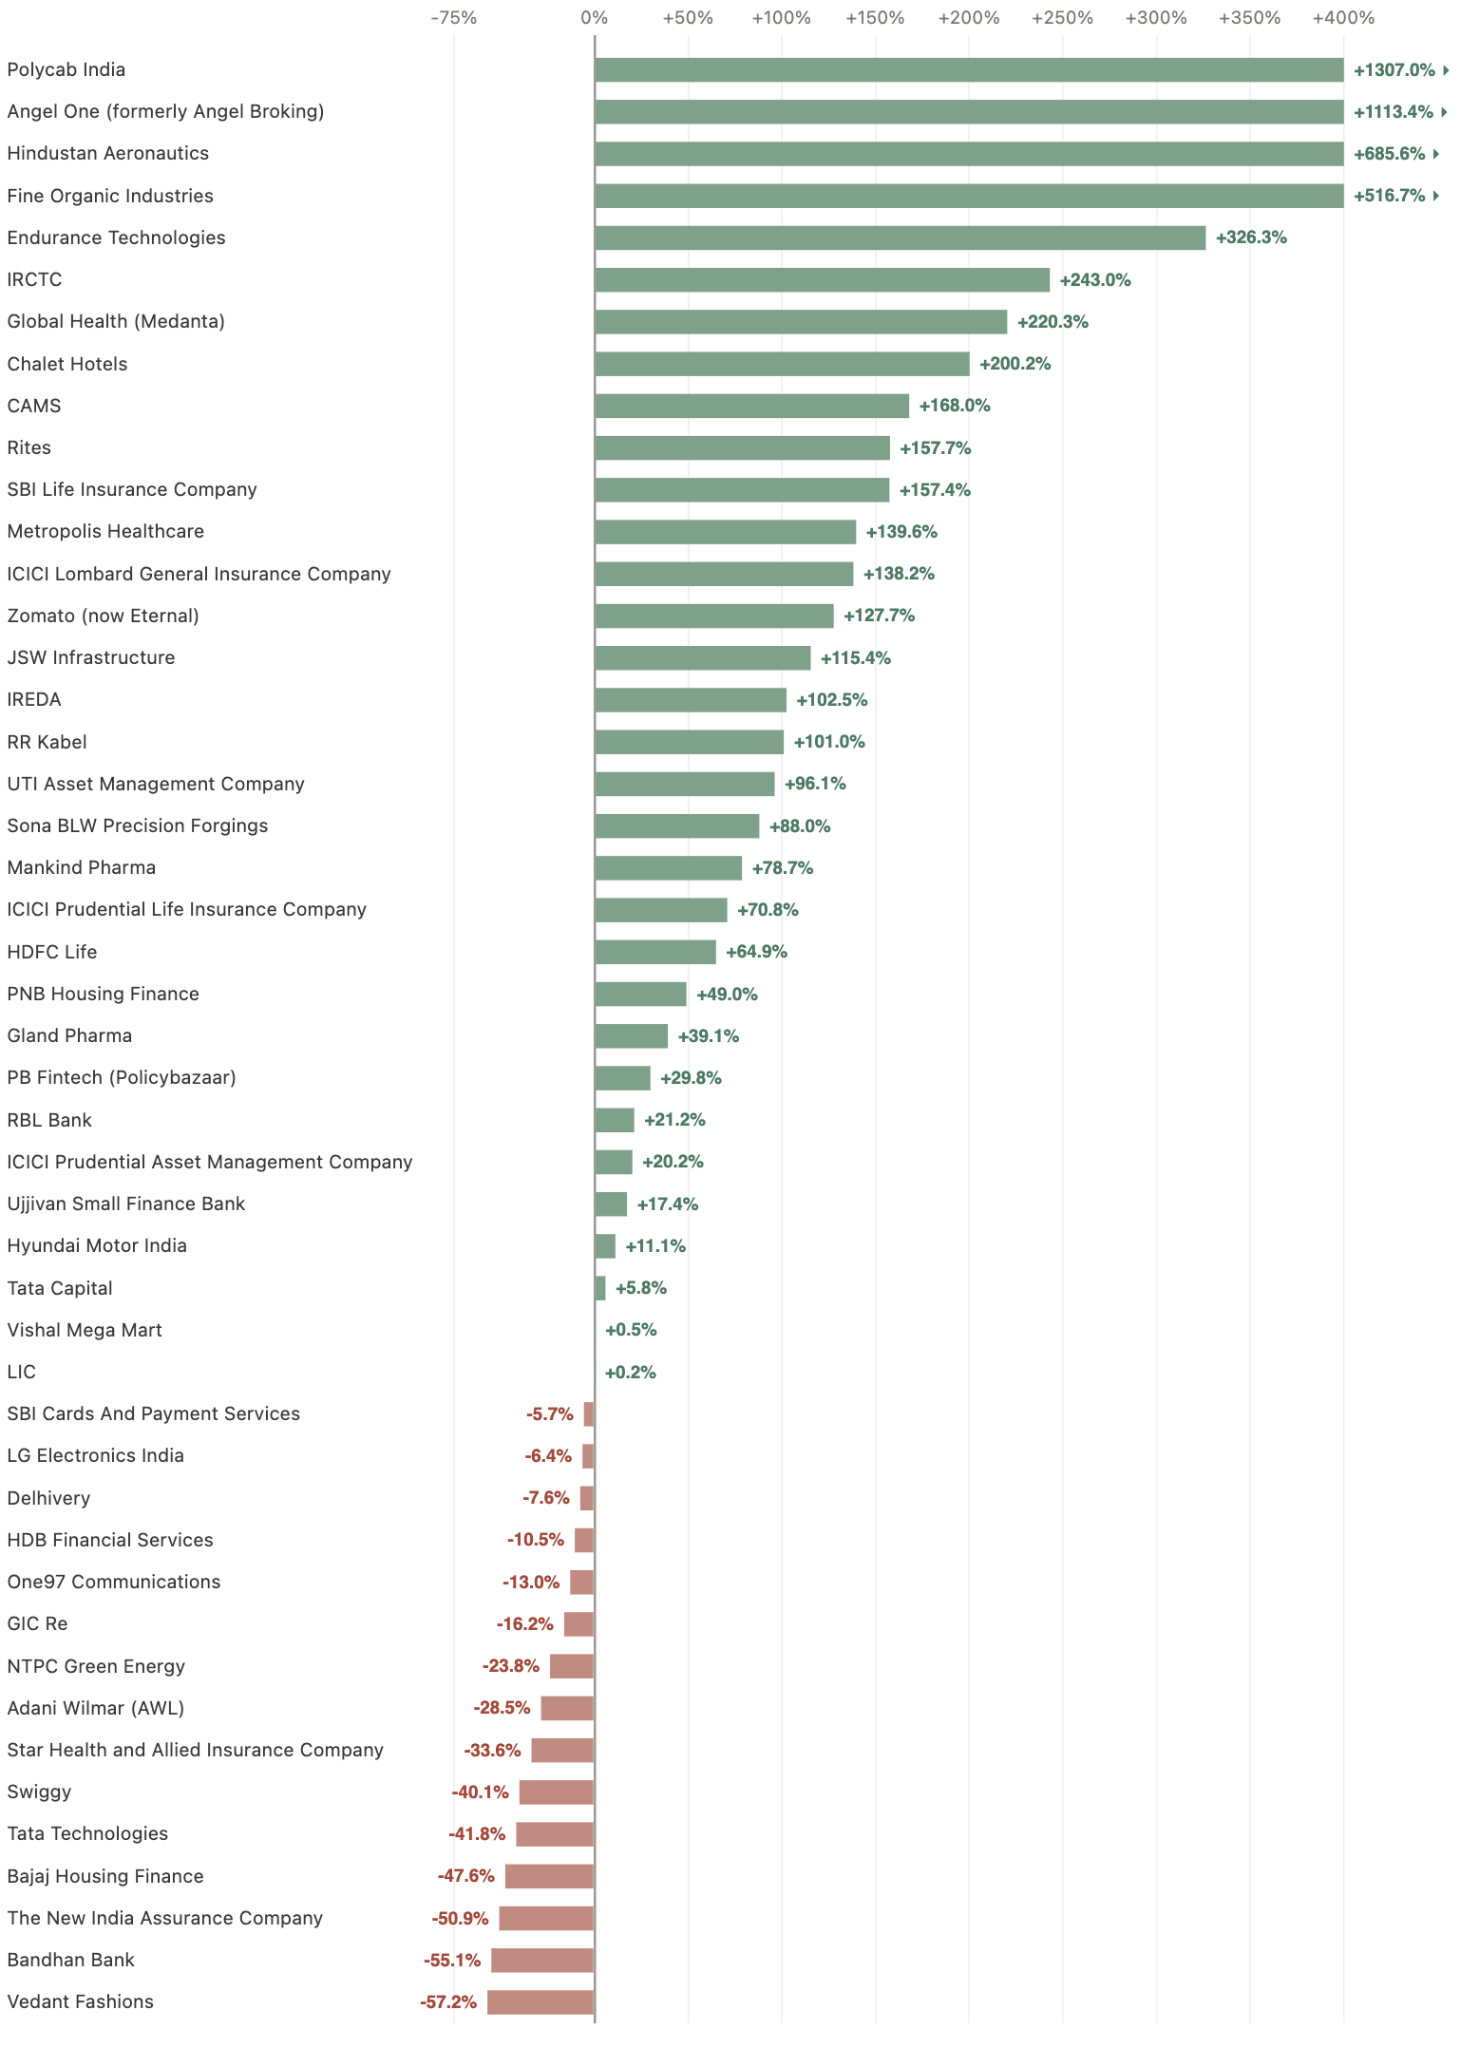
17 companies more than doubled from their listing day closing price, emerging as multibaggers. That is nearly three times the number of one-year multibaggers in our study.
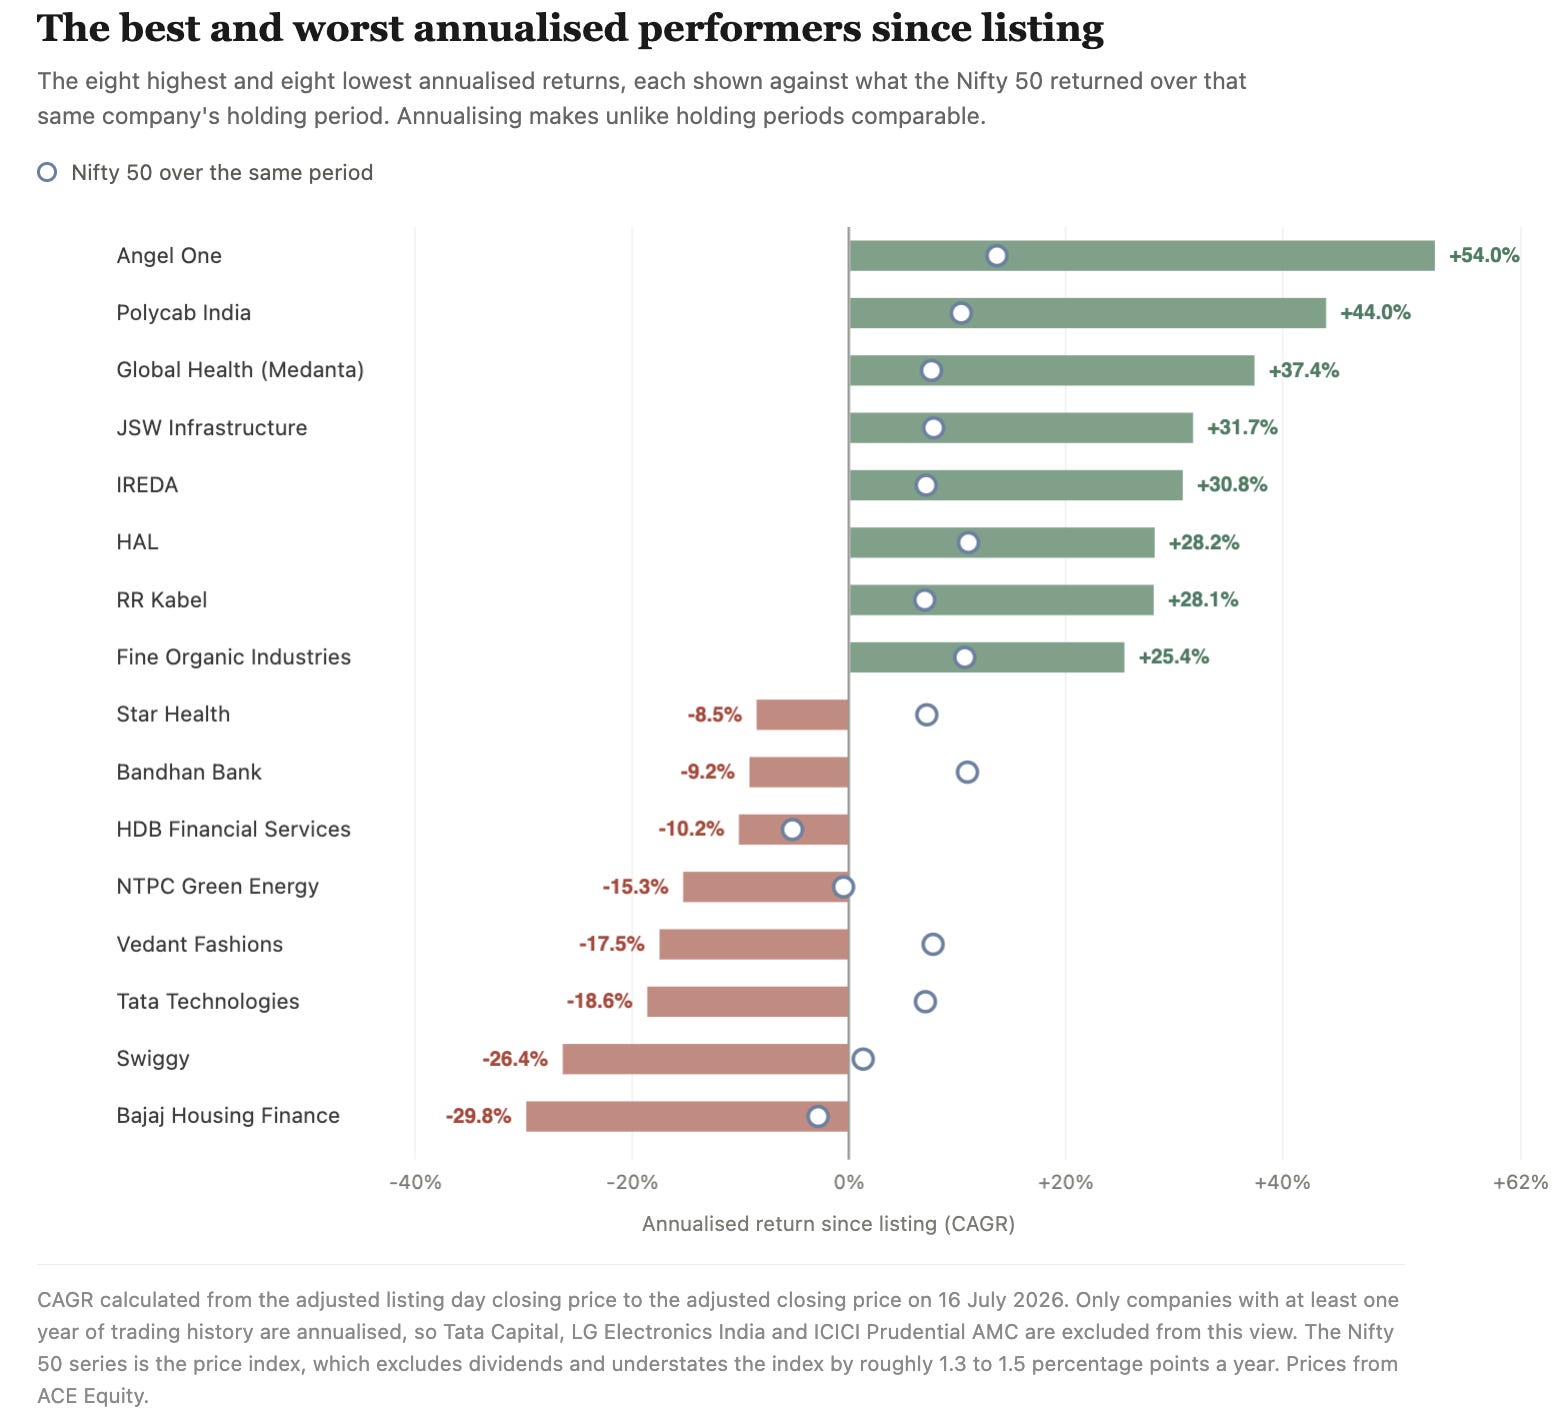
Polycab India delivered the highest return, rising 1,307.04% since listing day close. It was followed by Angel One (1,113.41%), Hindustan Aeronautics (685.61%), Fine Organic Industries (516.69%) and Endurance Technologies (326.31%).
Because these companies have been listed for very different lengths of time, absolute returns are not directly comparable. On an annualised basis, Angel One compounded at 54.04% a year over about six years and Polycab at 44.01% a year over about seven.
The number of multibaggers increased from 6 after one year to 17 after listing, indicating that the biggest wealth creators in the dataset generally took longer than one year to emerge.
This was not true for all of them though.
Despite listing at a 29.33% premium and remaining above its listing day price after one year, Bandhan Bank traded 55.07% below its listing day closing price by 16 July 2026, a fall of 9.19% a year.
Vedant Fashions, New India Assurance, Bajaj Housing Finance, Tata Technologies and Swiggy were among the other companies that remained below their listing day closing prices during the study period.
It may look like the scope for gains from bigger IPOs is higher, but that is not true for all of them. Some delivered exceptional returns while others struggled to make it past the listing day price.
But how does that compare with simply buying the index?
A company being above its listing price does not tell us whether it was worth owning. The same money in a Nifty 50 index fund would also have grown over the same years.
But simply rising above the listing-day price does not necessarily mean the IPO was a better investment. The Nifty 50 was also growing during these periods. So we also checked whether each company actually performed better than the broader market over the same holding period.
So we compared every company with the Nifty 50 over exactly its own holding period, on an annualised basis.
22 of the 47 companies beat the Nifty 50. 25 did not.
The median company compounded at 6.02% a year. The Nifty 50, over those same matched periods, compounded at 10.15% a year.
Each dot represents one company. Dots on the right beat the Nifty 50, while dots on the left underperformed it.
Over one year, the picture was better: 26 of the 44 companies beat the index.
So while a majority of these IPOs did rise from their listing day price, a majority of them still did not beat a plain index fund over the same stretch of time.
The ones that did beat it, beat it by a lot. That is what a small number of very large winners does to a set of results.
There are multiple reasons for that.
Business and earnings growth are among the biggest reasons. In other words, if the earnings kept increasing over a period of time, then the prices moved higher.
For example, real estate upcycle and government spending on infrastructure and rural electrification were among reasons that supported Polycab’s growth.
When a company delivers strong consistent growth, investors are willing to pay more for those shares.
Similarly if a sector was doing well, then the company that listed from that sector did well.
The opposite is also true.
Valuation mattered a lot too. Hyundai was perceived to be priced aggressively at the time of the IPO. Some investors waited for the shares to fall and reach a valuation where the shares became an attractive buy for them.
Another factor is the boom in Indian markets post Covid. Indian markets were in a bull run- witnessing consistently rising markets till late 2024.
So while some IPOs that listed in the period were supported by optimism, some of the IPOs that came after 2024 struggled as sentiment turned weak.
What did our study actually show?
Bigger IPOs may attract the most attention, but IPO size alone does not determine returns- neither for listing gains nor for long term gains.
This was probably the biggest takeaway from our study.
Just because an IPO made money doesn’t mean it was a great investment. Quite a few stocks went up after listing, but still couldn’t beat a simple investment in the Nifty 50.
Some IPOs turned into massive winners. Some never even got back above their listing price. And many did make money, just not enough to beat the broader market.
The interesting part is that this had very little to do with how big the IPO was.
What mattered was everything that happened after the listing. Did the business grow? Did profits improve? Was the stock too expensive to begin with? Did the company deliver on what it had promised?
So the takeaway is pretty simple.
A big IPO can create a lot of excitement. But that doesn’t automatically make it a good investment. The size of the IPO tells you how much money the company raised. It doesn’t tell you how much money you’ll make. Over the long run, what matters is the quality of the business and the price you pay for it.
Note
This study covers only the five largest mainboard IPOs from each year and is not representative of all IPOs.
IPOs were selected within each calendar year, so companies are not directly comparable by issue size across years.
Hexaware Technologies, ICICI Securities and Equitas Holdings were excluded and not replaced, leaving a final sample of 47 companies.
The study counts outcomes (such as stocks that rose, beat the Nifty or became multibaggers). It does not simulate an investable portfolio.
Listing gains assume an investor received an IPO allotment and sold at the opening price. In practice, allotment is not guaranteed.
Long-term returns are based on the adjusted listing-day closing price. Actual investor returns may differ depending on the purchase price.
Companies have different holding periods. CAGR improves comparability but does not eliminate differences in market cycles.
Only 44 companies had completed one year of trading by 16 July 2026, so one-year analysis excludes the remaining three.
A few exceptional performers can skew overall results. Most IPOs did not generate multibagger returns.
Nifty comparisons use the Nifty 50 Price Index (not TRI). Dividends, brokerage, taxes and other transaction costs are excluded.
The study is descriptive, not causal. It does not identify why certain IPOs outperformed or underperformed.