

600 years ago, Europeans began sailing across the globe, slowly conquering the world and forming chapters of history textbooks.
But their voyages were more of a necessity than adventure back then.
Europe was suffering from a massive trade deficit.
Toll taxes by the Ottoman empire, through which crucial imports like spices and textiles had to pass, combined with multiple middlemen on the route caused a dramatic increase in costs making the deficit worse day by day.
Europeans desperately needed more gold, more silver, and more spices to sustain their economy, and they were running out of it fast.
(spices were a very valuable commodity, almost used as a currency back then)
One thing was clear though, relying on the local economy was not sustainable, and going beyond the borders was inevitable.
By starting pan world voyages, Europeans ‘sort of’ attempted to diversify from their local economy by bringing in wealth & resources from other countries.
And as history shows, it worked out pretty well for them.
Today, 600 years later, if you wish to expand beyond local markets and economy as an investor, the option is literally at your fingertips, much easier than fighting sea-sickness for months.
Still, expanding in markets beyond India is quite a rare thought even among many regular SIP doing folks.
But to try & understand whether investing abroad could make sense or not for an average Indian investor, we tried comparing India with the US, China, the UK, and Germany, the largest global economies.
To begin with, the stock market of these countries gave the returns as follows in the last ~15 years:
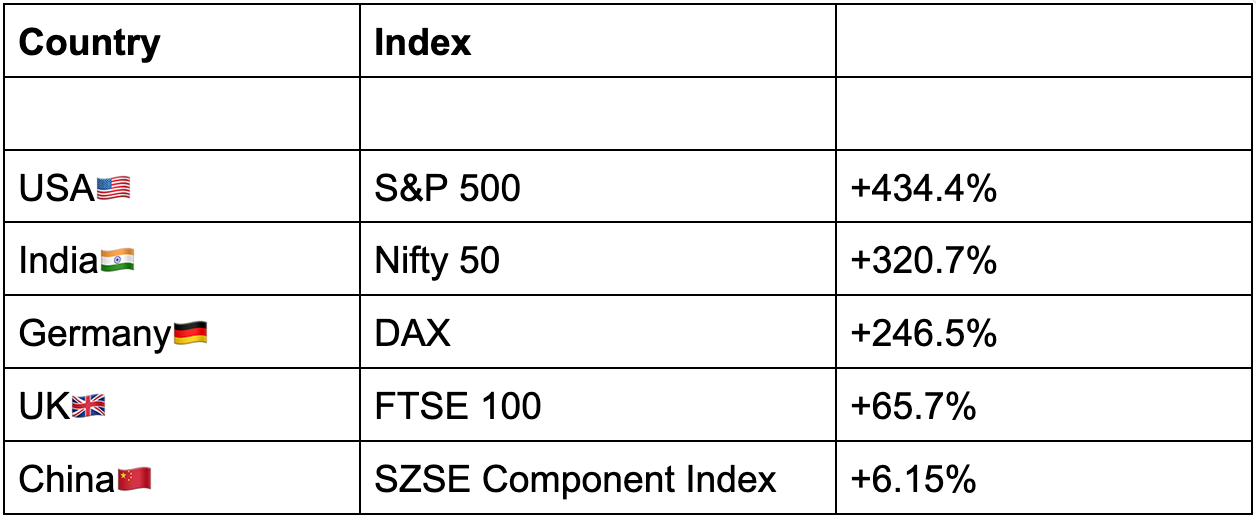
(for period between 31-Dec-2010 to 17-Dec-2025)
So we ran a simulation of monthly SIPs of ₹10,000 in all these indices for 180 months, by opting for their respective ETFs.

The SIP amounts were converted into the respective country’s local currency using the exchange rate effective on the day of the transaction.
For example, for the first ₹10,000 SIP in S&P 500 on 3 Jan, 2011, the exchange rate was ₹1 = $0.0223, hence we invested $223(10,000 x 0.0223) as the first SIP in the Vanguard S&P 500 ETF.
By doing so, we spent 18 Lakh equivalent Indian Rupees on each ETF over a period of 180 months.
And the result we found is as follows:
Returns in Local currency:
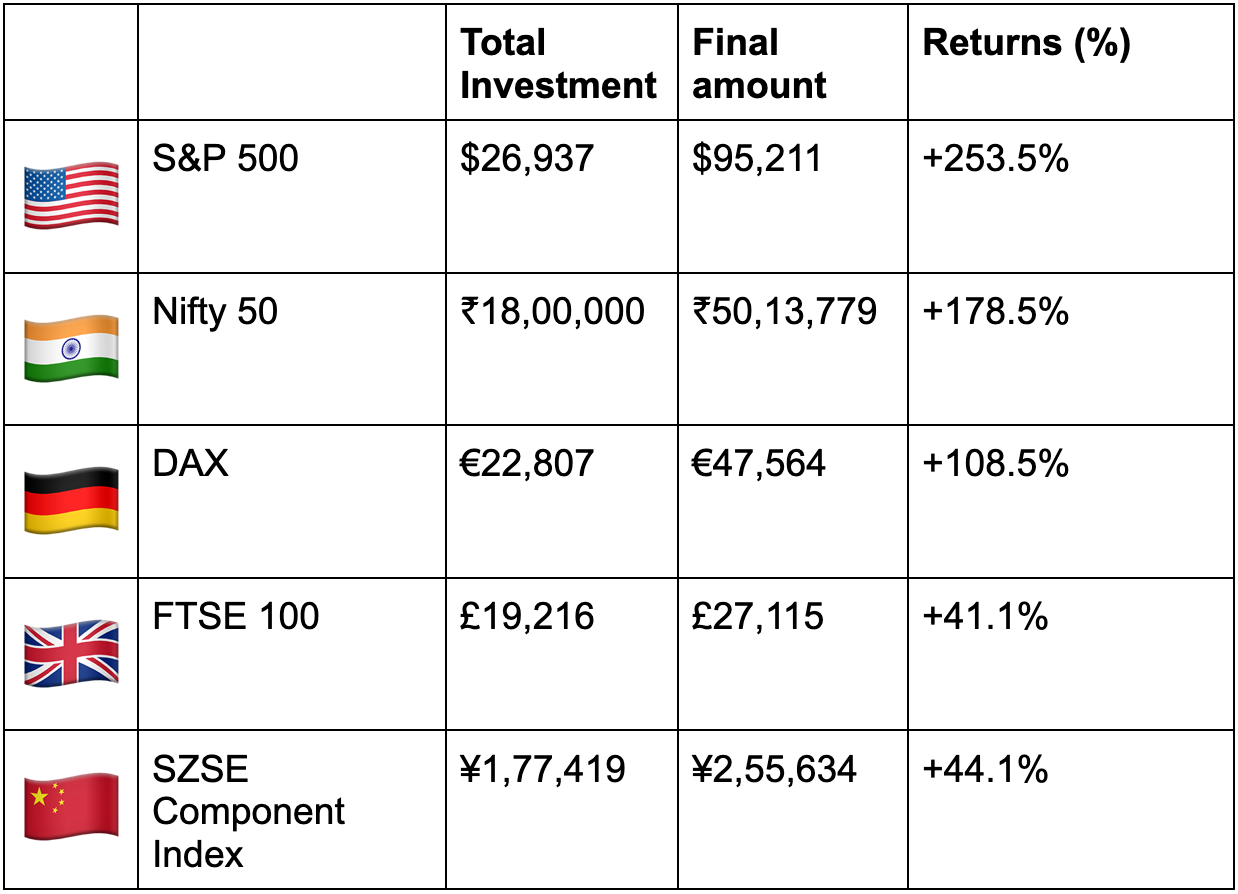
(Returns as of 17 Dec 2025)
But wait, things take a turn when we convert the final amount to INR.
Return in Indian Rupees:
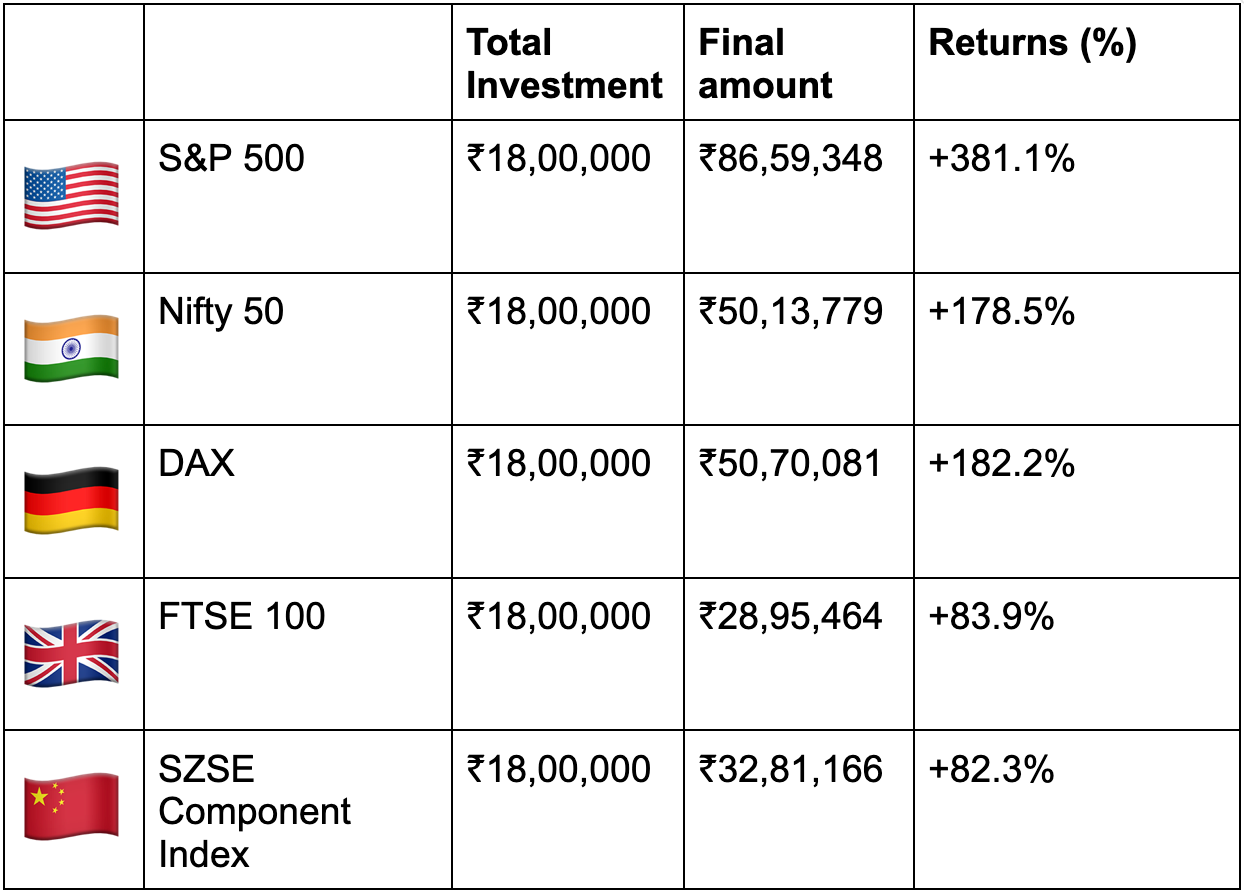
(Returns as of 17 Dec 2025)
The difference between local currency returns and when it is converted to Indian Rupees is substantial.
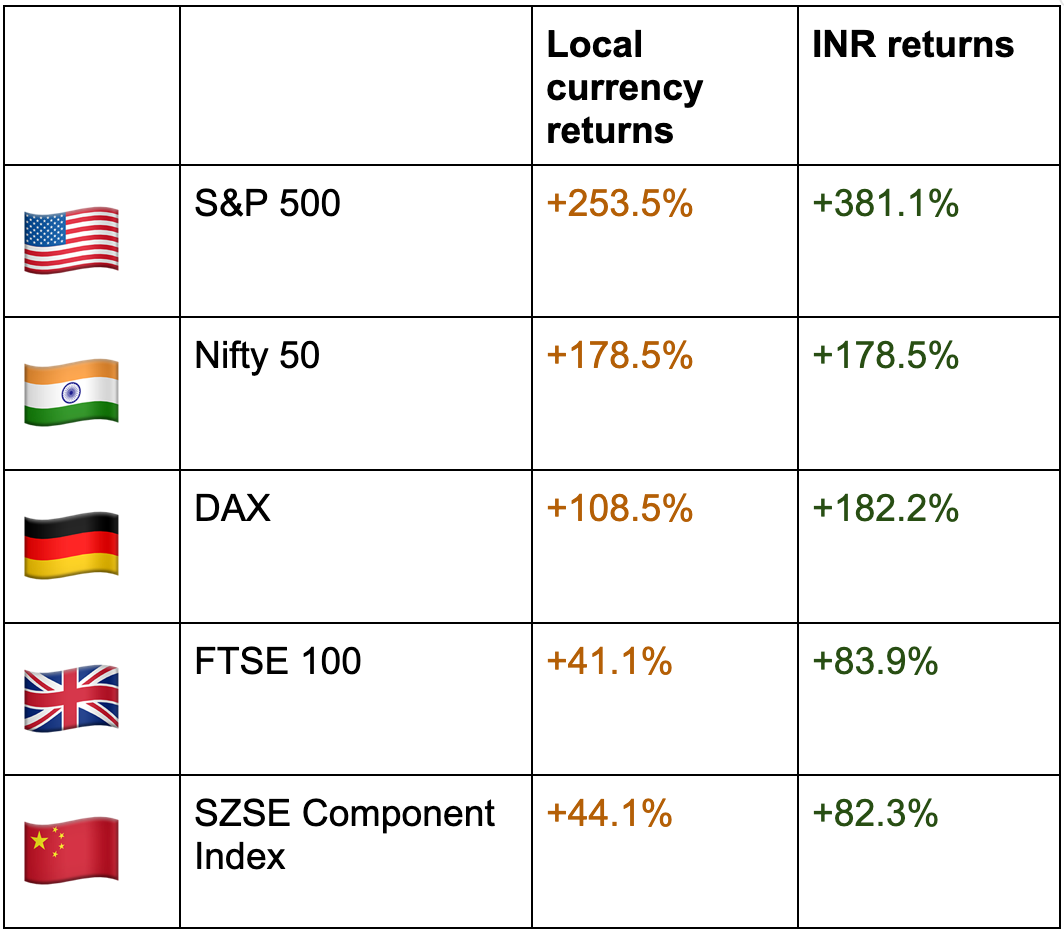
When currency conversions are factored in, the real returns change significantly, illustrating the impact of the fall in Indian Rupee.
For example, Germany’s DAX gave a return of 108.5% when calculated in Euro, much less than Nifty 50 (178.5%) during the same period.
But when we convert the DAX final return from Euros to INR, it exceeds Nifty with 182.2% returns.
This highlights Indian Rupee has immensely depreciated with respect to currencies of some other big economies in the world.
Over the considered timeline, the decline in the Indian Rupee has affected the real returns of the Indian market compared to foreign markets.
Reason being as shown below, as INR has lost more than 40% of its value from 15 years earlier.
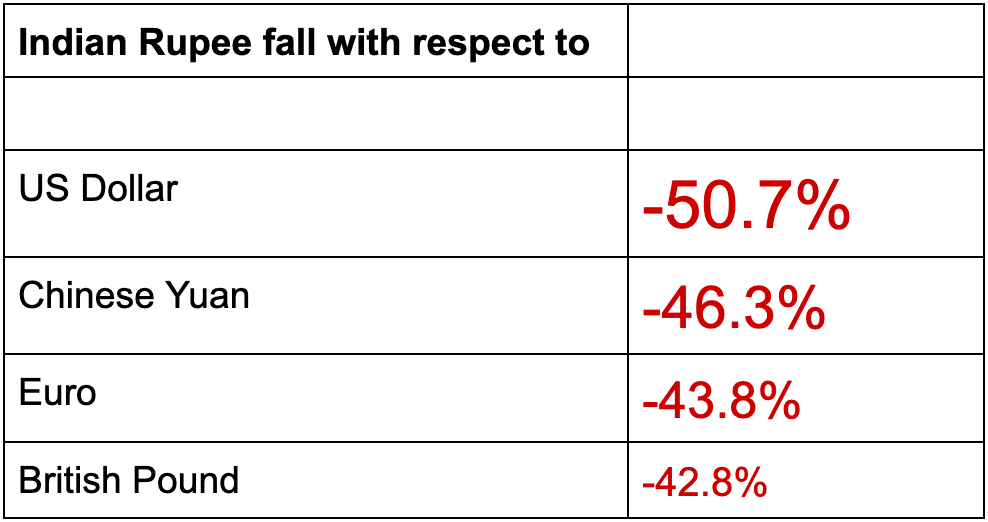
(for period between 31 Dec 2010 to 17 Dec 2025)
After taking a look at these numbers, it may seem fairly logical to many for considering evaluating foreign markets for diversification purposes.
Especially for offsetting currency drawbacks in the Indian market, right?
But do note, the analysis shown above is a result of past data, and no similar trajectory or returns can be guaranteed in future.
Also, the analysis did not account for regulations, taxes, forex, or transaction costs, and these factors can affect foreign investments to a huge extent.
But like always, it was nothing but an attempt to scratch our heads over a very unlikely scenario, but do let us know what you felt, and hit us with some more ideas that you wish for us to try in the next ‘What If?’.
Note:
The result of the simulation could turn out to be different from what we have found if a different timeline or some other ETF is chosen for comparison.
The data used for the simulation has been sourced from Yahoo Finance.
For simpler calculation and to keep in line with the broad idea, we have considered fractional ETFs in this simulation.
I wish you had mentioned the ways to invest in foreign markets at the end of the article.
A value addition to this research could be done by calculating and subtracting from the gains earnt currency conversion charges, LTCG, TCS for LRS and any other charges involved so as to provide an even more precise picture, for redemption date 17 Dec 2025