

Deciding the optimal path for our individual investment journey is somewhat complex. Should we let our portfolios go heavy on equity? Or should we include other assets like commodities or debt? And if so, then by how much?
These are some very basic questions that keep us confused forever. But let us try to figure a way out in this short article.
What if you can exactly see the returns from all the broadly possible allocation strategies?
A broad analysis of different allocation ratios of equity, debt and commodity (like gold) in a long term portfolio with monthly SIPs would give us some clarity to make a preliminary decision.
This is exactly what we did to see what will be the ideal allocation of equity:debt:gold by taking all possible iterations like:
Equity : Debt : Gold (%)
80:10:10
60:20:20
30:50:20
And more…
To keep it simple and easy to understand, we took allocation percentages in multiples of 10, and we found 66 such iterations (including allocations where equity is 100/0% or debt is 100/0% or gold is 100/0%).
We considered Rs 50,000 as the monthly SIP amount starting from Jan 2010 and the last SIP in Dec 2024. This Rs 50,000 will be divided in every possible ratio.
For example, for an equity:debt:gold ratio of 60:30:10, the Rs 50,000 SIP will be divided as Rs 30,000 for equity, Rs 15,000 for debt, and Rs 5,000 for gold. This would be one iteration for the entire period of Jan 2010 to Dec 2024.
The same process will be followed for all 66 possible allocation ratios to study different risk vs return portfolios.
The entire investment each month for the said period comes to a total of Rs 90,00,000.
We took the following investments options:
For equity: UTI Nifty 50 Index Fund - Growth (Regular)
For debt: ICICI Prudential Bond Fund - Growth
For gold (or commodity): Nippon India ETF Gold BeES
For clarity, we categorized the allocations into 3 broad categories:
Safety-First = Equity allocation < 40%
Balanced = Equity allocation 40 - 60%
Aggressive = Equity allocation > 60%
We did this entire analysis and found some interesting conclusions.
Here are the maximum and minimum gains/returns that we found out across the 3 categories:
Safety-First:
Minimum Gain = Rs 73.8 lakh
Maximum Gain = Rs 1.25 crore
Balanced:
Minimum Gain = Rs 1.13 crore
Maximum Gain = Rs 1.45 crore
Aggressive:
Minimum Gain = Rs 1.42 crore
Maximum Gain = Rs 1.71 crore
The maximum returns were found for the ‘Aggressive’ category with the highest return given by 100% allocation to equity.
You can see all the returns from this sheet, ranked from highest to lowest:
What if you invested mostly in Gold or Equity or Debt?
Now take a look at the table below with some example allocations:
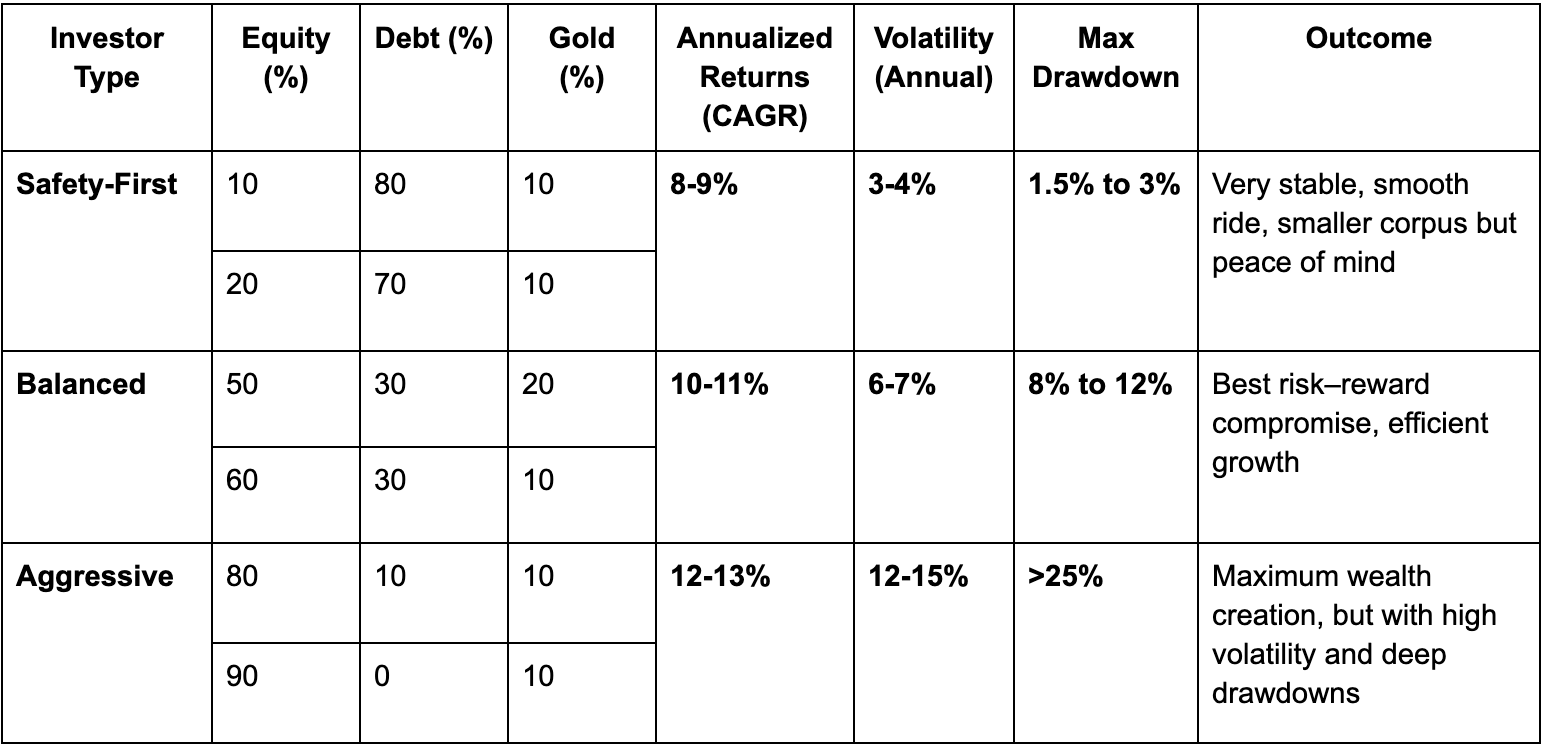
For those who like to play it very safe, portfolios heavy towards debt (say, 10% Equity + 80% Debt + 10% Gold or 20 Equity % + 70% Debt + 10% Gold) delivered around 8-9% annualized returns. The ride was extremely smooth with hardly any volatility or meaningful drawdowns. Of course, the final corpus was smaller compared to equity-heavy portfolios, but the comfort of stability was unmatched.
Balanced allocations turned out to be a sweet spot. Portfolios like 50% Equity + 30% Debt + 20% Gold or 60 Equity + 30% Debt + 10% Gold consistently showed 10-11% annualized returns, with volatility staying in a manageable 6-7% band. The maximum drawdowns were also moderate, which means these allocations offered the best trade-off between growth and safety. For a majority of long-term investors, these are likely the most ‘efficient’ choices.
On the aggressive side, equity-dominated portfolios like 80% Equity + 10% Debt + 10% Gold and 90% Equity + 0% Debt + 10% Gold topped the charts with 12-13% annualized returns. The final corpus easily crossed Rs 2.4 crore against an investment of Rs 90 lakh. But this came at the cost of much higher volatility (12-15%) and deep drawdowns of 25% or more. These are the wealth-maximizing paths, but only suited for investors who can stomach large swings and stay invested through the rough patches.
Here is a much nuanced table showing the ‘Risk vs Return’ for different types of allocation strategies:
We marked all the strategies based on their annualized returns or CAGR and their annualized volatility, which how much your investment could fluctuate in a year.
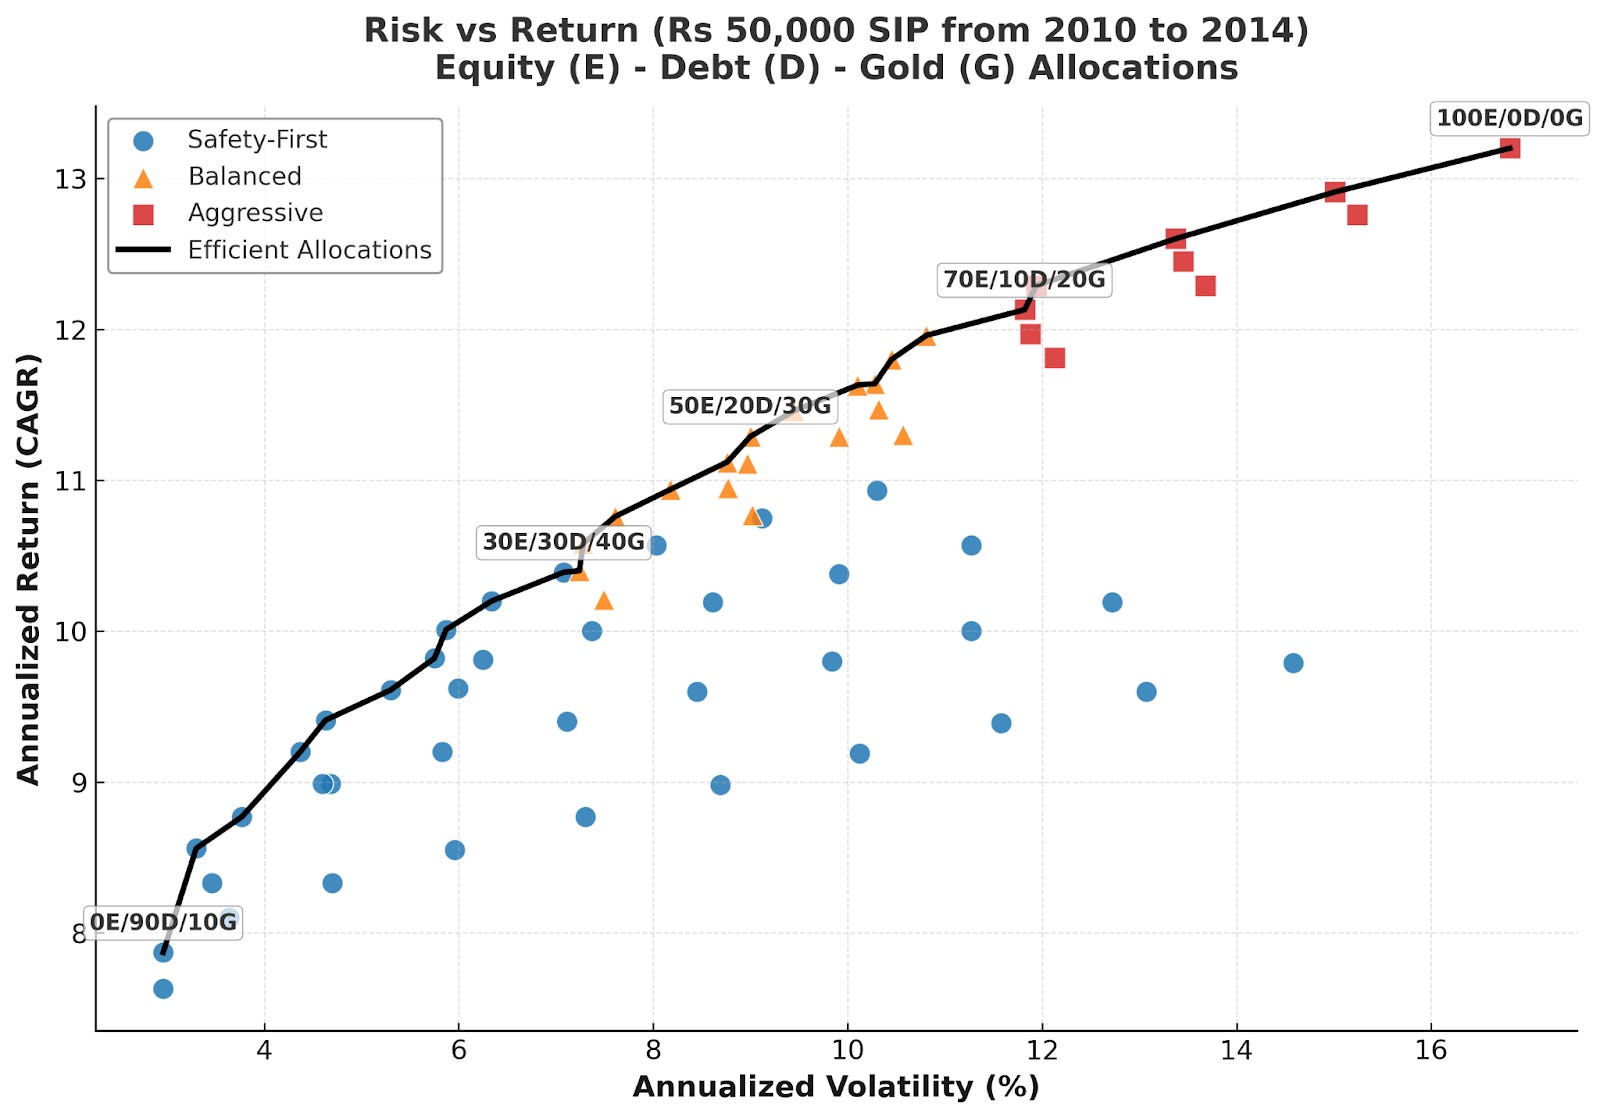
As you can see from the above graph, some of the safety-first portfolios turned out to be outliers. These were the gold-heavy allocations with very little equity or debt. While they technically fall under ‘low equity’, their returns were far more volatile than debt-heavy mixes. This shows that not every low-equity portfolio is automatically stable. Gold-heavy ones behave very differently. So while you can include gold in your portfolio to diversify, it can also lead to higher volatility. On the other hand, if you use debt to diversify, it can lead to very low returns.
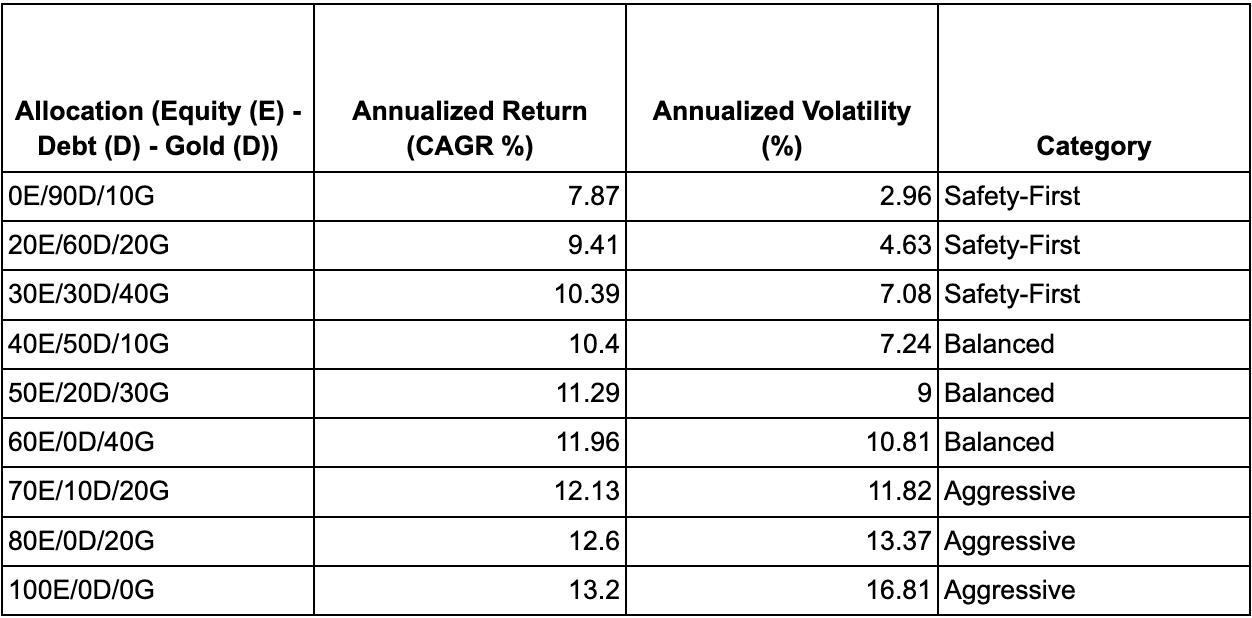
We can see a black line joining running through the graph which is labelled as the “Efficient Allocations”. These are the allocations which gave the most returns for the same level of volatility. Some of the efficient allocations are shown in the table below:
All of this shows that there is no single ‘best’ allocation. The best depends on who you are as an investor. If you want peace of mind, debt-heavy portfolios work. If you want balance, mid-equity allocations deliver the best efficiency. And if you want maximum growth, equity-only will get you there but provided that you can endure the ride.
And the type of investor you are can also change with time. If you are in your early 20s to 30s, you might be able to take advantage of higher risk, higher return portfolios. While someone in their late 50s might prefer lower growth with lower risk. So this judgement of the risk-appetite that you have is crucial for a successful investment journey.
Here is the link to the full conclusion of the analysis containing each of the 66 iterations arranged in the order of highest gains to the lowest:
What if you invested mostly in Gold or Equity or Debt?
very interesting
hi