

In the stock markets, the first thing an investor notices is the price.
A stock is up, or down and that’s what grabs attention.
But alongside every price move, there’s another number quietly changing in the background: trading volume.
Trading volume is the total number of shares being bought and sold on a particular day. It shows how active a stock really is. Whether everyone is piling in, or if the price is moving with just a handful of traders.
The general assumption is that a significant price increase on high volume indicates a strong trend, while a move on low volume is a ‘fake-out’.
So we decided to look at volume and price together. Does one move before the other, or do they just react at the same time? How do they react during significant rises and falls?
The Experiment
We looked at the trading volume and price data of the biggest 3 stocks of the Nifty 50:
Reliance Industries
HDFC Bank
Bharti Airtel
Together, these stocks themselves account for more than 20% of the index weight. If these giants move, their effects can be seen on the stock markets.
We looked at data in a 3 year time frame from 20 March 2023 to 20 March 2026.
Simultaneous Moves
Do volume and price move together?
We looked at the days when the stock price went up or down and found out the number of days when the volume followed the same trend.
There were 746 total trading days in the dataset, but the days where the market was flat have been excluded.
Here is what we found:
Reliance Industries
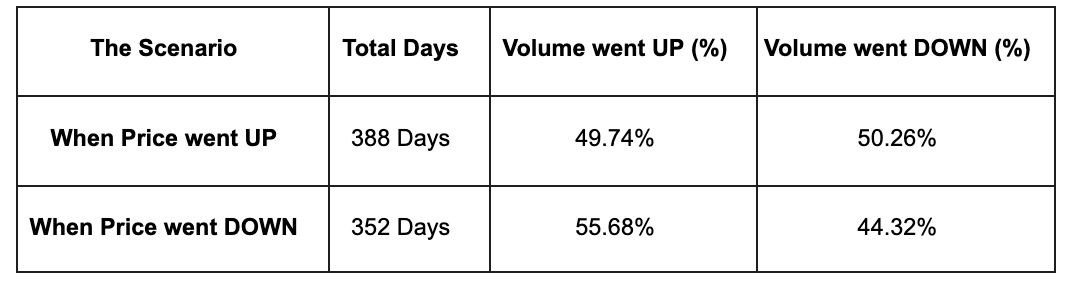
Here, rises in stock prices are almost equally likely to have rising or falling volume, while price drops more often attract higher trading activity, though not by a lot.
HDFC Bank
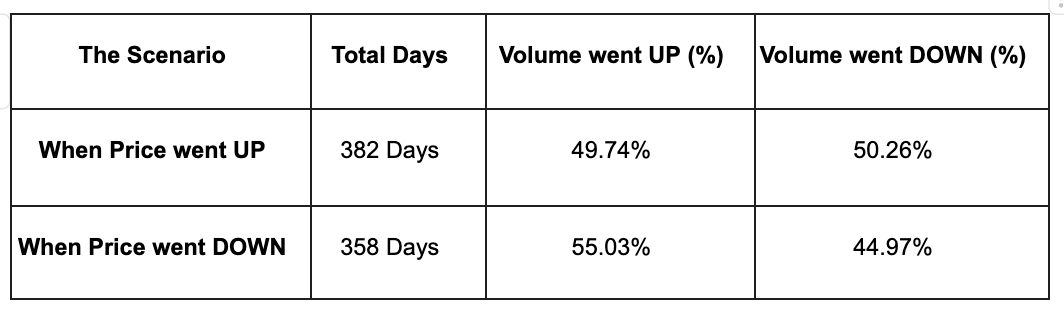
HDFC Bank data shows a similar trend to Reliance. Rising prices show no clear volume pattern, but declines generally see more traders stepping in.
Bharti Airtel
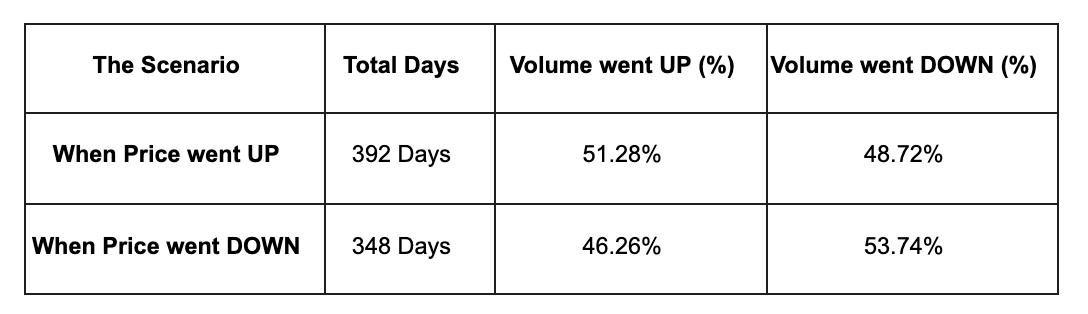
Here, rises in stock prices are often (more than 50%) supported by higher volume, while price drops mostly occur on lower volume activity.
The tables show that the chance of price and volume moving in the same direction hovers around 50% for the 3 stocks.
Rising prices are just as likely to occur on falling volume as on rising volume, and the same goes for price declines. This means that volume does not consistently confirm price moves, and there is no clear evidence that one leads the other.
From this dataset, we cannot conclude that price or volume reliably signals the next move.
Top Gains and Losses
We looked at the top gains and losses faced by these stocks during this 3 year period.
How did the trading volume affect or get affected by these gains and losses?
Reliance Industries
Reliance saw the highest gain of 7.02% in Jan 2024.
During that day, the trading volume increased by around 102.3%
But neither the stock price or the volume showed any kind of rising trend over the next few days
Reliance also saw a loss of almost 7.81% in July 2023. But the trading volume did not show any significant change, rising 7.22%.
There was also a fall of 49.76% in a day in Oct 2024 which was due to the issue of bonus shares. During the day, the trading volume rose 16%.
Surprisingly, on the day the trading volume rose the highest (almost 2500% in a day), the change in stock price was only 0.09%, essentially flat.
HDFC Bank
HDFC Bank saw its highest gain in the data set in June 2024 of 4.63%.
The trading volume fell by 8.82%, though not a significant change.
The stock saw its highest fall of 5.32% in March 2026 during which the trading volume rose 630.15%.
The Bank issued bonus shares in Aug 2025, which made the stock fall 50.44% in a day. The trading volume was significantly high, a 93% rise in a day.
Here too, when the trading volume saw the highest rise at 4040.5% the stock price did not change much, falling 0.49%.
Bharti Airtel
Airtel saw its highest gain in a day in July 2024 of 4.50%
The trading volume saw a gain of 123.6%. The price rise did not show the same trend afterwards.
In June 2024 Airtel saw a one day loss of 6.57%. The trading volume saw a rise of 231% that day.
The stock price rose in the days following that.
Here too, in the highest volume change in the data set of 4280% in march 2024, the stock price did not show any major change, rising only 0.24%
What’s the Verdict?
Our three-year study reveals a simple but important truth: volume does not consistently predict price movements.
Across the dataset, the chance of price and volume moving together hovers around 50%. Rising prices can occur on falling volume, and declines can happen without massive trading activity.
Looking at extreme moves reinforces this insight.
Some of the largest gains happened on low or declining volume, showing that price can climb quietly when sellers step back.
Conversely, massive volume spikes (even up to 4,000% in a single day) often resulted in little or no price change, which shows that institutional block trades do not reflect market sentiment.
Price drops, however, did tend to coincide with higher volume, suggesting that panic or urgent selling drives activity more than gradual accumulation.
In short, volume measures liquidity and intensity, not direction.
It can provide context, but it cannot reliably confirm trends or predict the next move.
More in-depth statistical analysis might reveal some insights, but for common investors More in-depth statistical analysis might reveal hidden insights, but for common investors, the lesson is straightforward: quiet moves are not necessarily fake, and loud volume surges are not always meaningful.
Limitations of the Experiment
While our study gives useful insights, it has some boundaries:
Limited Sample: We only analysed the big 3 stocks: Reliance, HDFC, and Airtel. Smaller or mid-cap stocks may behave differently, and volume might matter more for them.
Timeframe Bias: The study covers 2023-2026. Market behaviour can change in different cycles, like bull markets or recessions.
Block Deals: Daily volume doesn’t separate retail trades from institutional block deals. Huge spikes (like 4000%) often reflect pre-arranged trades with no real market impact.
External Factors Excluded: We only looked at price and volume. Global news, earnings, or policy changes can override technical patterns.
Corporate Actions: Some big price drops (like 50%) were due to bonus issues. Without context, raw data could mistakenly flag these as crashes.