

24 March 2020.
India announced a nationwide lockdown because Covid-19 was spreading.
For the next 21 days, people were told to stay at home and almost everything except essential services was shut. The lockdown was later extended as well.
But almost immediately after it was announced, there was another problem to deal with.
Money.
People’s cash flows were getting disrupted. Businesses were shut, people couldn’t go to work, and nobody really knew how long all this would continue.
Some estimates say around 12.2 crore jobs were lost in April 2020 alone.
When work stops, income can stop too.
But the money coming into a household is usually already allocated every month, be it groceries, medical bills, education, EMIs and savings.
Everything has a certain amount of money assigned to it.
And for many investors, one part of those savings could be an SIP. We will come to that in a bit.
Since it was the government that imposed the lockdown, the government also had to think about what would happen to people who suddenly couldn’t make their regular loan payments.
Just three days after the lockdown announcement, the RBI allowed banks and other lenders to give borrowers a three-month moratorium on loan installments due.
Basically, you could delay your EMIs.
It was not waived off. You still had to pay it later, and interest continued to build.
But the important part was that delaying those payments would not be treated like a normal loan default or hurt your credit score.
And this wasn’t only a problem for daily-wage workers or small-time traders. Around 1.78 crore salaried workers were also estimated to have lost their jobs in April 2020.
Now think about salaried workers who had been investing part of their salary every month through an SIP.
SIP (Systematic Investment Plan) is simply a way of investing a fixed amount regularly into a mutual fund. Maybe it is Rs 5,000 a month. Maybe Rs 10,000.
If you were investing Rs 10,000 every month through an SIP in a situation like 2020, it would have been quite natural to think to just stop the SIP for a moment.
That Rs 10,000 could stay as liquid cash in the bank for a medical emergency, a problem with your salary or some other unexpected expense; you had a little more cash available.
You could always restart the SIP once things became normal again, right?
This pattern could be noticed in the SIP data around the lockdown period.
According to AMFI data, monthly SIP contributions fell from Rs 8,641 crore in March 2020 to Rs 8,123 crore in May.
Of course, we cannot say that this entire fall happened because people were struggling financially. SIP contributions can change for many reasons.
But the bigger point is that 2020 gave people a very real reason to think about stopping.
And Covid was obviously an extreme example. Life can give you much smaller reasons to miss an SIP too.
Maybe your salary comes late. There is a wedding in the family. You change jobs. The car needs repairs. Or maybe you invest manually every month and simply forget once in a while.
Sometimes there isn’t even a financial emergency. The market falls, your portfolio is in red, and you think, ‘Maybe I’ll just wait for a couple of months before putting more money in.’
And that got us wondering about something. What actually happens if you miss your SIP?
This question probably matters to more people today than it did in 2020.
Why?
Remember that Rs 8,123 crore monthly SIP number from May 2020?
By August 2026, monthly SIP contributions had increased to Rs 32,297 crore (almost 4X)
India now has around 10.75 crore SIP accounts, and more than 10 crore of them invested in August 2026 itself.
That is a lot of people investing every month. And obviously, not everyone will manage to do it perfectly every single time.
So we wanted to know what happens if you miss some of your SIPs?
That is what we decided to test.
The Study
We wanted the result to depend on the investor, not on whether a fund manager happened to make good or bad calls.
So we used the UTI Nifty 50 Index Fund (Direct Plan, Growth). It is the oldest Nifty 50 index fund in India and simply tracks the Nifty 50. Since direct plans started in January 2013, our main study runs from January 2013 to September 2026.
Then we created five types of investors.
All of them invest Rs 10,000 on the 1st of every month in the same fund. If the 1st is a holiday, the SIP goes in on the next working day.
What changes is how regularly they invest. One investor never misses an SIP. The next three miss 1, 2 or 3 SIPs every year. The last investor takes one continuous break from investing.
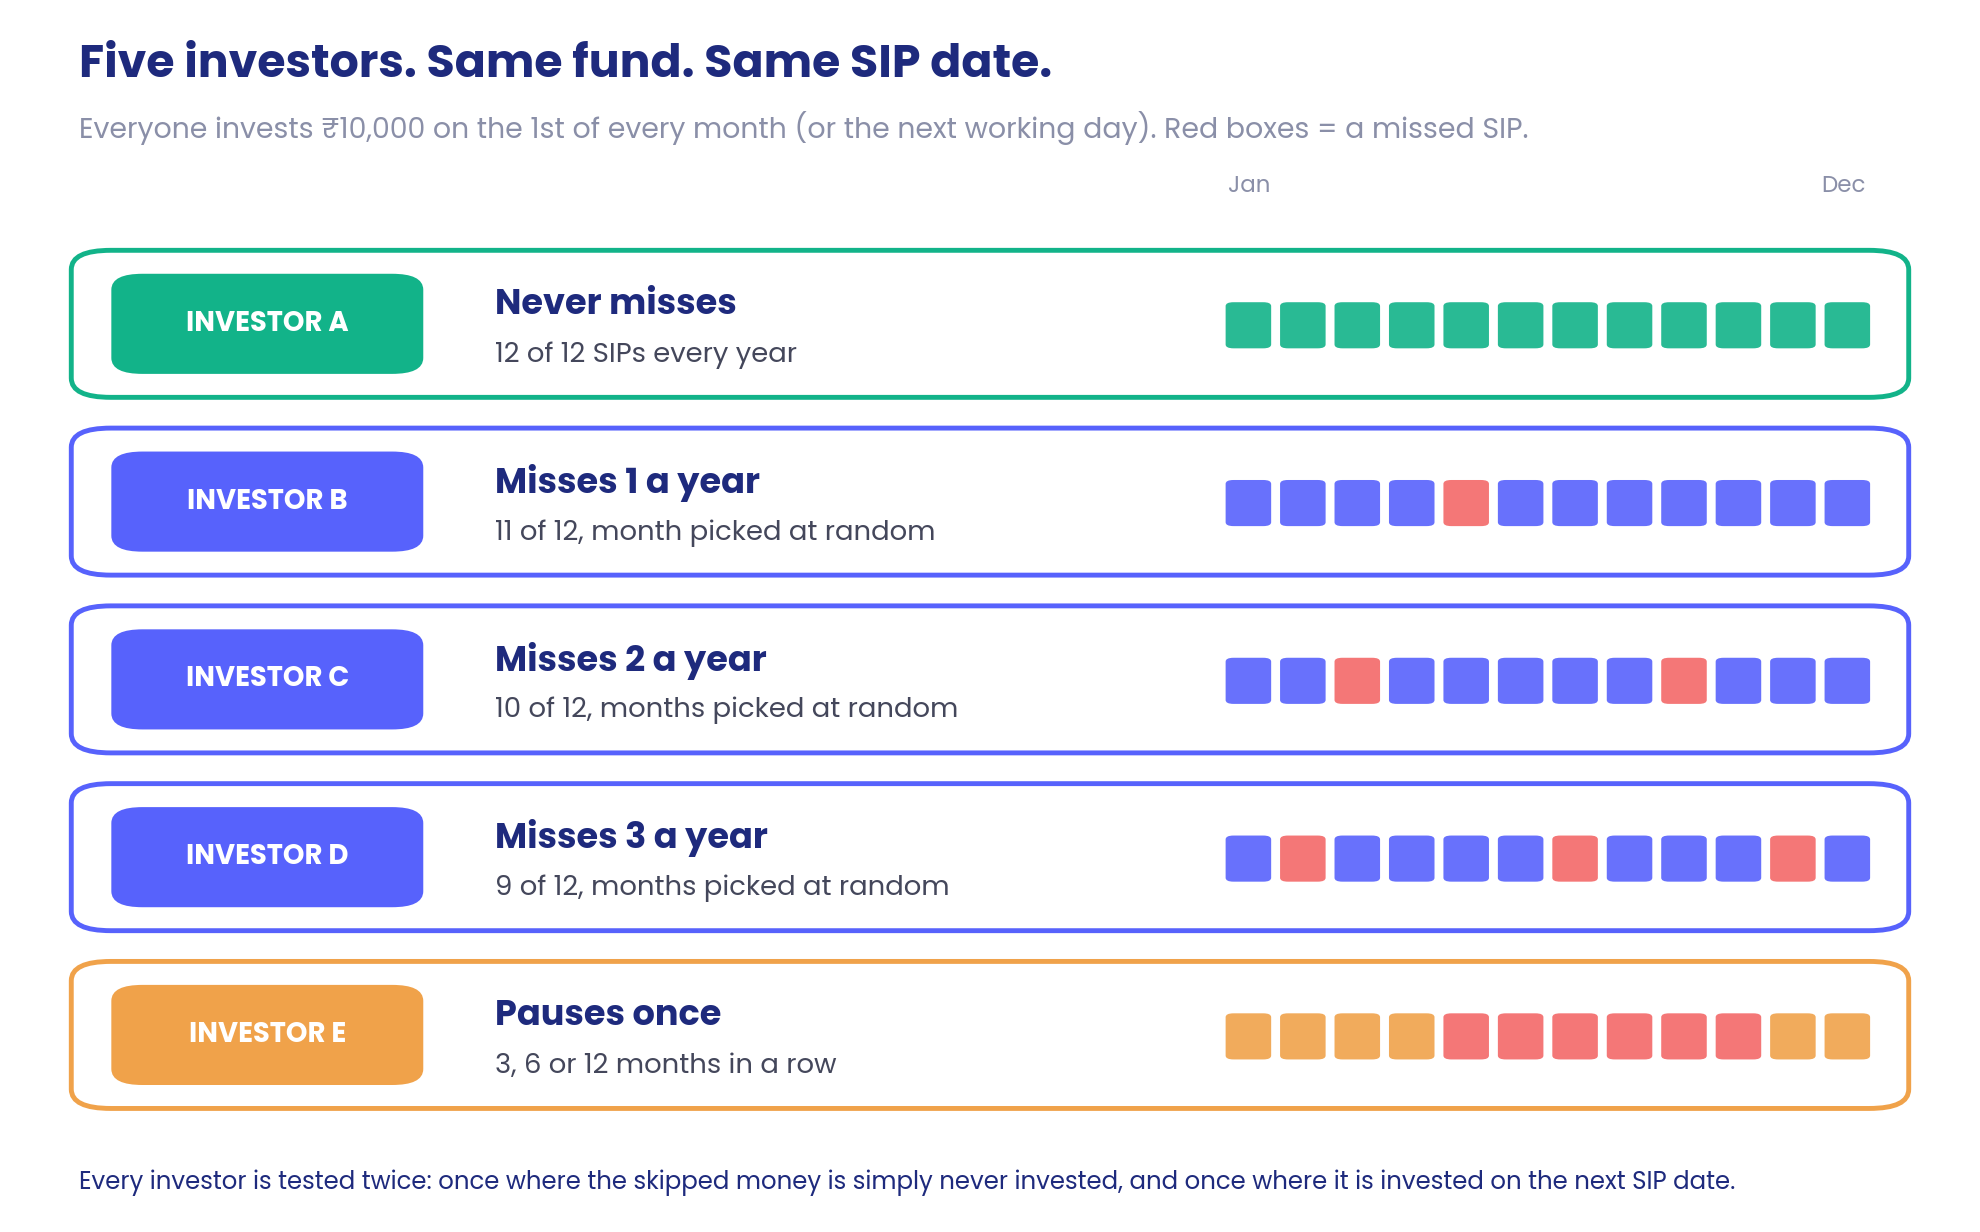
Each small box represents one monthly SIP. A coloured box means the Rs 10,000 was invested, while a red box means that SIP was missed.
In the first four rows, the SIPs are either never missed or missed 1, 2 or 3 times a year. The orange row is different: here, the investor stops investing completely for a while.
We tested pauses of 3, 6, and 12 months and tested what happened when that pause came at different points in the investment journey.
For investors missing 1, 2 and 3 SIPs a year, we did not choose the months ourselves. That could bias the result depending on whether those months were good or bad for investing.
So we let a computer pick the missed months randomly and repeated this 2,000 times for every starting month.
We also did not want the result to depend on someone who happened to start investing in one particular month.
So we tested every possible starting month. That gave us 153 one-year SIPs, 129 three-year SIPs, 105 five-year SIPs, 81 seven-year SIPs and 45 ten-year SIPs.
Finally, we tested what happens to the missed money in two different situations.
In one, the money is never invested at all.
In the other, the investor catches up later. If one monthly SIP is missed, that Rs 10,000 goes in on the next SIP date. If the investor takes a longer pause, all the missed installments are invested together when the SIP restarts.
We also ran one separate test later in the study.
What if the SIP is not missed randomly, but because the market has fallen?
For that, we created an investor who skips the SIP whenever the fund is 10% or more below the highest NAV it had reached till then, and starts again only after it recovers to within 10% of that level.
We wanted this test to include crashes such as 2008, so we used the Regular Growth plan of the same UTI Nifty 50 Index Fund from 2002 onwards, since Direct plans did not exist that far back.
The Results
A missed SIP costs more the longer you stay invested
If you skip one Rs 10,000 SIP, how much less do you have at the end?
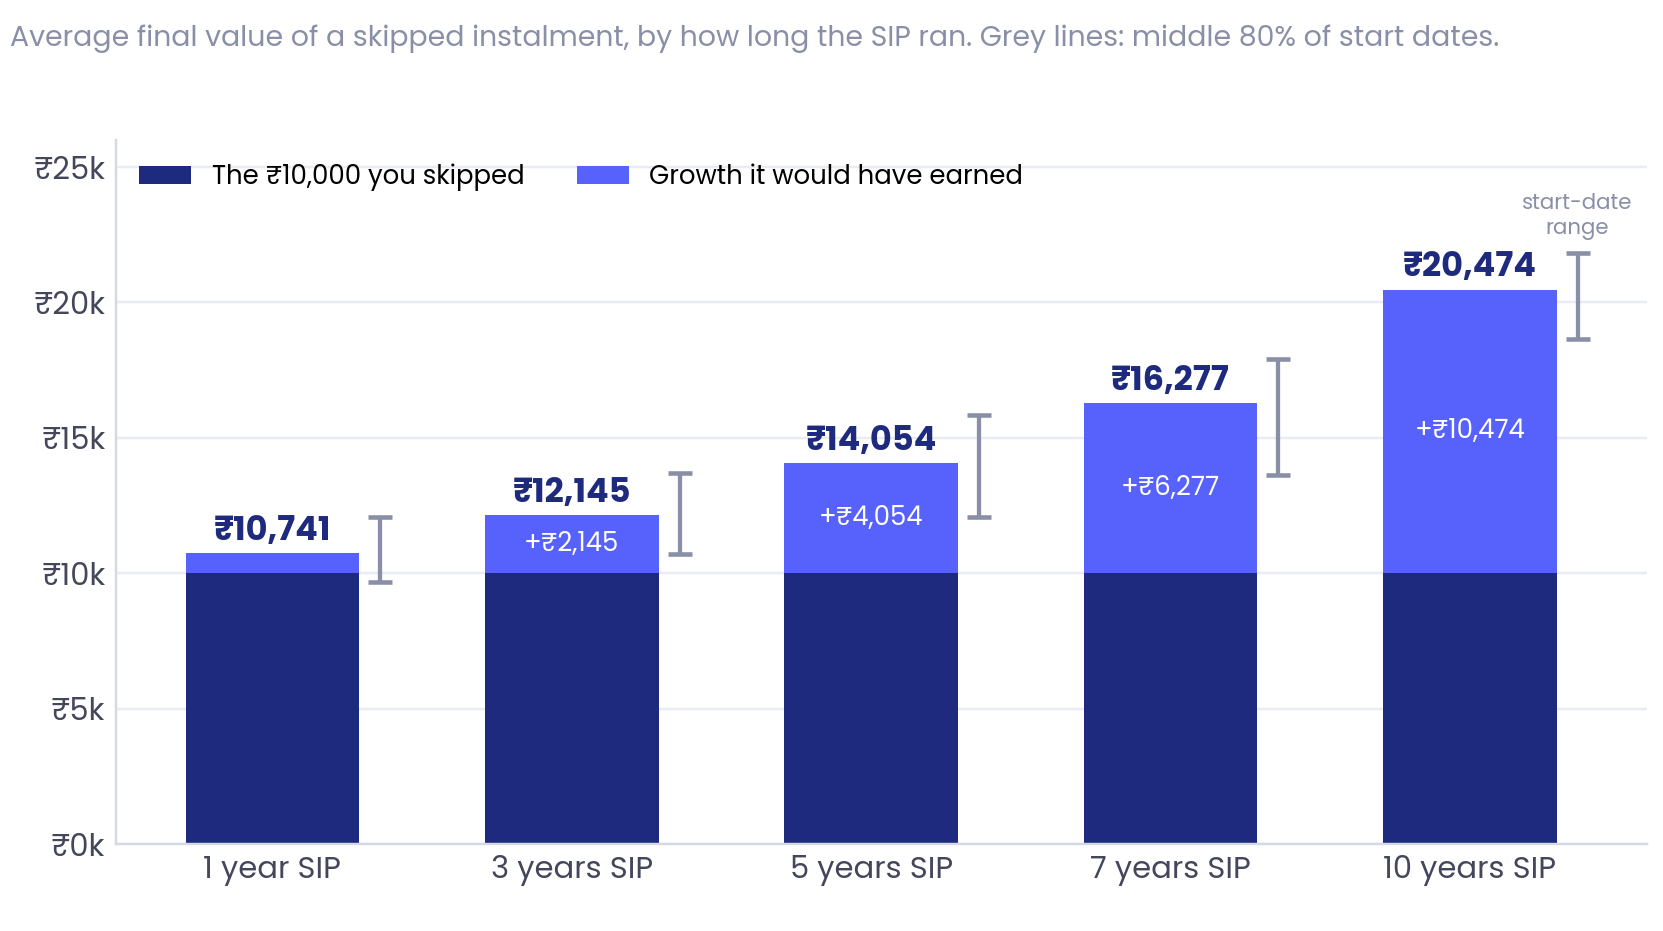
To understand this, we looked at one missed instalment and asked: if that Rs 10,000 had been invested, what would it have been worth by the end of the SIP?
The dark part of each bar is the original Rs 10,000. The lighter part is the growth that money could have earned.
Over 1 year, a missed Rs 10,000 was worth about Rs 10,741 by the end. Over 5 years, it was worth Rs 14,054. And over 10 years, Rs 20,474.
So over longer periods, you do not just miss the Rs 10,000 itself. You also miss the growth that money could have earned over the years. In a 10-year SIP, that lost growth was actually slightly more than the original Rs 10,000.
But shorter periods were more unpredictable.
We tested 153 different one-year SIP periods. For example, one starting in January 2013, another in February 2013, another in March 2013, and so on.
In 28 of those 153 periods, the Rs 10,000 you skipped would actually have fallen in value if you had invested it. In other words, that Rs 10,000 investment would have ended the year worth less than Rs 10,000.
This happened in periods like 2015-16, 2019-20 and 2024-25, when the market ended lower.
Over 3 and 5 years, this happened only a few times.
And over 7 and 10 years, it never happened. Not once.
Now take a 10-year SIP from September 2016 to September 2026.
Someone who never missed an SIP invested Rs 12 lakh and ended with about Rs 21.55 lakh.
Someone who missed 2 random SIPs every year invested Rs 2 lakh less but ended up about Rs 3.59 lakh lower on average.
So Rs 2 lakh of that gap was simply the money that never got invested. The remaining Rs 1.59 lakh was the growth those missed investments could have earned.
So there is no separate penalty for missing an SIP. The gap is simply the money you did not invest, plus whatever that money could have grown into over time.
Your corpus gets smaller. Your return can still look almost the same
Next, we looked at what happens when you keep missing SIPs.
First, a quick distinction.
Your corpus is simply the total value of your investment at the end — the money you invested plus whatever returns it earned.
So if you normally invest Rs 10,000 a month, making all 12 SIPs means putting in Rs 1.2 lakh a year.
Miss 1 SIP, and you invest about 8.3% less money. Miss 2, and you invest about 16.7% less. Miss 3, and you invest 25% less.
Interestingly, the final corpus fell by almost the same percentages.
If you missed 1 out of every 12 SIPs, your final corpus was about 8.3% smaller. Miss 2 out of 12, and it was about 16.7% smaller. Miss 3, and it was about 25% smaller. This stayed roughly the same across 1-, 3-, 5-, 7- and 10-year SIPs.
Why?
Because every SIP is a separate investment. If one Rs 10,000 SIP never happens, it does not affect the money you already invested in the other months.
And since we picked the missed months randomly, the months you skipped were, on average, not very different from the months you invested in.
So if roughly one-sixth of your money never goes in, you also end up with roughly one-sixth less wealth.
But here is the surprising part.
Your return can still look almost the same.
That is where XIRR becomes important.
XIRR tells you the annualised return earned by the money that actually got invested. So even if you skipped a few SIPs, the money you did invest was still in the same fund and earning its returns.
Over 10 years, someone who missed 2 SIPs every year saw their XIRR change by only around -0.07 to +0.07 percentage points in the middle 80% of cases.
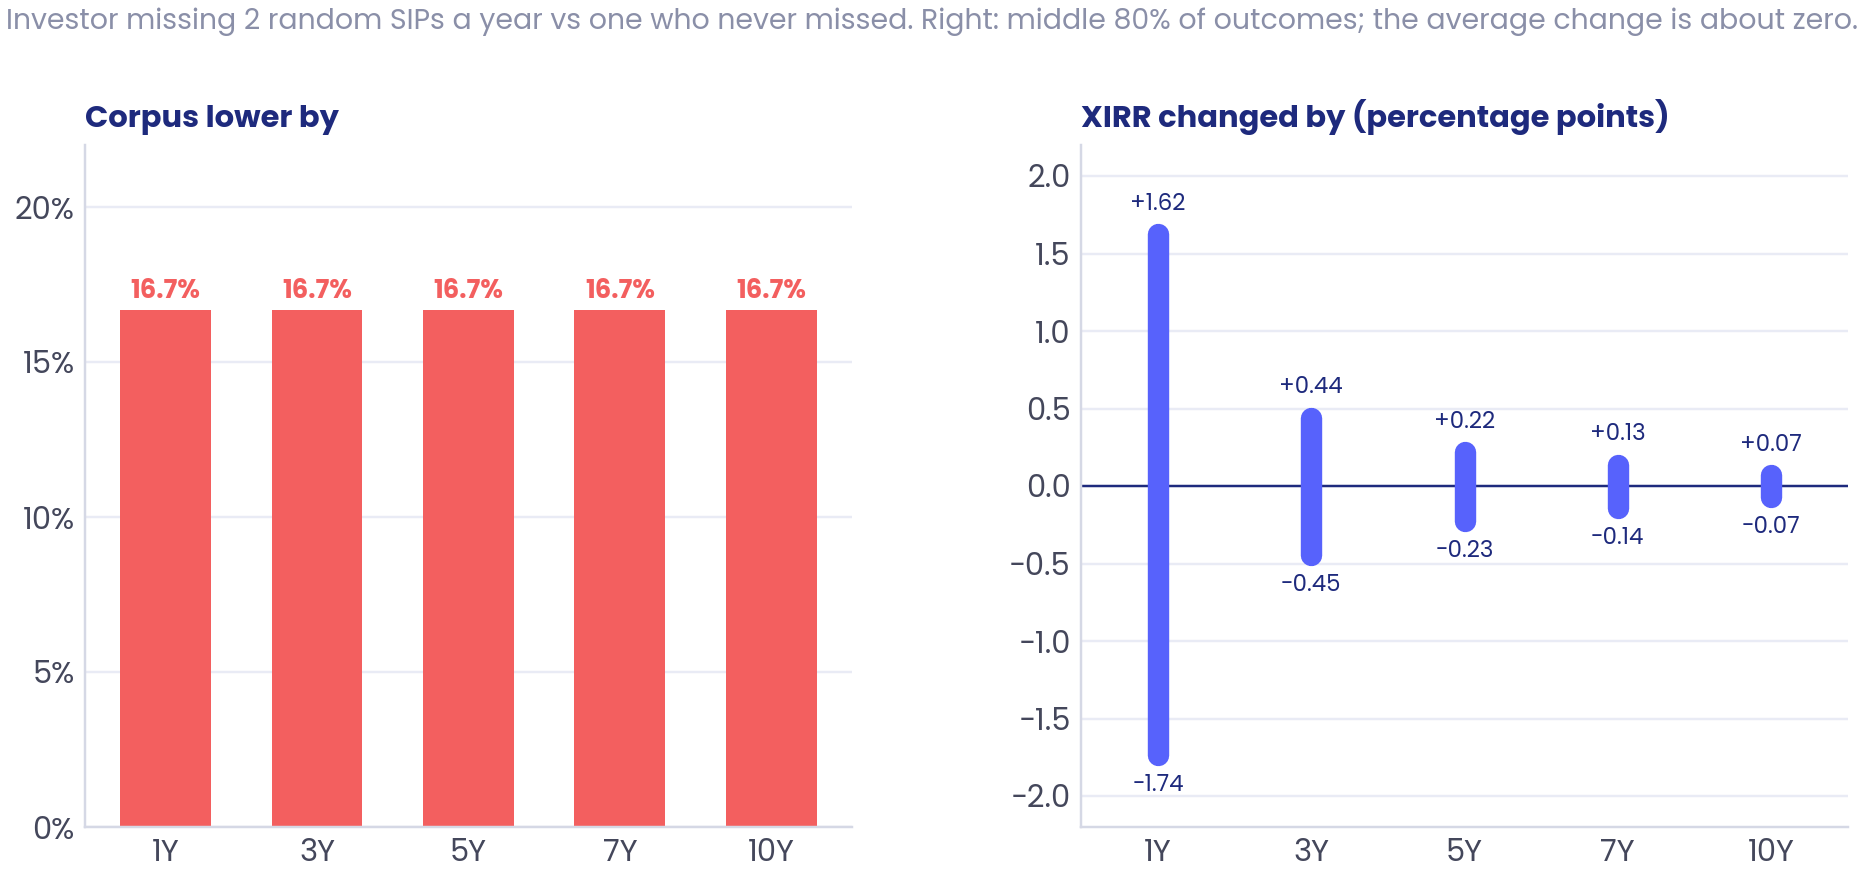
So you could open your app and see a perfectly healthy XIRR, while still having a much smaller corpus.
XIRR tells you how well the money you invested performed. Your corpus tells you how much money you actually ended up with.
Missing an SIP is different from investing it late
So far, when we said an SIP was missed, we assumed that money was never invested.
But that is not always what happens.
Say you were only late on your SIP, and you kept the Rs 10,000 aside and invested Rs 20,000 in April instead.
Both people missed their March SIP. But in one case, the money never entered the investment. In the other, it entered just one month late.
So we tested both.
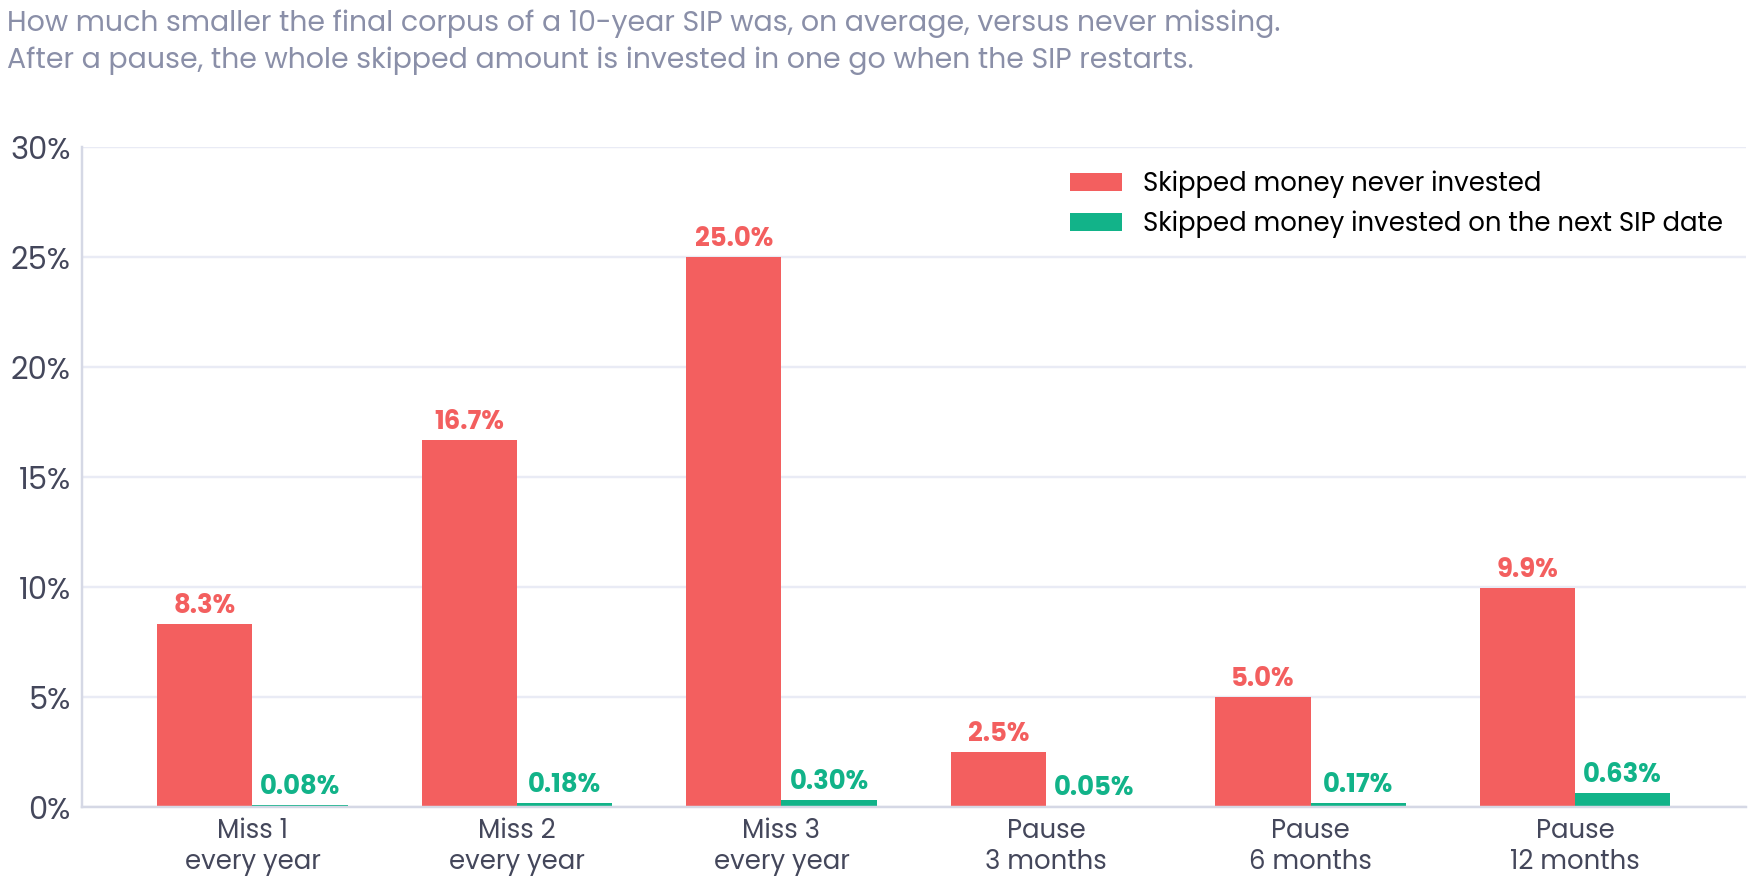
As you can see, the difference between the red and green bars is huge.
The red bars show what happens when the missed money is never invested. If you miss 1 SIP every year, the 10-year corpus is about 8.3% smaller. Miss 2 every year and it is about 16.7% smaller. Miss 3 and the gap reaches 25%.
The green bars show the same missed SIPs, but this time the money is invested on the next SIP date.
Now the gaps become tiny.
Missing 1 SIP every year and catching up the next month left the corpus only about 0.08% smaller. For 2 missed SIPs, it was 0.18%, and for 3, about 0.30%.
We saw the same thing with longer pauses.
Say you stop a Rs 10,000 SIP for six months. That means Rs 60,000 does not go in during those months.
If that Rs 60,000 is never invested, the 10-year corpus ends up about 5% smaller.
But if you keep the Rs 60,000 aside and invest it in one go when the SIP restarts, the gap is only about 0.17% on average.
Even after a full 12-month pause, never investing the missed money left the corpus about 9.9% smaller. Catching up once the SIP restarted reduced that gap to about 0.63%.
The full January 2013 to September 2026 journey makes this even easier to see.
Someone who invested Rs 10,000 every month put in Rs 16.5 lakh and ended with Rs 35.97 lakh.
Someone who missed 2 random SIPs every year (in a typical random draw) and never invested that money ended with Rs 29.93 lakh.
But someone who missed the exact same SIPs and invested the money the following month ended with Rs 35.82 lakh — only around Rs 14,194 behind the person who never missed.
So when someone says, “I missed my SIP,” there is an important follow-up question:
Did the money never get invested, or did it just get invested late?
Because as the chart shows, those two situations can end very differently.
Not every missed SIP costs the same
There is one more thing that matters: when you miss it.
A Rs 10,000 SIP made early in a long investing journey gets many more years to grow. The same Rs 10,000 invested near the end gets much less time.
To see this clearly, we looked at every Rs 10,000 monthly SIP from January 2013 to September 2026 and checked what each one was worth on 30 September 2026.
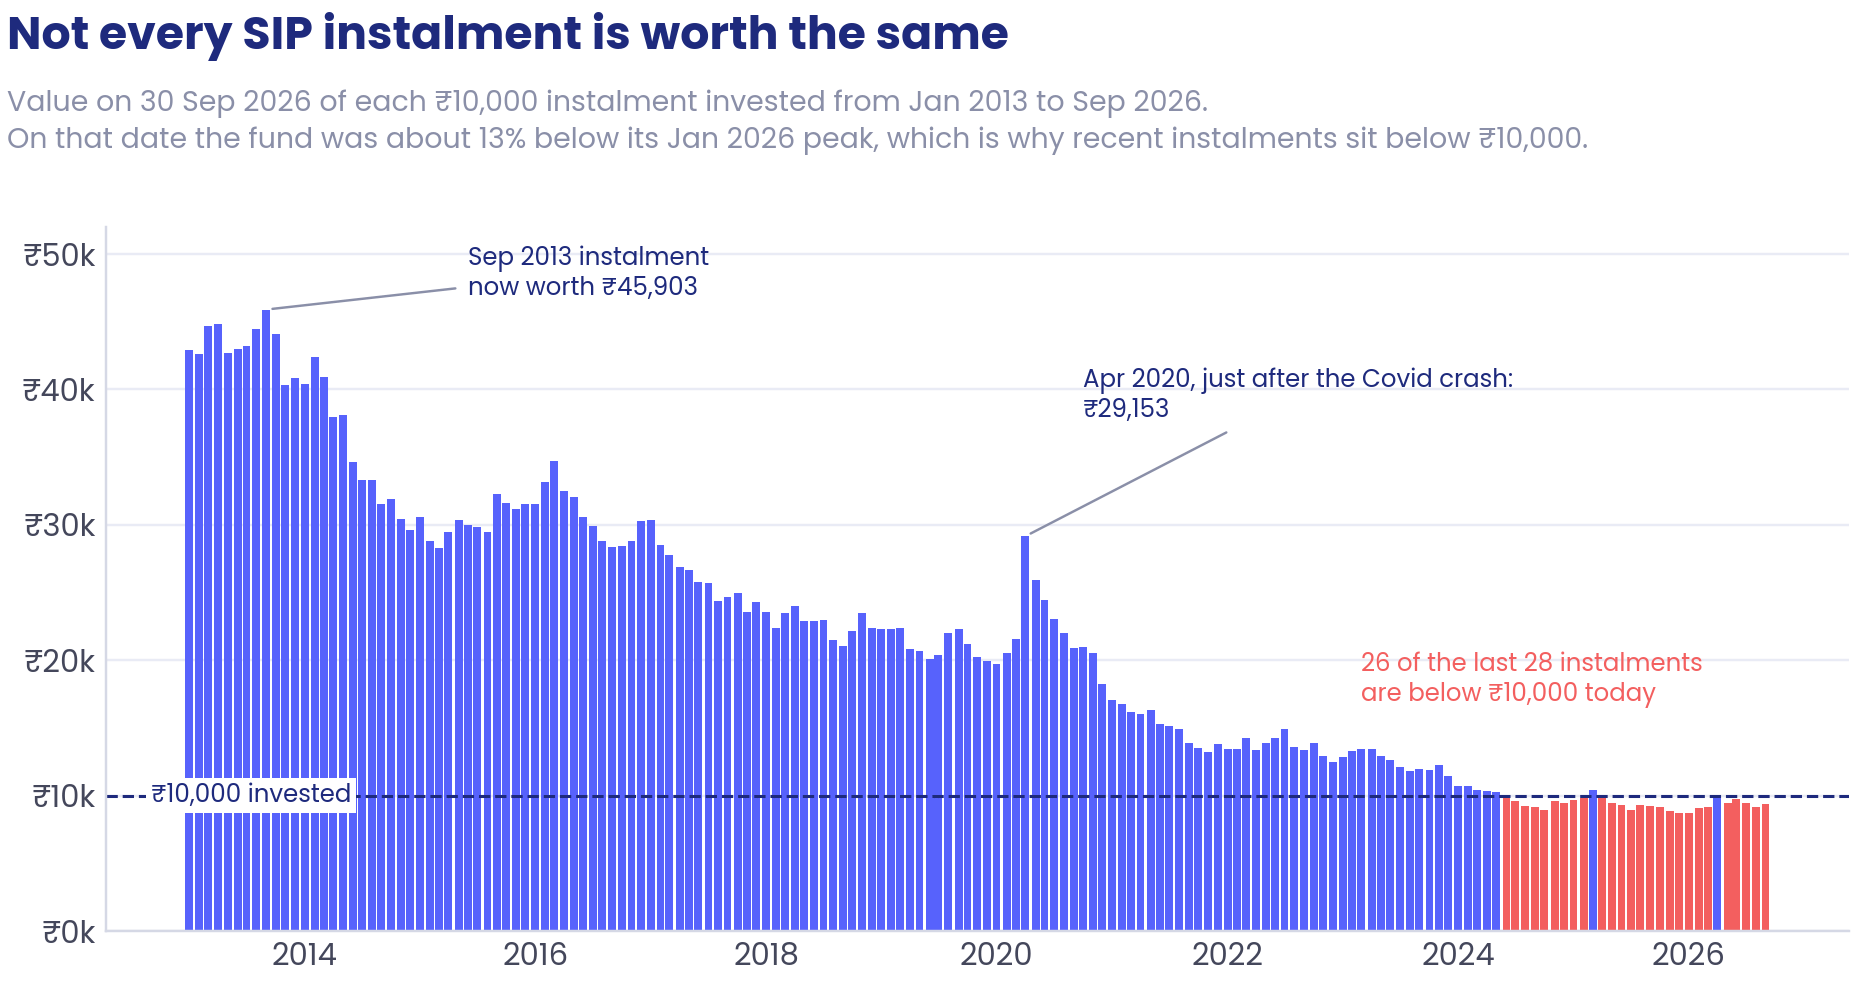
In the chart, every bar is one Rs 10,000 SIP. The older SIPs are on the left and the newer ones are on the right. The taller bars on the left are mostly the earlier investments, simply because they had more years to grow.
For example, the Rs 10,000 invested in September 2013 was worth about Rs 45,903 by September 2026.
Now compare that with the Rs 10,000 invested in April 2020, just after the Covid crash. That was worth about Rs 29,153 by September 2026.
The April 2020 SIP was bought after a big market fall, so it got a good entry point. But the September 2013 SIP still ended up worth more because it had almost seven extra years to grow.
There is one more thing to notice in the chart.
The red bars near the right are the most recent SIPs. On 30 September 2026, the fund was about 13% below its January 2026 highest point. Because of that, 26 of the last 28 SIPs were worth less than the original Rs 10,000 at that point.
That does not mean those were bad SIPs. They were simply recent investments being measured at a time when the market was lower.
So the cost of missing an SIP depends on two things: the price at which that money would have gone in, and how much time it would have had to grow.
Over longer periods, that second part (time) starts to matter a lot more.
We saw this even more clearly when we looked at investors who stopped their SIP completely for a while.
Suppose you invest Rs 10,000 every month but have to take a six-month break during a 10-year SIP. That means six SIPs, or Rs 60,000 in total, are missed.
Now imagine two people take exactly the same six-month break. The only difference is that one pauses in the first year and the other pauses in the last year.
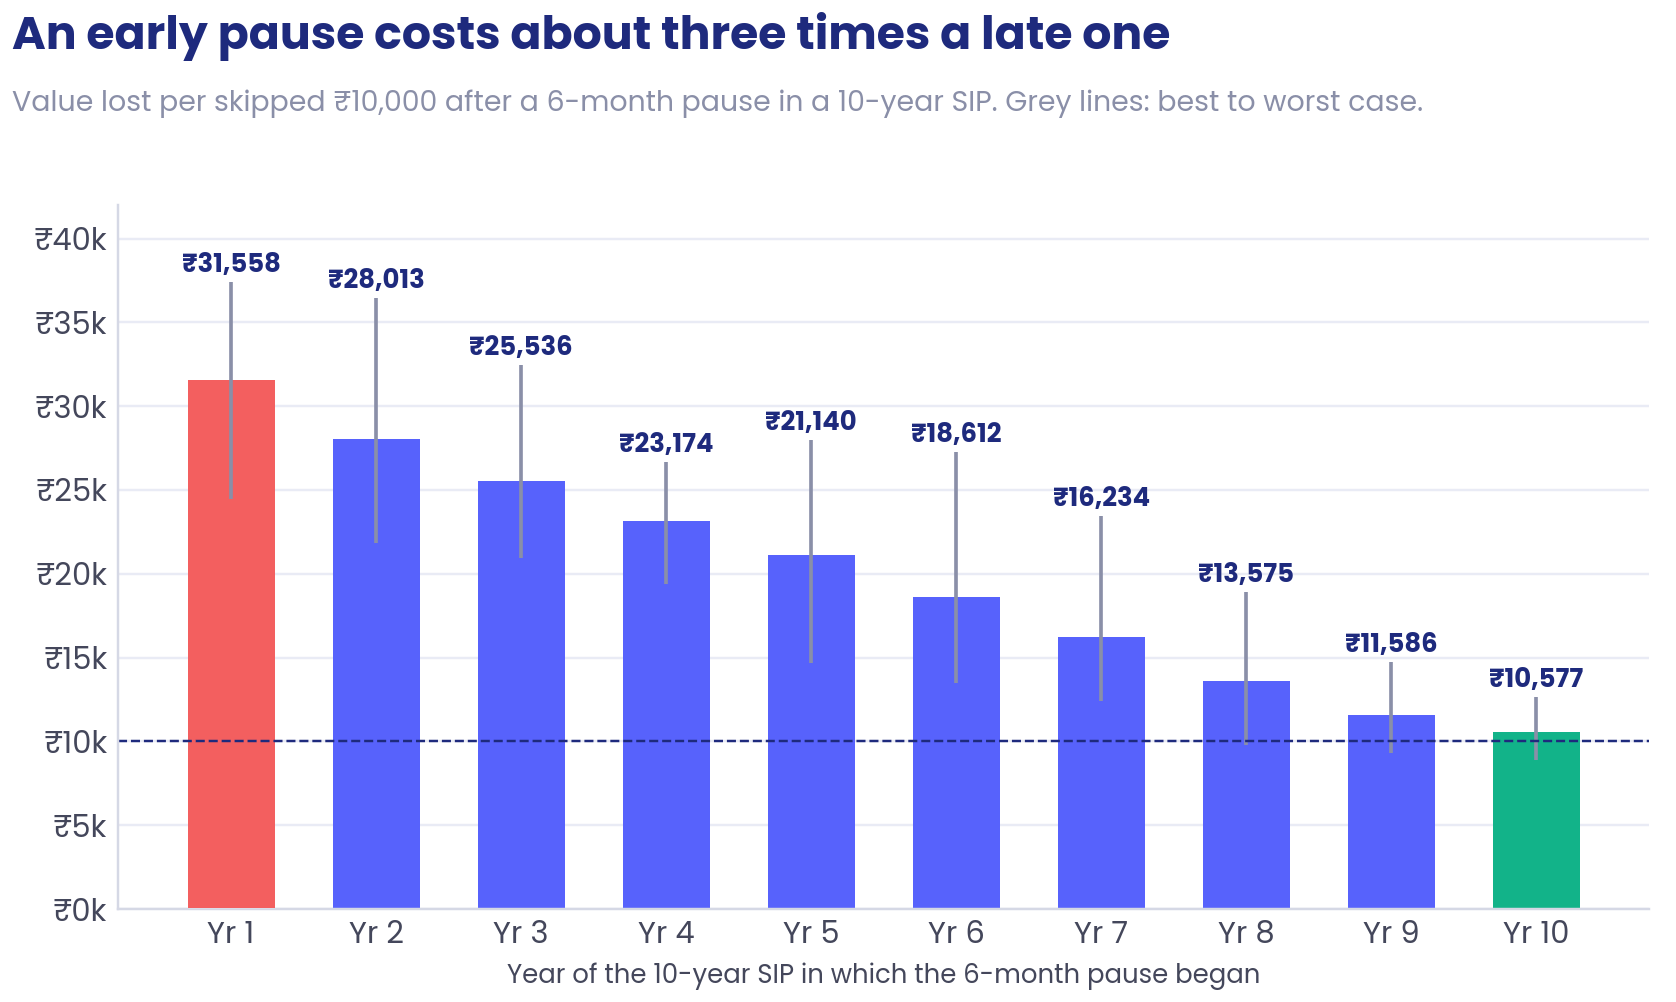
As you can see in the chart, the later the pause happens, the lower the cost tends to be.
For a pause that began in year 1, every Rs 10,000 skipped would have been worth about Rs 31,558 by the end of the 10-year SIP. If the same pause began in year 5, that fell to about Rs 21,140. And if it happened in year 10, each missed Rs 10,000 would have been worth only about Rs 10,577.
So both investors missed the same six SIPs and the same Rs 60,000. What changed was how much time that money would have had to grow.
A SIP missed in year 1 loses almost the entire 10-year journey. One missed in year 10 has hardly any time left.
That is why a six-month break near the beginning ended up costing roughly three times as much as the same break near the end.
This also explains why a few SIPs missed here and there can behave differently from one continuous break.
With random misses spread across 10 years, some happen early and some late, so they partly balance each other out. With a six-month pause, all six misses happen together, so where that block falls in the journey matters much more.
What if you stopped your SIP because the market had fallen?
So far, all the missed SIPs in our study were random.
But sometimes investors stop for a very specific reason.
The market falls.
The portfolio turns red, and putting another Rs 10,000 into it can feel uncomfortable. You might think it is better to wait until things look a little safer and then start again.
So we created an investor who did exactly that.
On every SIP date, if the fund was 10% or more below the highest point it had reached till then, the investor skipped the SIP. They started investing again only once the fund recovered to within 10% of that highest point.
For this part, we also wanted to include the 2008 crash. Direct plans did not exist that far back, so we used the Regular Growth plan of the same UTI Nifty 50 Index Fund from 2002 onwards. The Regular plan charges a little more, but everyone in this comparison uses the same plan, so we are still comparing the behaviour in the same fund.
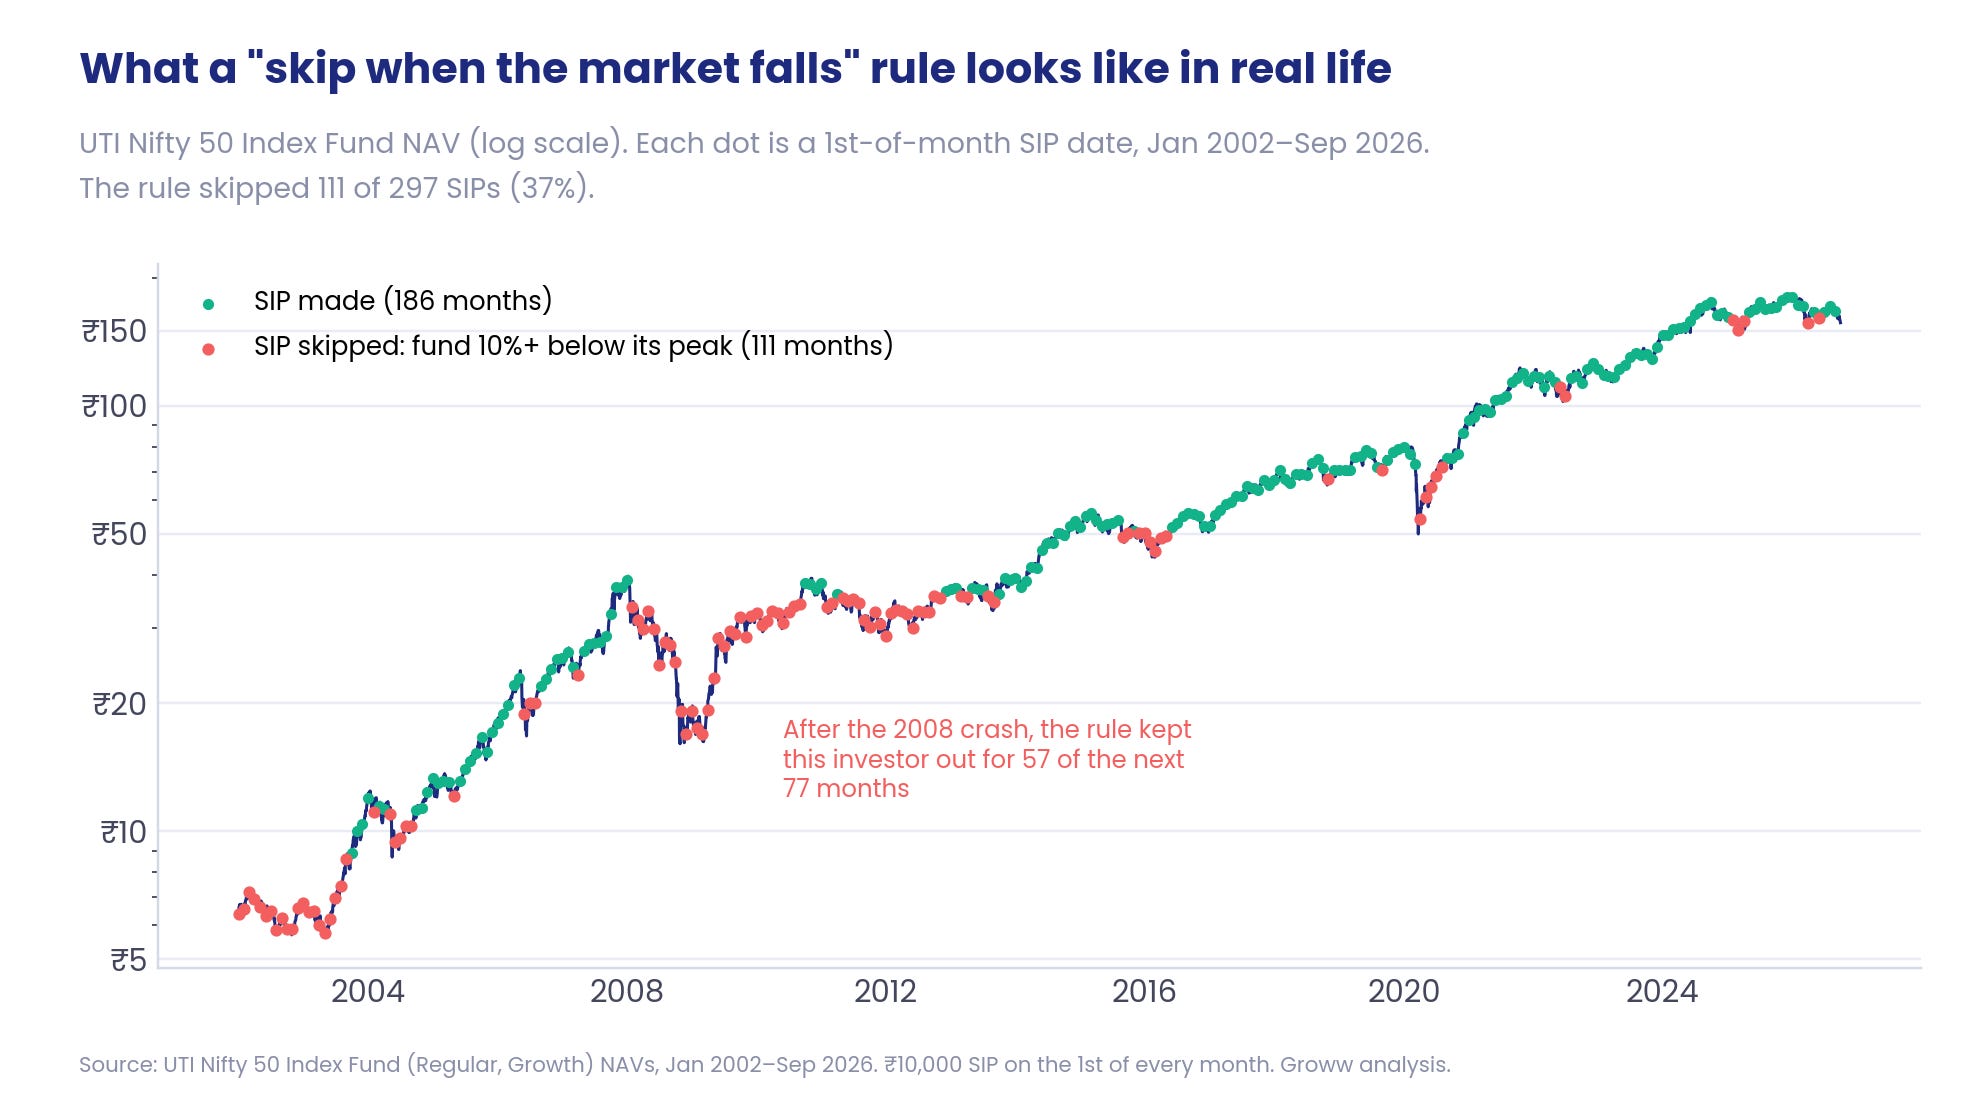
In the chart, the green dots are months when the SIP went in and the red dots are months when the investor stayed out.
And the first thing you notice is that this approach does not make you miss only a few bad months.
Out of 297 SIP dates between January 2002 and September 2026, the investor skipped 111.
After the 2008 crash alone, the investor stayed out for 57 of the next 77 months. They also skipped much of 2002 and 2003 because the fund was still more than 10% below the highest point it had reached in 2000.
That is the problem with waiting for the market to look safe again. You do not know when the bottom has arrived. By the time the recovery becomes obvious enough to start investing again, part of that recovery may already have happened.
So we compared these market-fall misses with the random misses from earlier.
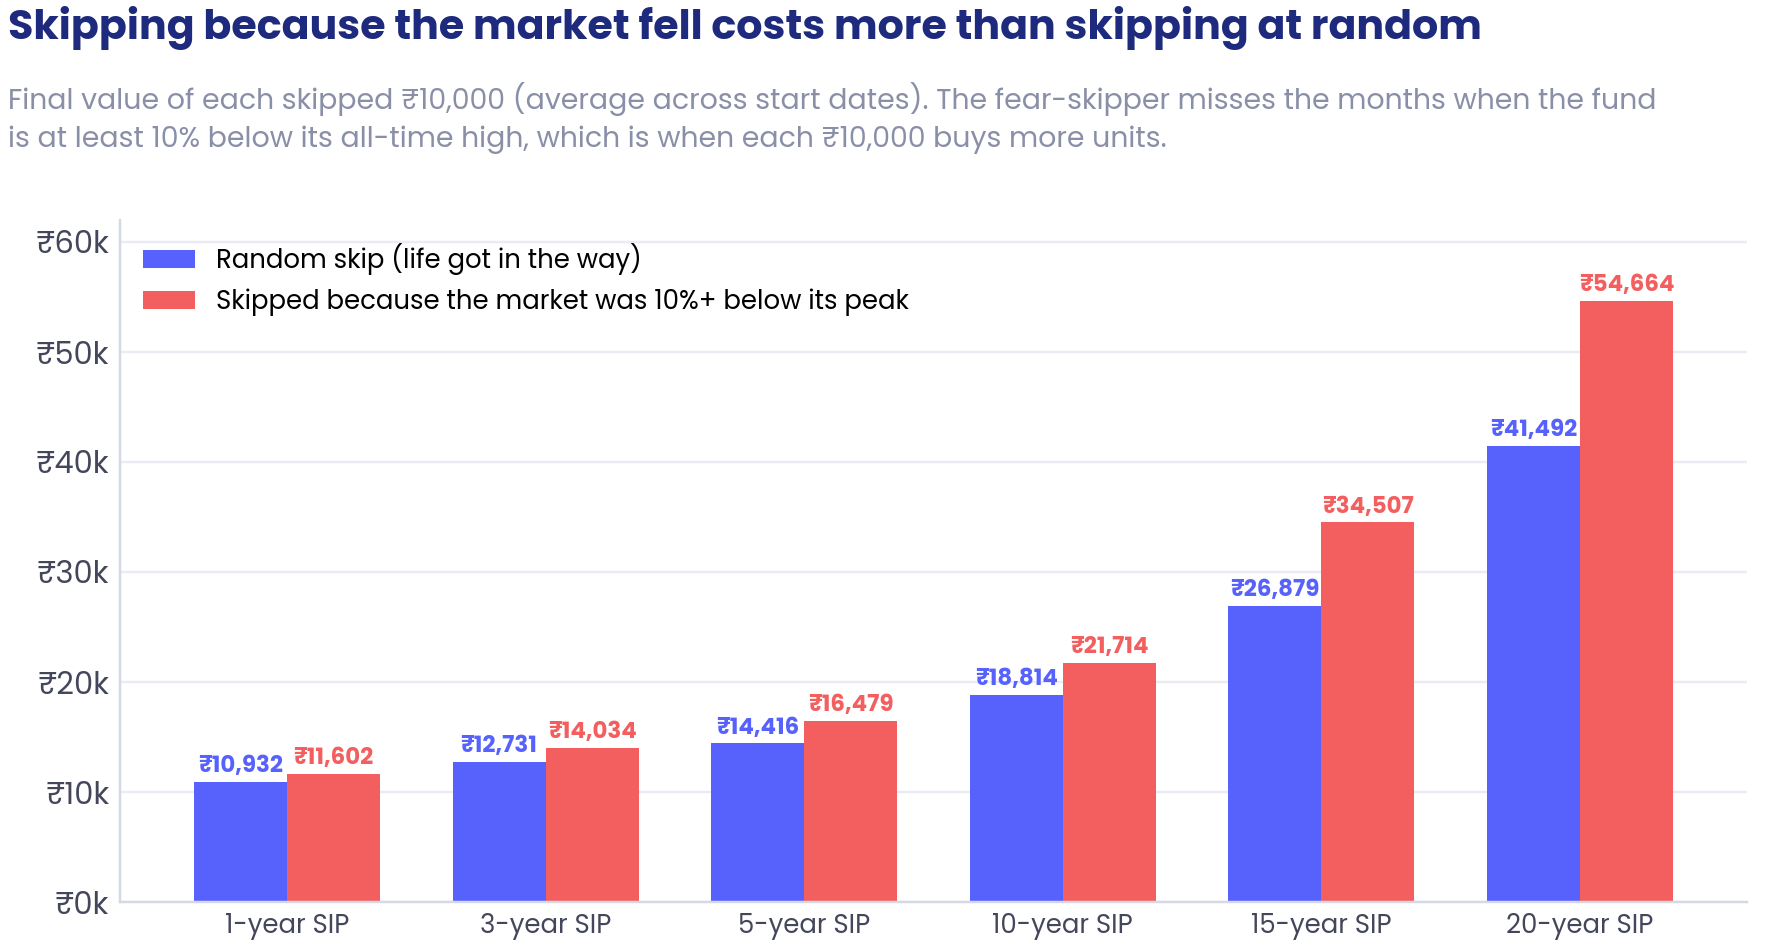
The blue bars show a random missed SIP. The red bars show an SIP deliberately skipped because the fund was at least 10% below its previous highest point.
Over a 10-year SIP, every Rs 10,000 skipped because of a market fall would have been worth about Rs 21,714 by the end. For a random missed SIP, it was about Rs 18,814.
Over 20 years, the difference became even larger: about Rs 54,664 for a market-fall skip versus Rs 41,492 for a random one.
We saw the same pattern in the main Direct-plan study too. In every 7-year and 10-year SIP we tested, skipping because the market had fallen cost more than skipping at random.
There was another important difference.
Earlier, we saw that if a random SIP was missed but the money was invested the following month, most of the gap disappeared. Over 10 years, the corpus was only about 0.18% smaller.
But when the investor waited for the market to recover, they could stay out for several months. Even if all the skipped money was kept aside and invested as soon as the market came back within 10% of its previous high, the final 10-year corpus was still about 1.5% lower on average.
The full 2002–2026 journey makes this easier to see.
Someone who simply kept investing put in Rs 29.7 lakh and ended with about Rs 1.69 crore.
The investor who stopped during market falls skipped 111 SIPs and spent that money instead. So they invested only Rs 18.6 lakh and ended with about Rs 69.37 lakh.
But the more useful comparison is the investor who did not spend the skipped money. They kept every rupee aside and invested it once the market had recovered enough for them to restart.
That investor also put in the full Rs 29.7 lakh, just like the person who never stopped. But they ended with about Rs 1.47 crore (roughly Rs 22 lakh less).
So here, both investors eventually invested the same amount.
The difference was when the money entered the market.
So, what does this tell us?
Missing an SIP is not automatically a big problem.
Sometimes life gets in the way and the money genuinely needs to be used somewhere else. What matters more is what happens after that.
If the money eventually gets invested, even a little late, that can be very different from never investing it at all.
When you miss also matters. An SIP missed early has much more time that it could have spent growing, while one missed near the end has far less.
And there is an important difference between having to miss an SIP and choosing to stop because the market has fallen. Waiting for things to look safer can keep you out for much longer than expected, including during periods when prices are lower.
So there is no single answer to “How bad is missing an SIP?”
It depends on whether the money eventually gets invested, when in the journey the miss happens, and why you stopped in the first place.
A few missed months because life got in the way are very different from money that never gets invested at all. And they are also very different from deliberately waiting for the market to look safe again.
So maybe the useful way to think about a missed SIP is not whether you broke your perfect SIP streak.
The better question is what happened to the money you were supposed to invest.
Did it get invested later? Did it never get invested at all? Or did you keep it out because you were waiting for a better time?
Those choices can matter much more than simply missing the SIP date itself.
Note:
The study uses UTI Nifty 50 Index Fund. The main study uses the Direct Plan (Growth) from 2013–2026; the market-fall test uses the Regular Plan (Growth) from 2002–2026.
Each SIP is Rs 10,000 monthly on the 1st, or the next working day.
Missed months were chosen randomly and tested 2,000 times for every starting month. Results shown are averages.
Many investment periods overlap, so they are not completely independent experiences.
The market-fall rule skips SIPs when the fund is 10% or more below its previous highest NAV.
Results depend on the period chosen. The fund was about 13% below its January 2026 high on 30 September 2026.
Stamp duty, exit loads and taxes are not included.
A few errors in early Regular-plan NAV data were corrected using the fund’s IDCW-option data.