

October 19, 1987. Monday.
The Dow Jones fell 22.6% in a single day.
The fall was so violent that it still stands out as the biggest one-day percentage decline in its history.
This day later came to be known as Black Monday.
And the strangest part wasn’t just the fall. It was what happened after the crash.
Instead of continuing to spiral downward, the market bounced back almost immediately. Over the next 2 trading sessions, the Dow recovered 288 points, regaining roughly 57% of what it had lost on Black Monday.
For investors watching from the sidelines, it was deeply confusing. How could the market collapse one day and rebound so sharply the next? Was the crash an overreaction? Or was the recovery a false sense of safety?
Black Monday made one thing clear for investors: prices alone were not enough to understand what was really happening in the market. Markets could fall sharply one day and recover the next.
After Black Monday investors remained anxious about what might happen next. What they were really dealing with was volatility.
At the time, there was no standard way to measure it. Fear was visible, but it wasn’t quantifiable.
That changed in 1993, when economist Robert Whaley introduced a new idea at the Chicago Board Options Exchange (CBOE).
He called it the VIX, also known as the Volatility Index.
VIX works by tracking investor behaviour. More specifically, it looks at how investors are preparing for the future market.
When investors feel calm, they do very little to protect themselves. But when they feel nervous, they start to protect their investments. This usually happens in the options market, where investors buy contracts that pay off if prices fall, helping limit potential losses.
The VIX was designed to observe this behaviour. It looks at prices of options on the S&P 500 and captures how much protection investors are buying. It then compresses all of that information into a single number.
A higher number meant investors were bracing for bigger swings.
A lower number meant they expected calmer markets.
Over time, the index evolved into the version people now know as the “Fear Gauge.”
Today, India has its own version of that fear gauge — India VIX.
Over the years, India VIX has shown a very clear pattern. Most of the time, it stays within a relatively normal range. But during stress events (such as financial crises, global shocks, pandemics, and tightening cycles) it doesn’t just spike for a day and disappear. It stays elevated for months. Sometimes for years.
That raises a crucial question for long-term investors.
If fear persists for long stretches, and if investors change their behaviour whenever fear rises, what does that actually do to long-term wealth?
Does pausing investments during high VIX periods reduce risk?
Does waiting for VIX to cool down improve outcomes?
To answer that, we decided to run a simple experiment.
Experiment
In this experiment, everything is kept the same across all strategies. The same fund is used, the same monthly investment amount, the same dates, and the same market history.
The only thing that changes is how the investor reacts when fear shows up in the market.
All investments are made in the SBI Nifty Index Fund, using actual daily NAV data. Each investor puts in Rs 10,000 every month, always on the first trading day of the month.
Units are bought at the NAV available on that exact day. There is no averaging, guessing, or adjustment.
The study covers the period from April 2008 to December 2025.
How fear was measured
To understand how fear shows up in real market behaviour, we studied India VIX data alongside Nifty movements over a long period.
Time period covered: 4 March 2008 to 21 January 2026
Total trading days analysed: 4,381 trading days
Every percentage mentioned below is calculated using these 4,381 actual trading days, not calendar days.
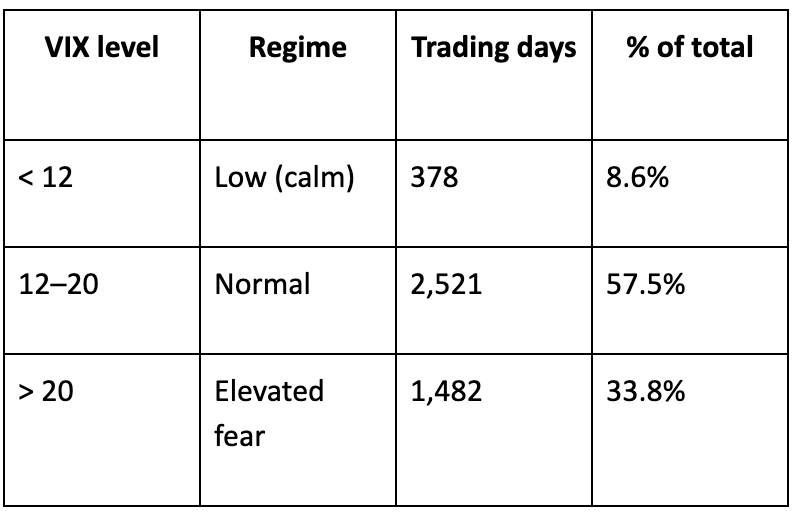
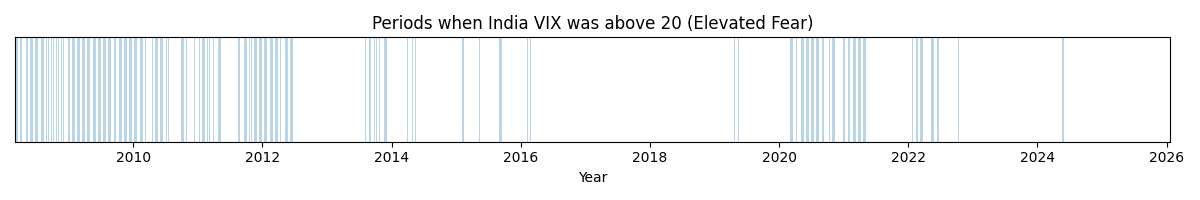
Out of 4,381 trading days between March 2008 and January 2026, 1,482 days saw the India VIX above 20.
That is nearly 6 full trading years’ worth of days spent in elevated fear. One-third of market life is spent in elevated fear.
This has an important implication. Avoiding fear does not mean avoiding a few bad days. It means avoiding a large portion of the market itself.
If an investor pauses SIPs or stops investing whenever VIX rises above 20, they are choosing to stay out of the market for about 34% of all trading history, spread across multiple long fear-driven periods such as 2008-10, 2011-12, and 2020. Importantly, high volatility does not always mean falling markets; some of the market’s gains have also occurred during high-VIX periods.
So we decided to find out if an investor bases investment decisions on fear in the market and movements in the volatility index; how does that affect long-term returns?
The 3 strategies
Strategy 1: Ignore fear
In this strategy, the investor continues investing every month regardless of the VIX. There are no pauses, no exits, and no changes in exposure.
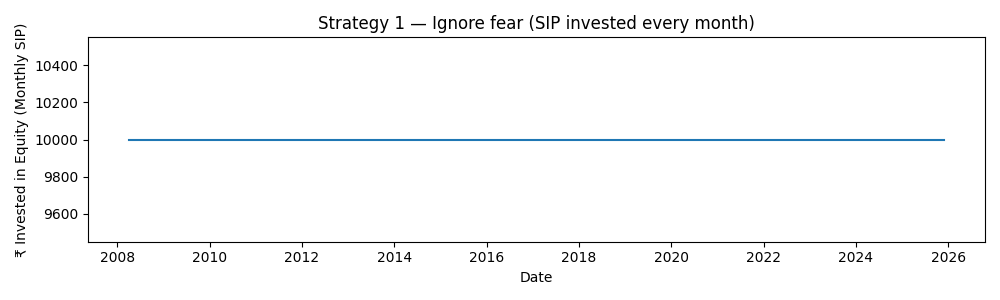
This graph shows a flat line at ₹10,000 every month from 2008 to 2025. The SIP never pauses, regardless of market conditions.
While the portfolio value goes through drawdowns during volatile periods, the investor’s behaviour remains unchanged. This approach represents full participation across all market cycles, including periods of fear and uncertainty.
Strategy 2 — Pause and wait with cash (Wait for clarity)
When VIX exceeds 20, the SIP is paused. The skipped amount is held as cash and invested later in one lump sum when fear subsides.
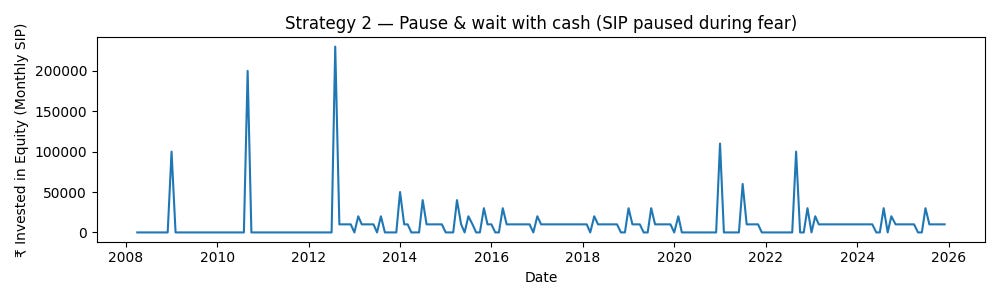
In the graph, you can clearly see the SIP line drops to Rs 0 whenever India VIX rises above 20.
On the graph, this appears as a flat stretch at zero, sometimes lasting many months. These flat stretches line up with long fear phases such as 2008–09, 2011–12, 2020, and 2022.
This is not a one-month choice. Fear tends to last, and so does the pause. The longer uncertainty continues, the more cash builds up outside the market.
When VIX finally falls below 20, the investor invests everything at once (the regular Rs 10,000 plus all the cash accumulated during the pause)
This is why the graph shows large upward spikes, often much bigger than Rs 10,000. These spikes represent lump-sum investments of cash that had been waiting on the sidelines.
After this, the investor returns to the normal Rs 10,000 monthly SIP, just like Strategy 1, until fear appears again.
Strategy 3 — Stops SIP and no accumulation
When VIX exceeds 20, the SIP is skipped permanently. The investor does not invest that month and does not set the money aside for later. Existing investments remain untouched, but the skipped Rs 10,000 never enters the market at all.
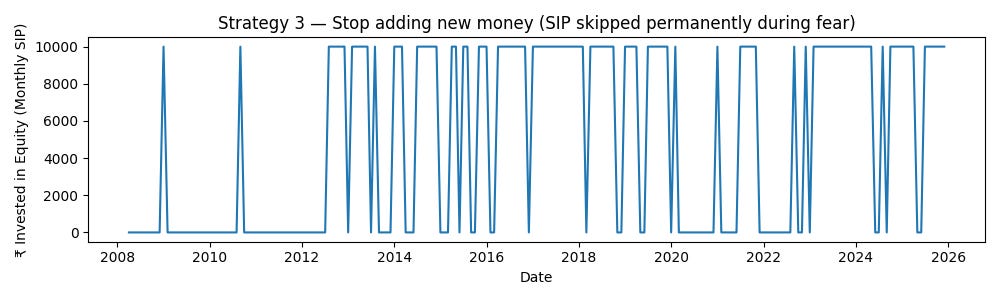
On the graph, this shows up as a simple on–off pattern. During calm periods, the SIP is Rs 10,000. During high-VIX periods, it drops straight to Rs 0. Unlike Strategy 2, there are no larger spikes later, because there is no accumulation.
Once a month is missed, it is gone forever. Over time, these zero months permanently reduce the total amount of money that ever enters the market.
Result
When all the strategies are placed side by side, it is clear that every investor saved the same Rs 10,000 each month. Every investor faced the same crises and saw the same market recoveries.
The only thing that differed was how each one reacted when fear appeared.
Strategy 1 — Ignore fear
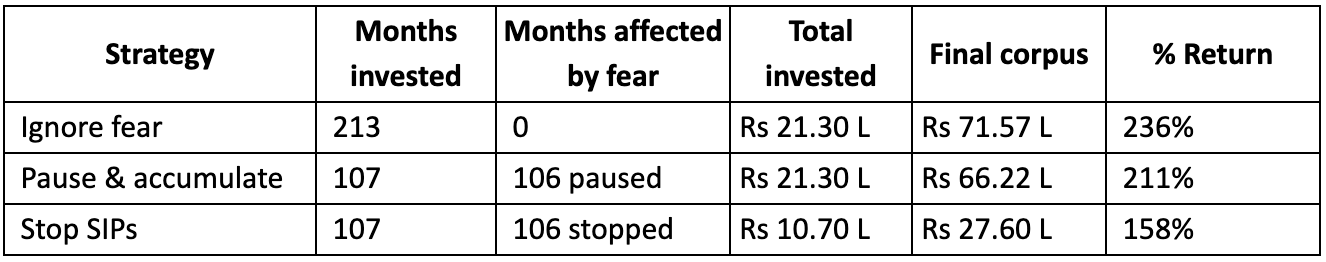
The investor who ignored fear entirely stayed invested for all 213 months between April 2008 and December 2025. This meant uninterrupted participation across every major stress period.
By continuing to invest through drawdowns, this strategy accumulated units at a wide range of prices, including during periods when sentiment was at its worst. Over time, that steady participation compounded quietly. The key advantage here was not superior timing or prediction. It was simply never stepping away from compounding.
Strategy 2 — Pause SIPs and invest later
The second behaviour, pausing SIPs during fearful periods but investing the accumulated money later, felt cautious and reasonable. After all, no money was permanently removed from the system. The investor still ended up investing the same total of Rs 21.3 lakh.
The problem was timing.
Fear did not appear for a few isolated months. It arrived in long phases. By pausing investments during those phases, this investor stayed out of the market for nearly half of the entire investing period. When fear eventually subsided, the accumulated cash was deployed in large lump sums but typically after prices had already started recovering.
As a result, the investor bought fewer units at higher prices. The shortfall did not come from investing less money but from investing it later.
Strategy 3 — Stop SIPs altogether
The third behaviour, stopping new investments completely during fear, proved far more damaging.
This investor did not sell existing holdings but permanently skipped SIPs whenever uncertainty rose. Over the full period, this meant that only Rs 10.7 lakh, roughly half of other strategies.
Compounding continued, but on a much smaller base.
Conclusion
When you look at all the strategies together, one pattern becomes very clear. The more an investor reacted to fear, the worse the long-term result became. Ignoring fear worked best. Waiting did a little worse. Stopping investments did much worse.
Fear itself did not destroy wealth. Markets recovered after every major fall in this period. What changed the outcome was how investors behaved during fear — especially how long they stayed out of the market while prices were already recovering.
This experiment does not suggest that volatility is harmless or that risk management is irrelevant. Instead, it shows that waiting for certainty is often more damaging than enduring uncertainty. Fear usually stays high even after prices stop falling, and by the time confidence returns, a big part of the opportunity is already gone.
In the end, the simplest behaviour (continuing to invest without reacting to fear) produced the highest long-term wealth. Not because it avoided drawdowns, but because it never stepped away from compounding when it mattered most.
That is the quiet but powerful conclusion of this study: over long periods, markets don’t punish volatility nearly as much as they punish changes in behaviour driven by volatility.
You should've added a 4th type investor who only invests during high VIX periods.
Wah ❤️ chumma article