

On 2 May 2025, the Financial Times’ Unhedged newsletter published a piece called “Taco trade theory and the US market’s surprise comeback.”
Its author, Robert Armstrong, was trying to make sense of something unusual happening in the US stock market.
It started on 2 April 2025.
Donald Trump announced what he called “Liberation Day” tariffs. The US said it would put a 10% tax on most imports, and even higher tariffs on some key trading partners.
Investors around the world quickly got worried.
People started thinking that other countries might hit back with their own tariffs, US companies could end up paying more for imported goods, global trade might slow down, and overall economic growth could take a hit.
So markets reacted badly.
But just a few days later, on 9 April, Trump put a 90-day pause on many of the higher tariffs. The 10% base tariff stayed in place, and China was still treated differently as tensions between the two countries continued. Over the next few weeks, the administration also signalled openness to negotiations and made small adjustments to its stance.
And markets recovered.
Armstrong pointed out something interesting. It wasn’t like the problem had actually gone away. The tariffs were still in place, and there was still a lot of uncertainty.
But investors had started to see a pattern.
Trump would announce a big tariff, and markets would drop right away because people worried things would get much worse.
Then, after a few days or weeks, the policy would often get softened. Tariffs might be pushed back, some goods might get exemptions, or talks would start to change the plan.
Armstrong gave this pattern a name: TACO — Trump Always Chickens Out.
The phrase quickly caught on, and traders started calling it the “TACO trade”.
The phrase itself was cheeky. But the problem it described was very real for investors.
When a tariff was announced, nobody knew what the final policy would actually look like.
It could stay as announced, be reduced or delayed, include exemptions, or escalate if the other country retaliated.
The problem was that investors had to make a decision before they knew which of these would happen.
And that is what made the TACO trade interesting.
It was not saying that tariffs did not matter. They did. Even if Trump later softened his position, existing tariffs and all the uncertainty around them could still hurt businesses and the economy.
The real question was different:
How much of the fear on announcement day would actually turn into real economic damage?
Sanctions create a very similar problem.
Suppose the US announces sanctions on a Russian oil producer. The sanction is real, but for an Indian investor the impact is uncertain. Will oil prices rise? Will India lose access to discounted Russian oil? Will refiners face higher costs, and if so, will it actually be enough to hurt profits or stock prices?
The headline hits immediately, but the real economic impact takes time to show up.
So we asked a simple question: when major sanctions are announced, should Indian investors actually sell? Does the Nifty keep falling? Do the most exposed sectors get hit harder? Or does the initial fear fade away?
To find out, we studied eight major sanctions shocks over the last decade and a half.
THE EXPERIMENT
But first, we had to decide which sanctions to study.
That was not as simple as it sounds.
Governments announce thousands of sanctions and restrictions. But most are very narrow — one person gets added to a sanctions list, one company gets blocked, or one ship loses access to insurance.
These usually don’t move a broad market index like the Nifty, so including them would just add noise.
So we used two simple filters.
First, the sanction had to be big enough to matter economically — something affecting banks, oil exports, key technology, or trade with India, not just a single person or vessel.
Second, there had to be a clear way for the shock to reach Indian companies.
That could happen through oil prices, technology and supply chains, the global financial system, or direct trade pressure on India.
If a sanction sounded dramatic but had no obvious connection to Indian businesses, we left it out.
Using these filters, we picked eight major sanctions episodes.
We also made sure they covered different kinds of shocks (energy, technology, banking and direct trade) instead of studying eight versions of the same problem.
And when several sanctions were announced within a few days as part of the same crisis, we counted them as one episode. Otherwise, one crisis could end up appearing several times in the study.
Most importantly, we fixed these events before looking at what happened to the Nifty afterwards because otherwise it would be easy to pick only the sanctions that coincided with big market falls.
We did not do that.
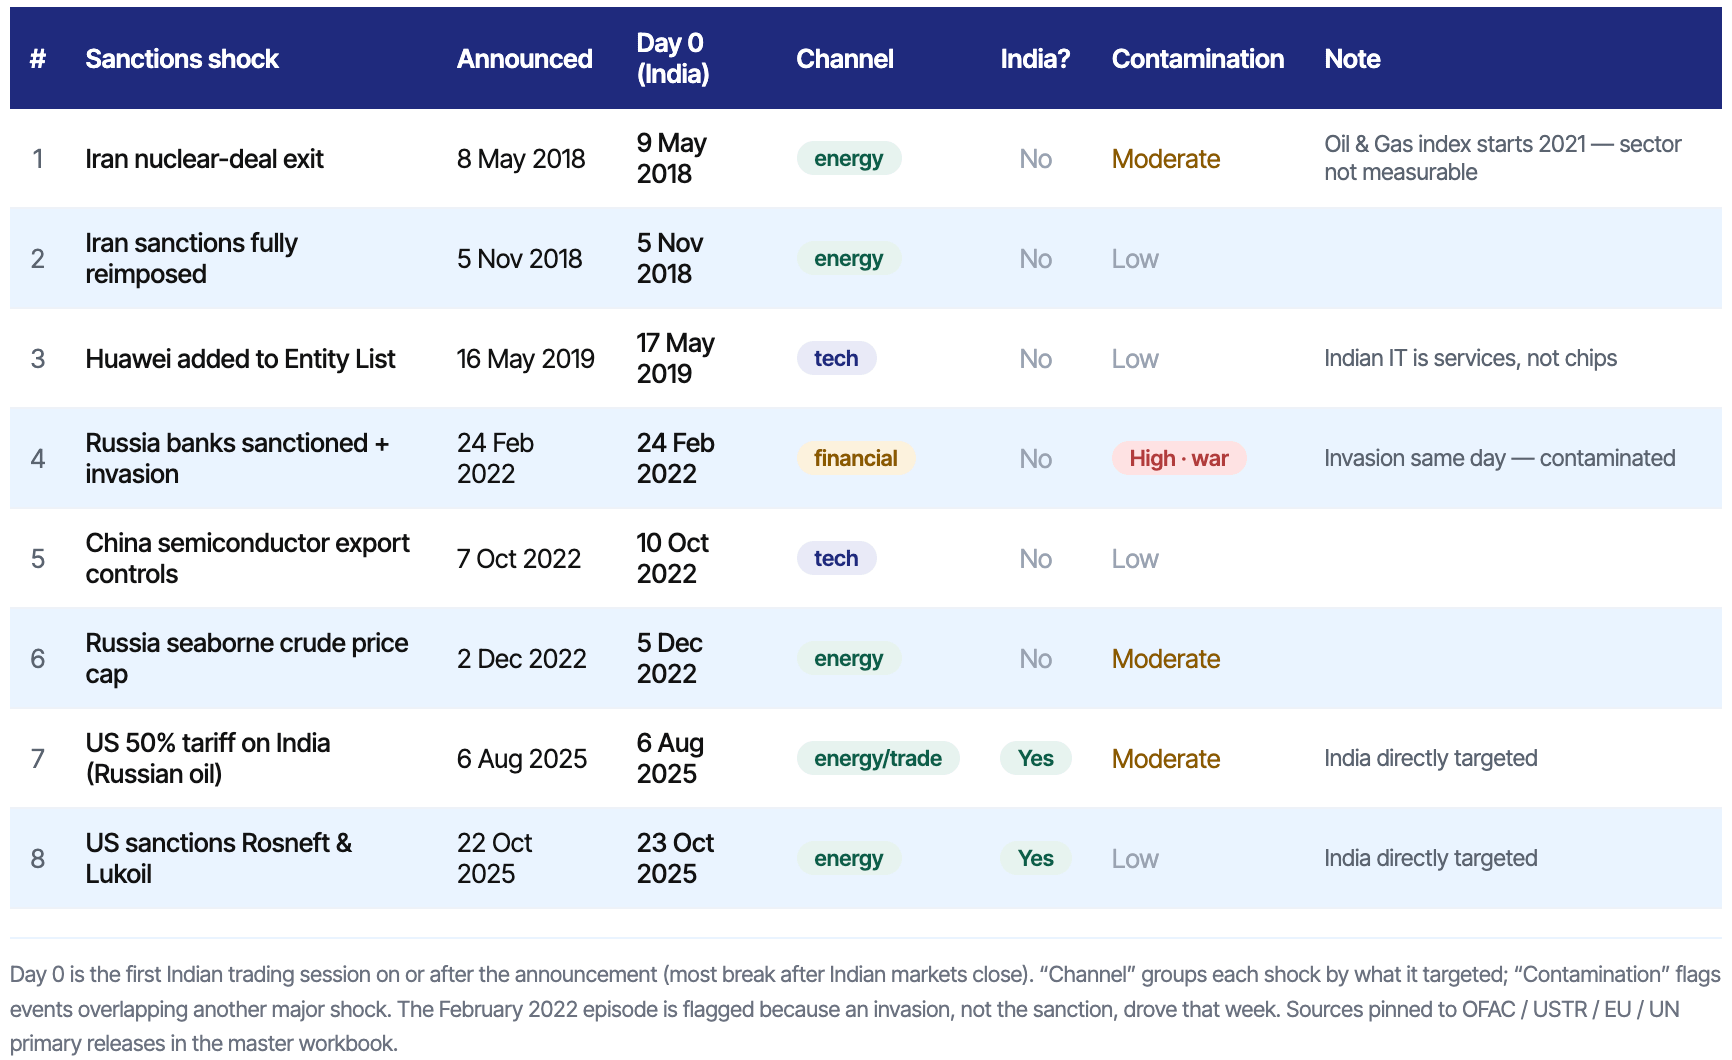
Some of the events in our list barely moved the Nifty. The Huawei blacklist is one example. The Russian oil price cap also produced very little immediate market reaction.
We kept them anyway. Removing events where markets didn’t react would bias the results and create a false pattern. The eight events start in 2018 because that’s when we have reliable daily Nifty and sector data.
For every event, Day 0 is the first trading day in India after the announcement.
We then asked three simple questions: how much did the Nifty fall over the next 20 trading days, how long it took to recover, and what would have happened if an investor sold on Day 0.
We also compared the most exposed sector in each case with the Nifty to see if it actually underperformed the broader market.
One important exception is February 2022, when Russia was sanctioned at the same time as the Ukraine invasion, making it hard to separate the impact of the two events.
How much did the market actually fall?
The real question is not what happens on the day of the news, but how much damage actually sticks after things settle.
In 7 of these 8 episodes, the Nifty did fall below its pre-event close at some point over the next 20 trading sessions. So there was usually some weakness after the sanctions news. But importantly, this weakness was often short-lived or shallow.
When we look at the depth of those moves, a clear pattern emerges.
The first thing we noticed was that most sanctions did not lead to a big market fall.
In 5 of the 8 cases, the Nifty never fell more than 2% below where it had started.
In other words, even after a full month of trading, the market was still broadly holding its ground. The Huawei episode was even milder. The Nifty never actually closed below its pre-event level, suggesting that the event barely had any lasting impact on the market.
Then came the mid-range reactions.
In 2 cases, the Nifty fell between 2% and 5%. After the US exited the Iran nuclear deal in 2018, the Nifty fell by a maximum of about 2.7%, as investors worried about oil prices and global supply. The December 2022 Russian oil price cap led to a bigger fall of about 4.8%. This came at a time when global inflation was already high and energy markets were sensitive, so the shock had more room to affect equities.
And then there was one clear outlier. Only 1 of the 8 episodes saw the Nifty fall more than 5%. In February 2022, the Nifty fell about 7% from its 23 February close. But this was not a clean sanctions-only event. Russia’s invasion of Ukraine happened at the same time, triggering a much broader sell-off across global markets. So it is difficult to say how much of that 7% fall came from the sanctions alone.
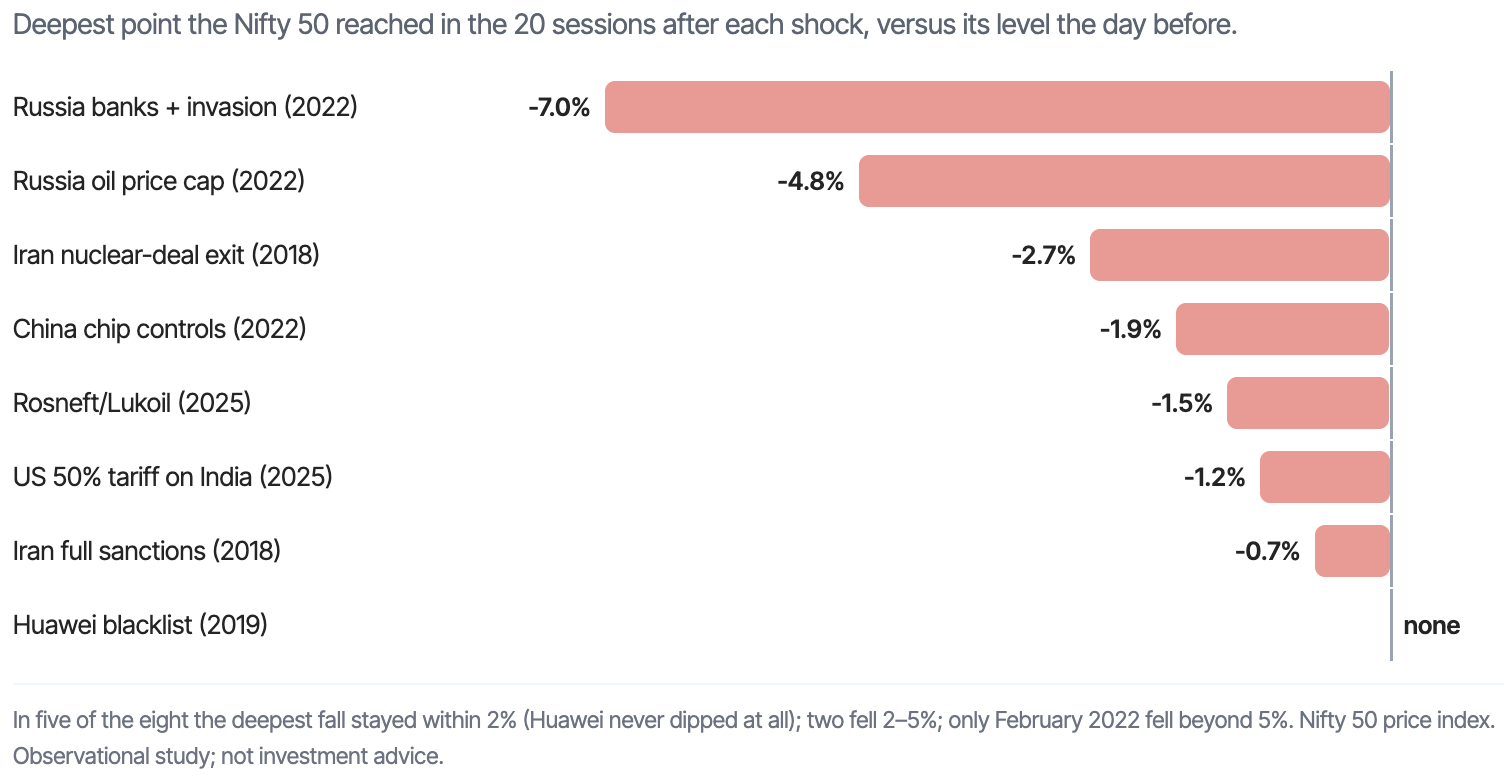
Each bar in the chart shows the maximum fall (peak-to-trough) in the Nifty over the 20 trading sessions after each event, measured against the Nifty’s closing level on the day just before the event or announcement happened. It helps compare how deep the market actually went in each case, rather than just how it reacted on the day of the announcement.
A 1% or 2% move might not sound dramatic, but in market terms it still reflects real uncertainty. The key takeaway, however, is that the initial fear in headlines was usually much larger than the actual, sustained impact on the index.
How long did the fall last?
How far the market falls is only one part of the story. A small fall can still hurt if the market stays down for a long time.
So for the 7 events where the Nifty fell below its level before the announcement, we looked at how long it took to recover from its lowest point and close back at or above that starting level.
In most cases, the recovery was fairly quick.
4 of the 7 events recovered within 5 trading sessions of hitting their low. The Nifty recovered in just 1 session after the Iran sanctions were fully reimposed, 3 sessions after the Rosneft-Lukoil sanctions, and 5 sessions after both the China chip controls and the 2025 India tariff.
Another 2 recovered within 8 sessions. The 2018 Iran nuclear-deal exit took 6 sessions, while the February 2022 episode took 8.
That leaves just 1 clear exception: the December 2022 oil price cap, which had still not recovered 60 sessions later. We look at it separately below
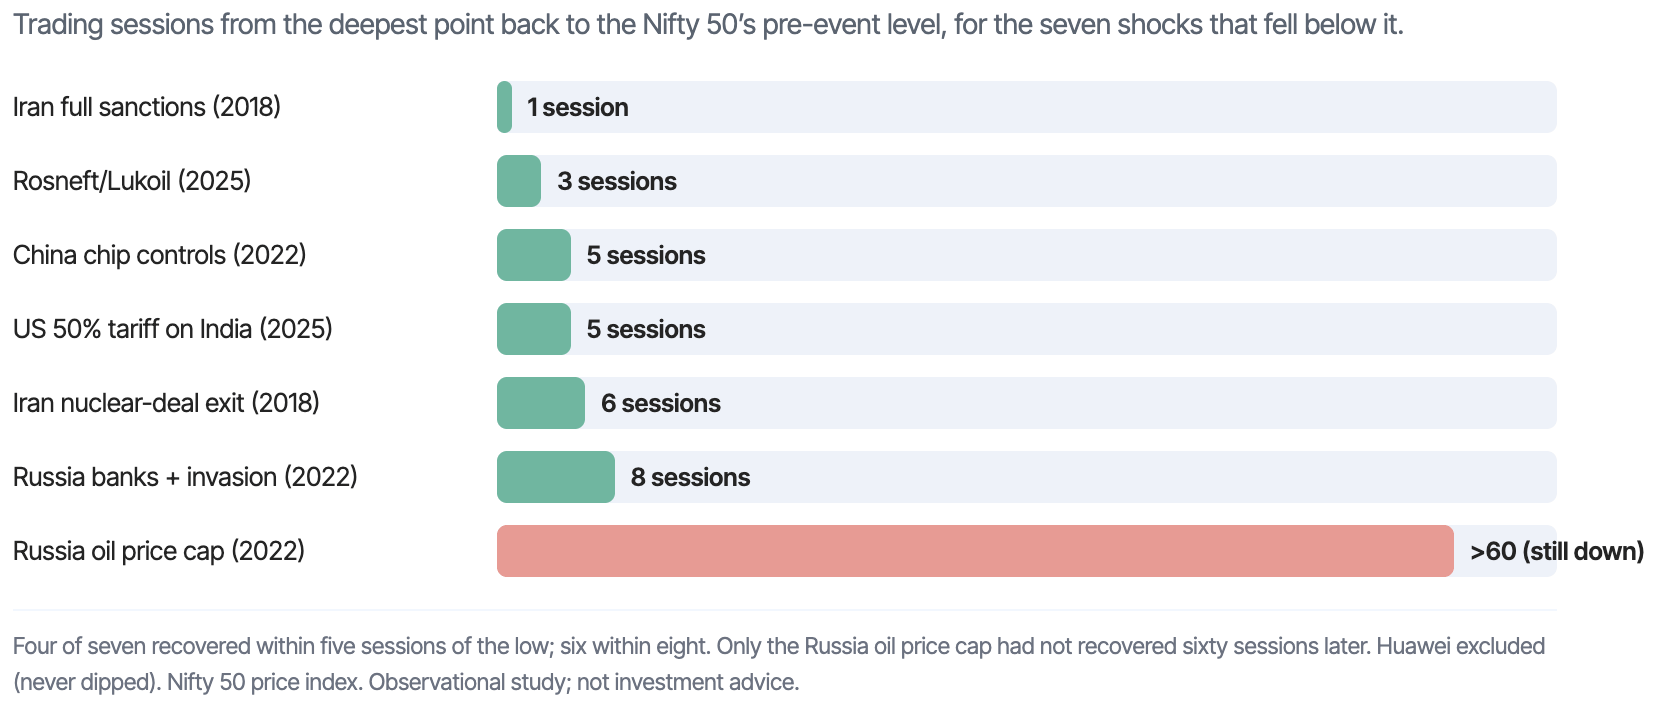
This shows how many trading sessions it took for the Nifty to recover from its lowest point back to its pre-event level. In other words, it measures how long the market stayed weak after the initial fall before getting back to where it started. Huawei is excluded because the Nifty never fell below its pre-event close.
But there is an important distinction here. When we say the Nifty “recovered”, we only mean that the index returned to its pre-event level. It does not mean the sanctions disappeared or stopped having an economic impact. The market was also reacting to many other things at the same time.
Did bigger falls take longer to recover?
The next question is an intuitive one.
If the market falls more after a sanctions shock, does it also take longer to recover?
If that were true, the size of the fall could at least tell investors something about how serious the weakness might become.
But in these 8 episodes, that pattern does not really show up.
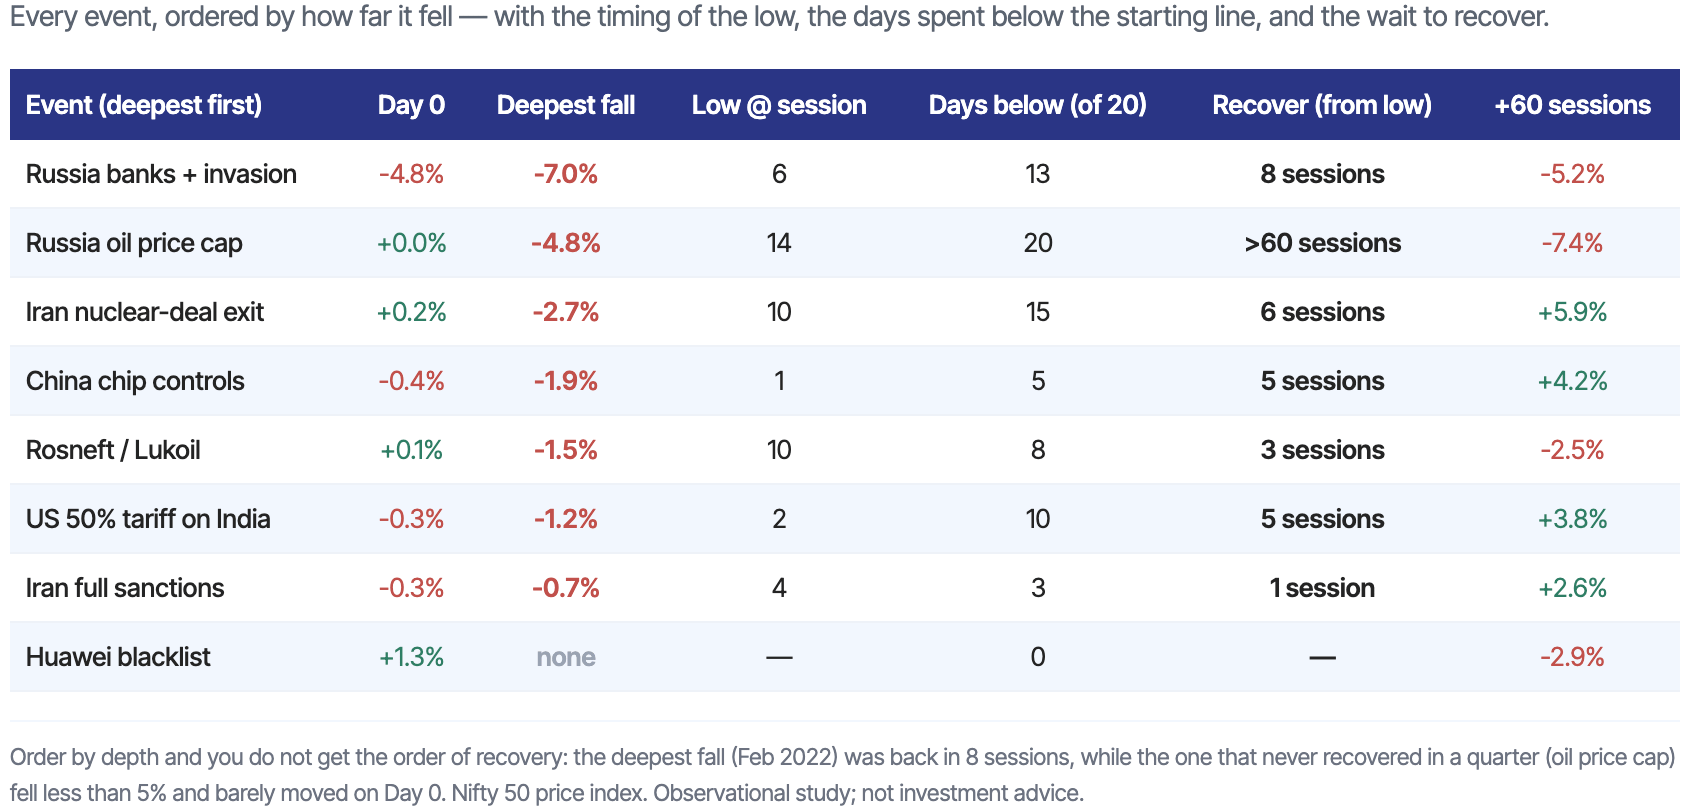
This table shows each event in order of how much the Nifty fell. For every case, it also tells you when the lowest point happened, how many days the index stayed below its starting level, and how long it took to recover back to that level.
Take February 2022. It produced the deepest fall in the entire sample, with the Nifty dropping about 7%. Yet once the market hit its low, it took only 8 trading sessions to get back to its pre-event level.
Now compare that with the December 2022 oil price cap. The Nifty fell less, about 4.8%, but it still had not recovered 60 sessions later.
The smallest fall did recover the fastest: after the full Iran sanctions were reimposed, the Nifty’s deepest decline was just 0.7%, and it recovered in 1 session. But beyond that, there is no clear pattern where a deeper fall automatically meant a longer recovery.
The timing of the lowest point was unpredictable too.
In 7 of the 8 episodes, the Nifty did not hit its lowest point on Day 0. The low came anywhere from 1 to 14 trading sessions later.
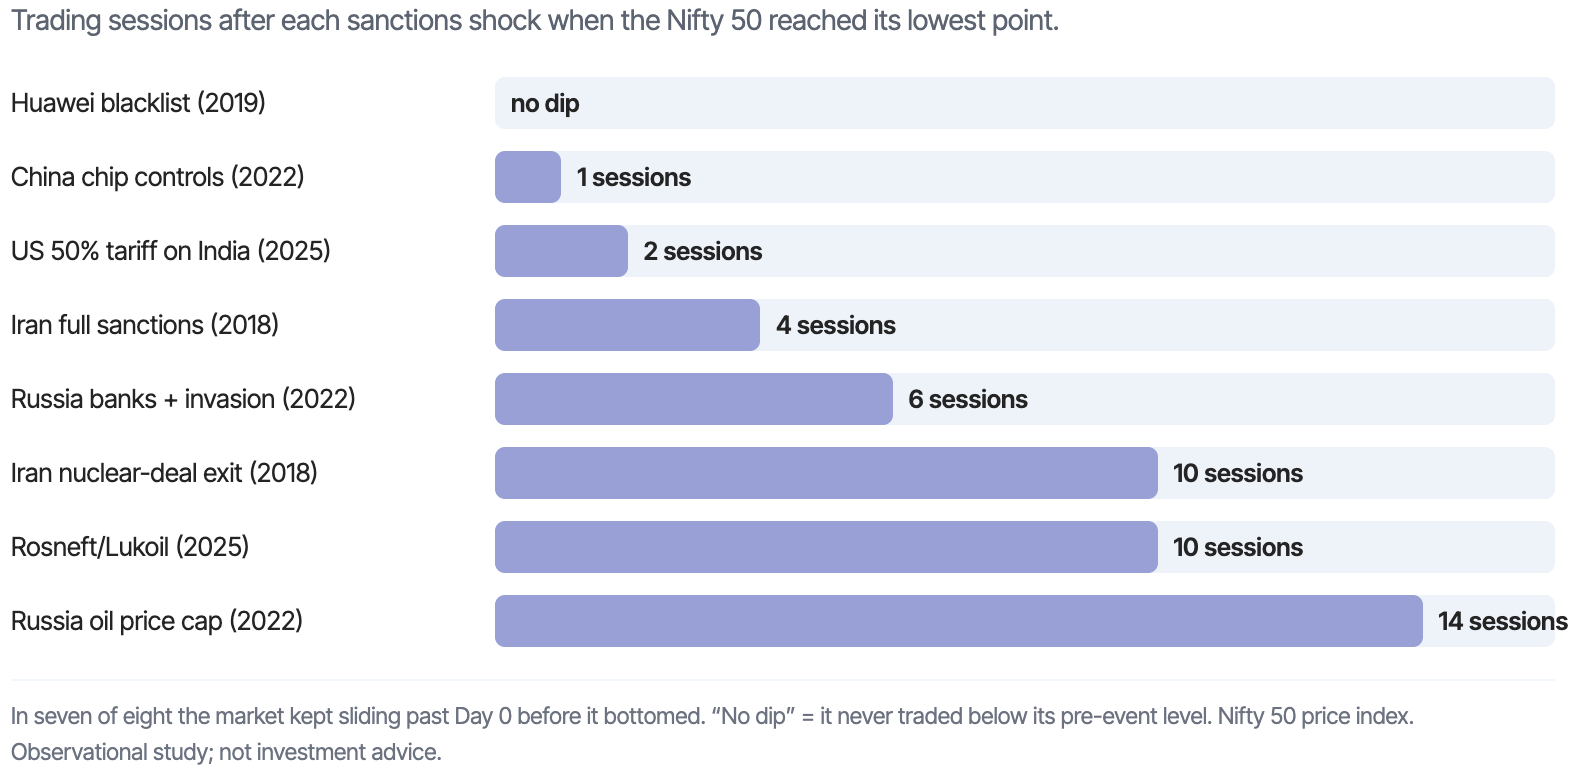
So the market’s first reaction did not tell you how far it would eventually fall, how long the weakness would last, or even when the worst point would arrive.
Sessions after each shock when the Nifty reached its lowest point. In most cases, the low did not arrive on Day 0.
What if you sold when the news came out?
So far, we’ve looked at what the market did after these events. But for an investor reading the headline, the decision is either sell or stay invested?
To test that, let’s assume you sold the Nifty at the end of Day 0 because the sanctions news felt scary.
We then looked at what actually happened over the next month.
In 6 of the 8 cases, the Nifty was higher 20 trading sessions later than it had been when you sold.
Only 2 of the 8 cases ended the month below the Day-0 selling level
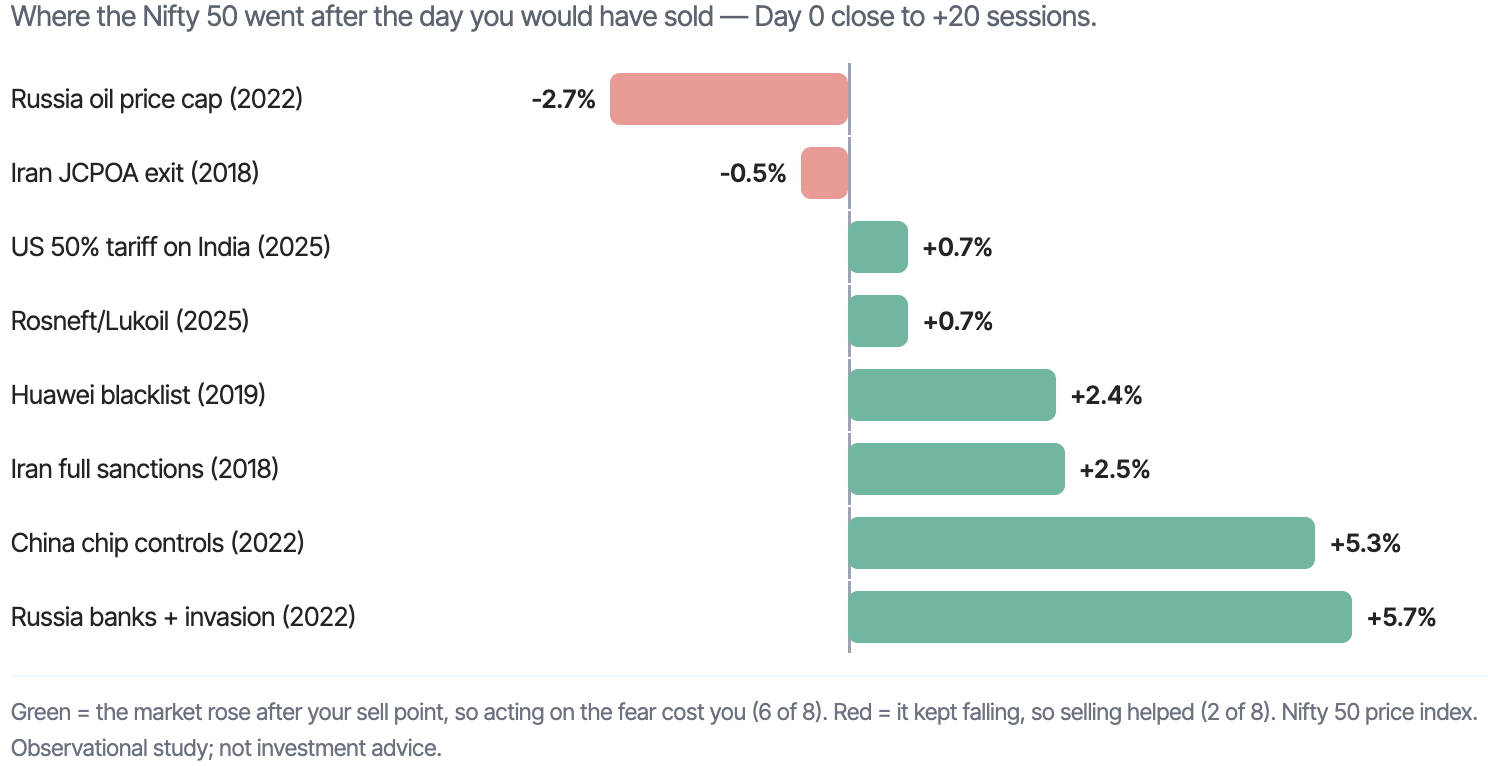
This shows where the Nifty was 20 trading sessions after Day 0 — i.e., the level an investor would have been at if they sold immediately after the news and checked back a month later.
But there is an important catch here.
Looking at it does sound impressive. The Nifty was higher after 6 of the 8 sanctions events. But that alone doesn’t mean much, because markets usually go up over time anyway.
In our full dataset of 4,331 starting points, we looked at what happens if you pick any random day and check where the Nifty is 20 trading sessions later. In about 61.3% of those cases, the index was higher than where it started.
Basically it means that in most normal periods, the market tends to go up over a one-month horizon. So when we see that 6 out of 8 sanctions events also ended higher after 20 sessions, it is not unusual by itself; it is actually quite close to how the market behaves in general.
So this does not mean sanctions were good for the market. It simply means that these sanctions episodes were not followed by unusually bad one-month returns.
In other words, a rule that says “sanctions have been announced, so sell for the next month” would not have worked consistently in this sample.
And if we extend the period further, there is no clear pattern either. After 60 trading sessions, the Nifty was higher in only 4 of the 8 cases.
To understand whether that is unusual, we compare it with normal market behaviour. In the full historical data (across all time periods, not just sanctions events), the Nifty is higher after 60 trading sessions about 66.5% of the time (about 2 out of every 3 times, the market is higher 3 months later anyway).
So neither the one-month nor the three-month numbers give us a reliable rule for what the market does after sanctions.
Conclusion
Across the eight events we studied, the Nifty’s response was generally modest. In 5 out of 8 cases, the maximum fall over the next month stayed within 2%, and only one case saw a decline greater than 5%. Of the events where the index did fall, six of seven recovered their pre-event level within eight sessions of the low, and in 6 of 8 cases, an investor who sold on Day 0 would have been worse off a month later.
Taken together, the pattern suggests that sanctions headlines do not consistently lead to large or persistent equity drawdowns in India.
That said, the reaction is not random or meaningless. It happens because the market has to price something it doesn’t fully understand yet.
On Day 0, investors react to what could go wrong, like trade getting disrupted, payment issues, supply chains breaking, or tensions getting worse. But at that point, nobody knows how much of it will actually happen.
As more details come out, companies adjust, exemptions get added, and global trade finds new routes. That’s why the initial fear often fades.
So the first reaction is often bigger than what actually ends up happening, because the market is reacting to many possible bad outcomes, most of which don’t fully play out.
That said, this is not a reason to ignore these events. The headline is just the starting point. What matters more is what the restriction actually changes for the companies involved, how directly they are affected, and whether the market has already priced in a worst-case scenario.
Sanctions can definitely have real economic impact. But in this sample, the initial fear on announcement day was not a very reliable guide to how much Indian equities would fall, or how long any weakness would last.
Also, with only 8 highly heterogeneous events, I’d treat this as descriptive evidence rather than a robust statistical rule.