

In 2020, the world came to a standstill.
Markets crashed, businesses shut down, and uncertainty ruled.
During this time, the Reserve Bank of India (RBI) stepped in and lowered its benchmark interest rate, a move designed to push more money into the economy.
The goal was simple: to keep the economy moving and prevent a complete collapse.
But what exactly is this interest rate? And how does it affect people like us?
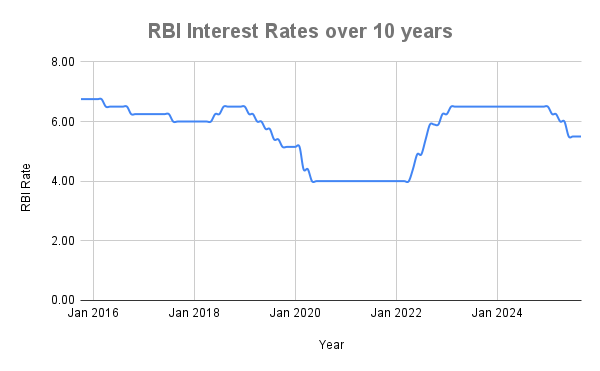
A few times a year, the RBI announces its decision on the repo rate: the rate at which banks borrow money from the central bank (RBI).
It might sound like a technical number, but it actually touches almost every part of your financial life: your loan EMIs, your credit card interest, your fixed deposits, and even the stock market.
The decisions about the interest rate depends largely on inflation and how the RBI wants the economy to move next.
Think of it as the central bank’s accelerator. Pressing down to speed up growth, and the other to slow things down when prices rise too fast.
So we decided to test out a strategy — what if you adjusted your investments according to RBI interest rate decisions? Could this potentially get better returns?
How does this interest rate work?
When the RBI lowers the repo rate, banks can borrow money more cheaply.
This means loans also become cheaper for both businesses and consumers, encouraging spending, borrowing, and investment.
But there’s a flip side too.
Returns on fixed deposits and savings accounts also fall, making traditional savings less attractive. As a result, people often look for better opportunities, such as investing in mutual funds, shares, or real estate.
For the economy, this shift is intentional.
The RBI wants money to move, not sit idle.
Lower interest rates are meant to stimulate demand, support business expansion, and boost overall economic activity.
As a result, corporate earnings often rise, and stock markets tend to react positively, pushing share prices higher.
When the RBI raises rates, the story flips.
Borrowing becomes more expensive, and both consumers and businesses start tightening their belts.
Higher EMIs on home loans, car loans, and personal loans mean people spend less and save more.
For companies, borrowing costs rise, and consumer demand weakens. Expansion plans may be delayed, and profitability often takes a dip.
But the other side?
Returns on fixed deposits and bonds usually increase, making them more appealing to investors.
When interest rates are high, money tends to flow from riskier assets like share markets into safer options such as debt mutual funds, bonds, or bank deposits.
So we decided to test out a strategy — what if you adjusted your investments according to RBI interest rate decisions? Could this potentially get better returns?
The Experiment
Let’s say an investor sets aside Rs 10,000 every month. The money is invested at the start of each month across equity mutual funds and debt mutual funds (debt mutual funds signify fixed-income investments like FDs and bonds which are considered safer than equity investments or shares).
Initially, the split is 50-50.
But after that, whenever the RBI cuts rates, the allocation tilts more towards equity (say, 60-40 or 70-30).
And when the RBI hikes rates or keeps them high, the balance shifts towards debt.
Each change takes effect from the following month.
To compare, we also considered two other simple strategies:
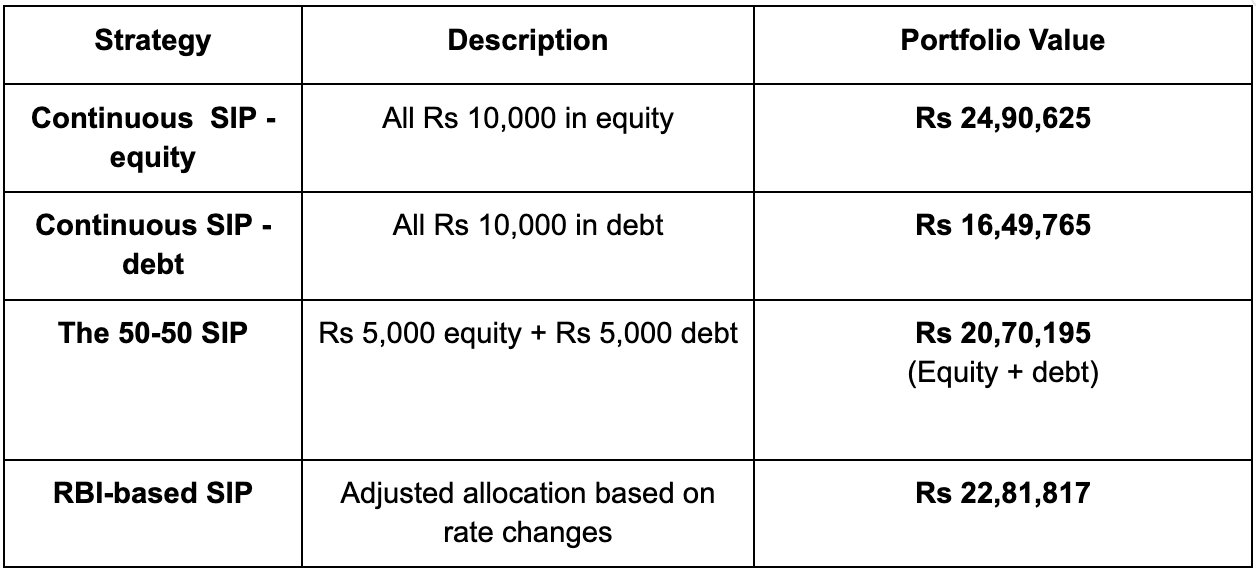
Continuous SIP in equity: Rs 10,000 invested entirely in an equity mutual fund every month.
Continuous SIP in debt: Rs 10,000 invested entirely in a debt mutual fund every month.
The 50-50 SIP: Rs 5,000 in equity and Rs 5,000 in debt, unchanged, no matter what the RBI does.
For this, we used Nifty 50 TRI as a proxy for equity mutual funds data and the Nifty 10-Year G-Sec Index for debt mutual funds data, over a 10-year period from Oct 2015 to Sept 2025 (120 months).
To put it simply: ride the wave of rate cuts by leaning into equities, and when rates rise or stay high, move towards debt for safety.
Results
Throughout the 10 year period, the RBI cut/hiked interest rates multiple times. This meant the RBI-based strategy frequently adjusted its allocations for this 10 year period.
Here is a look at how the monthly investments looked for each strategy.
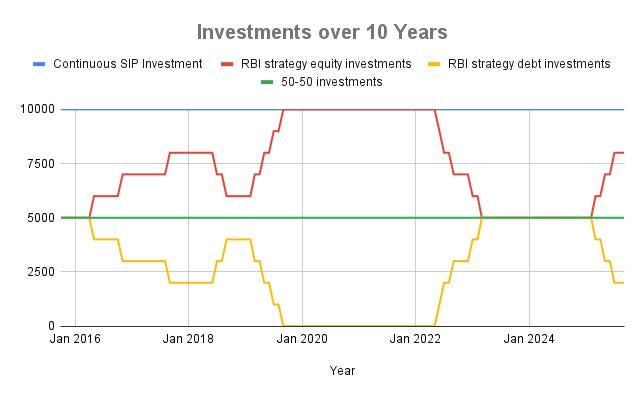
During the Covid-19 pandemic, interest rates were kept low for an extended period to support the economy. Thus, according to our strategy, this meant all money went into equity and none into debt for that period of time.
The continuous SIP investments in equity and debt and the 50-50 SIP maintained fixed allocations throughout.
Conclusion
This experiment reinforces a few important truths about investing. In the long term, investing in the share market tends to give higher returns..
The simple equity-only SIP delivered the highest returns, showing that staying invested consistently in the market often beats trying to time it.
But it is also important to acknowledge that investing in equity comes with higher risk. Market swings can be sharp, and short-term losses are possible.
Surprisingly, the RBI interest rate strategy that we tested wasn’t far behind the equity-only SIP. By adjusting allocations in line with interest rate cycles, it managed to outperform the fixed 50-50 plan while maintaining some diversity in the portfolio.
During rate-cut cycles, especially during the pandemic, leaning more into equity captured the rally, while shifting toward debt during rate hikes protected capital.
The fixed 50-50 approach did reasonably well but fell short of the RBI-based strategy. Investing purely in debt, while the safest, gave the lowest returns. There is always a trade-off — safety or growth?
Risk and reward go hand in hand: debt protects, equity grows.
The RBI-based strategy offered a middle path here. It worked better than a fixed 50-50 allocation, a safer path than going all-in on equity, while also managing to navigate market cycles.
Few things to keep in mind — Equity returns or share market returns are unpredictable and influenced by many factors: corporate earnings, global liquidity, investor sentiment, and geopolitical events. Rate cuts can influence these factors, but they cannot predict every market move.
In short: Equity does give the highest returns. But it also means higher risk. Considering risk and diversification, the RBI-based strategy worked well.
But looking at this beyond any specific strategy, paying attention to macroeconomic trends might help you manage risk and improve your investment outcomes — something that we might overlook.
Limitations
We used index data (Nifty 50 TRI for equity and Nifty 10-Year G-Sec for debt) instead of actual mutual fund returns. Real fund performance may differ slightly.
It is based on historical performance, which cannot perfectly predict future outcomes.
The strategy assumes perfect timing with RBI rate decisions, something that’s rarely possible in day-to-day investing.
Market movements don’t always mirror rate changes.
The simulation excludes transaction costs, taxes, and fund-specific expenses, which could impact actual returns.
The study covers the last 10 years only. Different economic cycles could give different results.