

On 18 June 1983, India was in serious trouble against Zimbabwe.
They were at 17 runs for 5 wickets. Five batsmen were already out, and the World Cup campaign looked almost over.
Then Kapil Dev came in and scored 175 not out. India finished with 266 runs.
Now, if you only saw the final score, which was 266, you might think the whole team batted well.
But that was not the case.
Kapil Dev alone scored 175. The next-highest score was just 24. Most of the team contributed very little.
So the final total looked strong, but it did not show what actually happened inside the team.
That idea of a single headline number hiding a very uneven reality is also useful when we look at markets, though in a slightly different way.
On 2 January 2026, the Nifty 50 closed at an all-time high. It was up 0.7% that day, and the market looked strong on the screen. Since this milestone came after over one year of underperformance, it seemed like the worst was over.
But many investors did not feel this way. Most noticed that their portfolios were red or flat despite Nifty being at an all-time high.
Some were green, but investors were still confused because the Nifty went up 0.7% on that day, but their portfolio was up 0.2%. Technically, they knew they made money. But it did not align with what they saw on the screen for Nifty 50.
So how can the Nifty be at a record high level while your portfolio is not?
Because, like a cricket total, the Nifty is one number. And one number can hide how the individual players did.
To understand this, we decided to study the biggest rallies and falls of the last 15years to see whether the Nifty 50 is a good indicator of portfolio performance.
The study
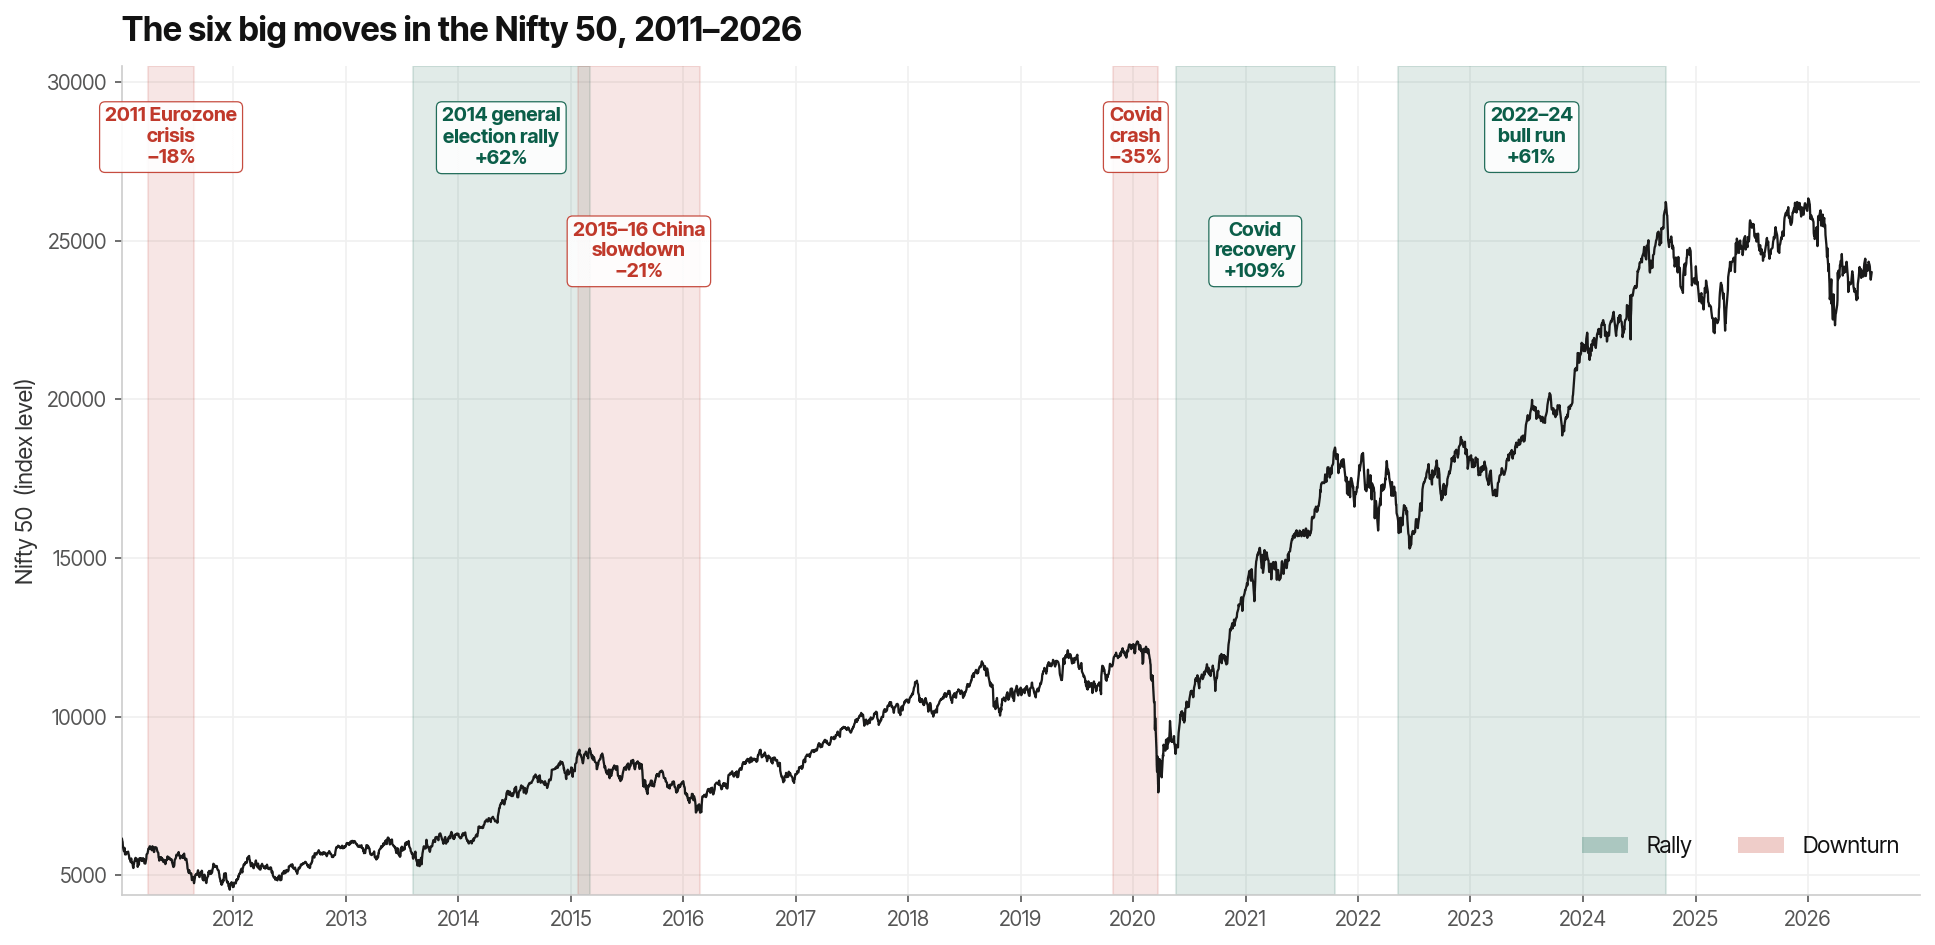
We took fifteen years of Nifty 50 data and identified its 3 biggest rallies and falls. A rally began when the Nifty started rising from a recent low. If it gained at least 10% before reaching its peak, we counted it as a rally. The rally ended once the index fell 10% from that peak.
Similarly, a downturn began when the Nifty started falling from a recent peak. If it declined by at least 10% before reaching the bottom, we counted it as a downturn. The move was considered over once the index recovered 10% from the bottom.
For each of these six moves, we did two things.
First, we compared the Nifty 50 with two broader indices, the Nifty Midcap 150 and the Nifty Smallcap 250, over exactly the same dates. This helped us to see whether mid-sized and smaller companies performed differently from the large companies in the Nifty 50.
Second, we looked inside the market itself.
For each period, we took the Nifty 100 stocks that were part of the index on the first day of that move. We did not use today’s list, because that would allow hindsight to affect the results.
We then calculated the return of each stock over the period and counted how many stocks beat the Nifty and how many lagged behind it.
A few companies from the older periods have since been delisted, merged or renamed and could not be priced. So, depending on the period, our analysis includes between 84 and 96 stocks instead of the full 100.
Everything went up. Some things went up much more.
So in the three rallies we studied, the broader market did not merely follow the Nifty. It amplified the move.
An investor with a meaningful mid-cap or small-cap allocation could therefore have experienced a much stronger rally than the Nifty suggested.
But this cannot be turned into a general rule that the broader market always moves more sharply.
The three falling periods produced a more mixed result.
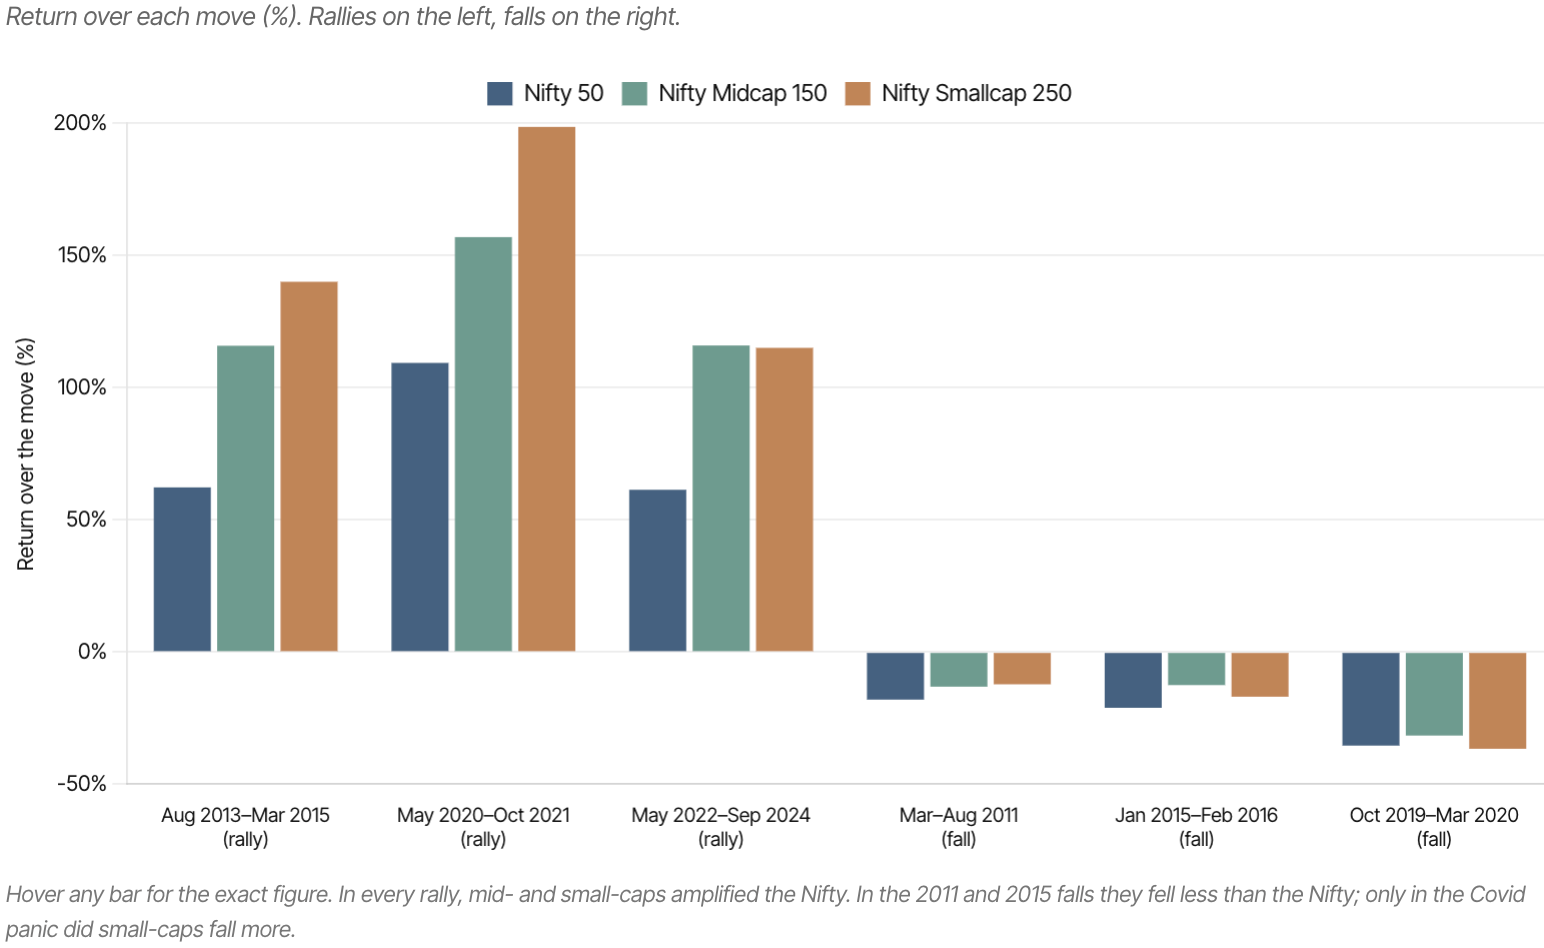
During the covid crash, Nifty fell 35.40%, and the small-cap index fell slightly more at 36.60% in the same period. This makes sense with the high-beta theory.
Beta measures the stock’s volatility. The baseline for the index is typically 1. If a stock is a high-beta stock, it means that its stock price moves faster and more aggressively than the market. It amplifies the move in the market. Mid-caps and small-caps are considered to be high-beta stocks.
The midcap index however, fell only 31.60% in the 2019 downturn.
In fact, in the other two downturns of the study, both midcaps and smallcaps fell less than Nifty.
So investing in the broader markets seems like a great bet, right? Amplified returns but lesser losses? That is not always the case.
One possible reason the downturns behaved differently is that each was caused by a different type of selling.
It is important to note that the downturn in 2011 and 2015 was driven by factors that affected large-caps specifically.
The falls in 2011 and 2015 happened during global risk-off periods (the Eurozone crisis and China’s economic slowdown). Foreign investors were pulling money out of Indian stocks during these periods.
Since foreign investors typically invest in large and liquid companies, these large-cap stocks or Nifty 50 stocks, faced more selling pressure. Midcaps and smallcaps remained relatively less affected as domestic investors are the majority investors in these.
Covid crash was different, it was not a calculated sell-off but what is known as a panic sell-off.
When investors are in panic mode, the number of buyers for smallcaps goes down since it is riskier compared to large-caps.
Another factor is valuations. If midcaps and smallcaps are perceived to be valued higher than their actual worth, then any negative trigger can cause them to fall sharply.
If the valuations were cheaper, then those may not have fallen as much as the others.
That is why the mix of stocks in a portfolio matters.
An investor with more midcap and smallcap stocks may have earned much more than the Nifty during the rallies. During the falls, however, the experience depended on the particular period and the stocks they owned.
Either way, the Nifty may not have reflected what that investor actually experienced.
But this still does not explain why portfolios made up mainly of large-cap stocks can also perform very differently from the Nifty.
Why did some large-cap investors still feel left behind?
The answer lies not only in how much the market rose, but also in how unevenly those gains were spread across stocks.
Everything rose, but not equally
We decided to dig deeper and took the Nifty 100 constituents as they existed at the start of each period and measured how each individual stock performed.
We also counted how many of those stocks actually beat the Nifty and compared the index return to the return of the typical, or median, stock.
Some constituents from the older periods have since been delisted, merged, or renamed and could not be priced. These were excluded, so the number of priced stocks per period ranges from 84 to 96 rather than a full 100. The older periods are therefore based on slightly fewer stocks.
Nifty 100 stocks that beat the index vs those that lagged, in each move. The label above each bar is the share that beat it.
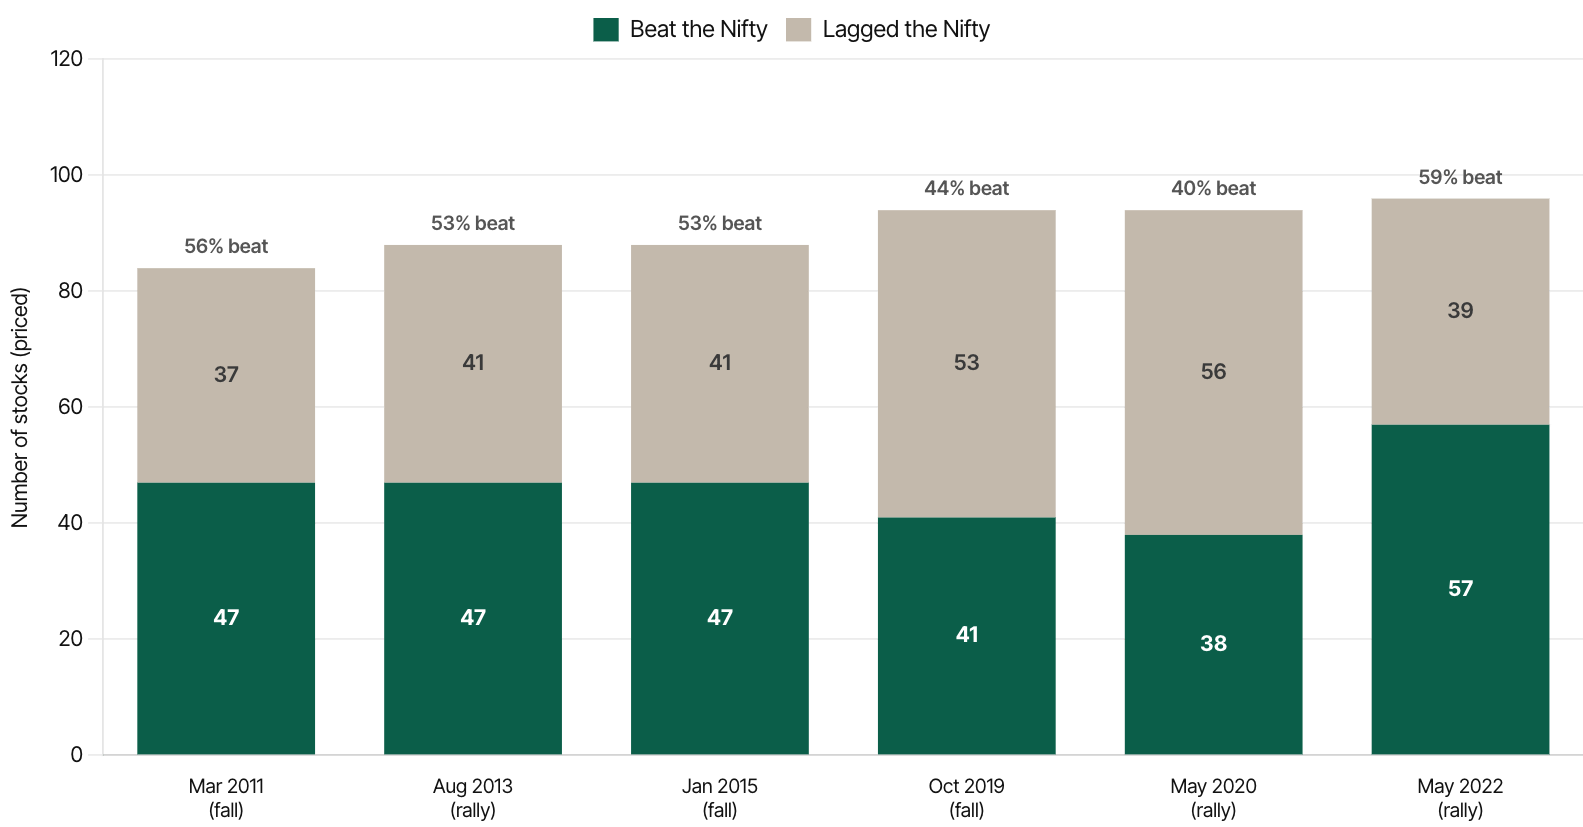
“Beat the Nifty” means the stock did better than the index — it fell less, or rose. A move where most stocks beat the index (like May 2022) is broad; one where few do (like May 2020) is narrow.
All 94 stocks in the covid recovery rally from May 2020 rose with Nifty. Not one fell.
However, only 38 of these actually beat the Nifty’s 109% returns. This means the majority of them, 56 of them or around 60% rose but less than the Nifty.
In the May 2022 rally, nearly 60% of the 96 stocks that we studied beat Nifty.
How is that possible?
The Nifty index is made up of the 50 biggest companies – weighted by size. So the biggest among these 50 carry a higher weight. If a handful of these heavyweights rally, it can move the Nifty index meaningfully and much faster than most of the individual stocks are actually moving.
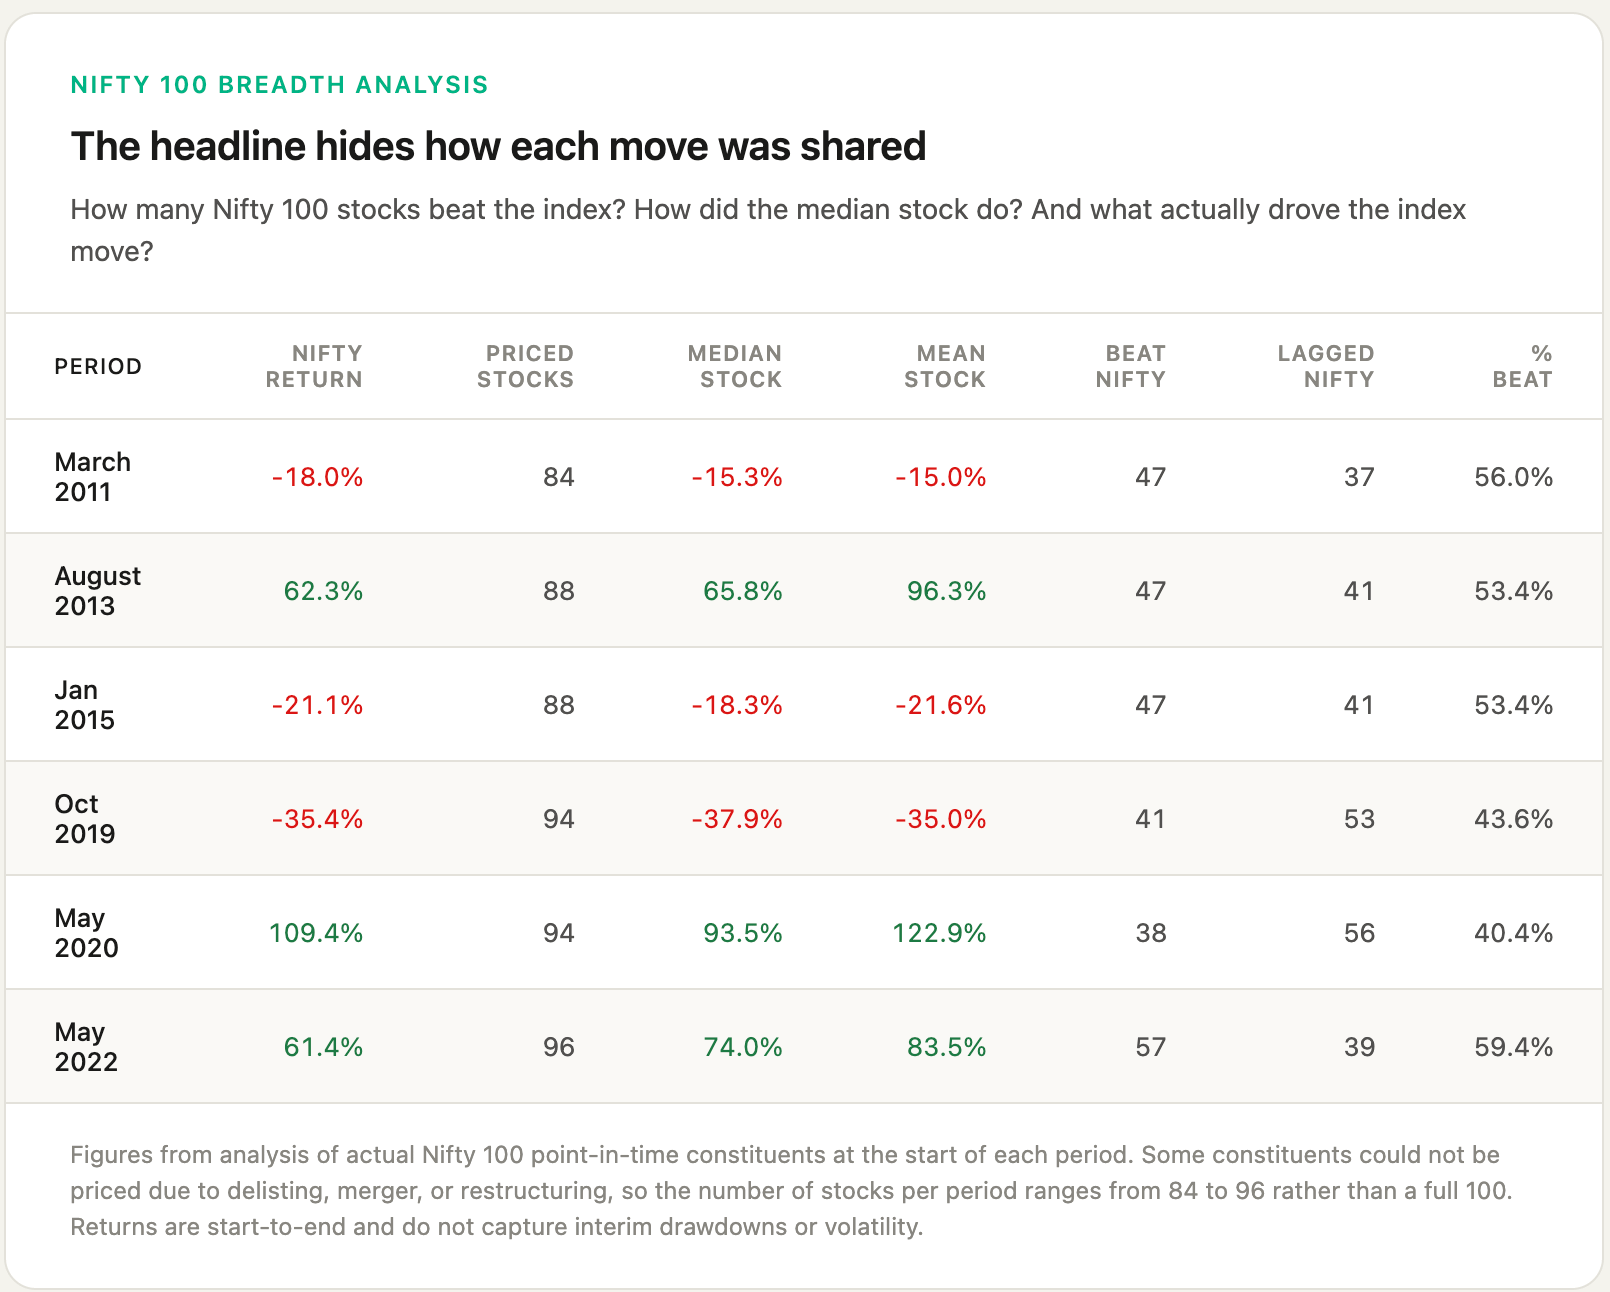
So the median stock rose 93%, while the Nifty index rose 109%. This difference of 16% came from the few large-cap companies that did most of the heavy lifting.
Simply put, if an investor’s portfolio was made up of Nifty stocks but not the exact ones that led the rally, then their portfolio may have gone up. But not as much as the index did.
Everything went up. It just did not go up equally.
90 out of the 94 stocks in the study fell during the October 2019 downturn. Almost everything fell, but not in the same magnitude.
41 stocks fell less than Nifty, while 53 stocks fell more than the index itself. Of course most of them fell in this period but not all of them. The median stock fell 37.9%, which means the average stock fell more than Nifty itself.
So portfolios that had most of the stocks which remained resilient during the fall may have fallen less. And vice versa.
Not all rallies are built the same
Now let’s compare two rallies: the May 2020 and May 2022 rallies.
We found out that only 40% of the Nifty 100 stocks beat the index during the May 2020 rally.
On the surface the index looks strong, but most of its constituents did not keep up with it.
This is called a narrow rally. The index is pushed higher by a relatively small group of strong-performing stocks, while most others lag behind.
The 2022 rally was different. A majority of the stocks participated, and the median stock performed better than the Nifty.
This is called a broad rally, where gains are spread across a larger number of stocks.
You cannot tell whether a rally is broad or narrow simply by looking at how much the Nifty has risen. The index can show a similar gain in two periods, while the experience of individual stocks can be completely different. To understand that, you have to look inside the index.
The same is true during downturns.
During the downturn that began in March 2011, 47 of the 84 stocks in our study fell less than the Nifty. The median stock also performed better than the index.
This means the decline was not spread evenly across most stocks. A smaller group of heavily weighted stocks pulled the Nifty down more sharply.
This brings us to an important point: the Nifty is not the entire market. It is a weighted index of 50 large companies, and the largest companies have the greatest influence on its movement.
Most investor portfolios do not hold the same stocks in the same proportions as the Nifty, so their returns depend on what they own.
A portfolio with more midcaps and smallcaps may behave very differently from one made up mainly of large-cap stocks. These segments usually move more sharply than the Nifty, though not in every period.
Even two large-cap portfolios can have very different returns. One may own the few stocks driving a narrow rally, while the other may not.
No two rallies or downturns are exactly the same. A portfolio may perform well in one and lag in another, depending on its holdings and whether the market move is broad or narrow.
What This Tells Us
The Nifty tells us how a particular basket of 50 large companies performed, based on their weights in the index.
It does not tell us how the typical stock performed or how an investor’s portfolio performed.
Suppose the Nifty rises 20%, driven mainly by a few heavily weighted companies. An investor who does not own those companies in similar proportions may lag, even if most of their stocks performed reasonably well.
That does not necessarily mean the portfolio was badly constructed. It may simply mean that the portfolio and the index owned different stocks in different proportions.
The reverse is also possible. When gains are spread across a larger number of stocks, a portfolio may rise more than the Nifty without owning its biggest constituents.
So before comparing a portfolio with the Nifty, investors should first ask whether it is the right benchmark.
A portfolio with mostly midcaps and smallcaps should not be expected to move like a large-cap index. But even a large-cap portfolio may behave differently unless it holds roughly the same companies in roughly the same weights.
Conclusion
The Nifty is not misleading. It is doing exactly what it is designed to do.
The mistake is expecting one market number to describe every portfolio.
When the Nifty reaches an all-time high and your portfolio does not, it may simply be because the stocks driving the index are missing from your portfolio or are held in smaller proportions.
Similarly, when your portfolio rises more than the Nifty, it may be because you own parts of the market that are performing better or because the rally is spread across more stocks.
So the real question isn’t just whether your portfolio beat the Nifty. It is whether what you owned was similar enough to what actually drove the Nifty in the first place.
The thing is, Nifty gives us the final scoreboard. But to understand what an investor experienced, we still need to look at the players who produced it.
Very good analysis