

2000s - 2011
2000s-2011 saw a new gold bull run.
Gold entered the 2000s at relatively low levels. In 2001, the annual average price was around $270 per ounce. From this base, it began a steady climb. By mid-2006, gold had crossed $600 per ounce, with an annual average of $603 in 2006 and $695 in 2007.
The real acceleration came after the 2008 global financial crisis. By late 2010, gold had surged above $1,300 per ounce. The annual average for 2010 was $1,224 per ounce, and by December 2010 it was averaging over $1,400 per ounce.
This rally peaked in August–September 2011, when gold reached its all-time nominal high of $1,921.11 per ounce on September 6, 2011.
Main Driver: Global financial crisis and geopolitical turmoil (safe-haven demand)
Followed by: Ultra-loose monetary policy, inflation fears, and the early phase of renewed de-dollarization.
Crisis Sparks Flight to Gold
The U.S. stock market crashed badly during the 2008 financial crisis, falling almost 57 percent from its October 2007 peak to its lowest point in March 2009. The U.S. economy also shrank sharply, with GDP contracting by 4.3 percent from late 2007 to mid-2009.
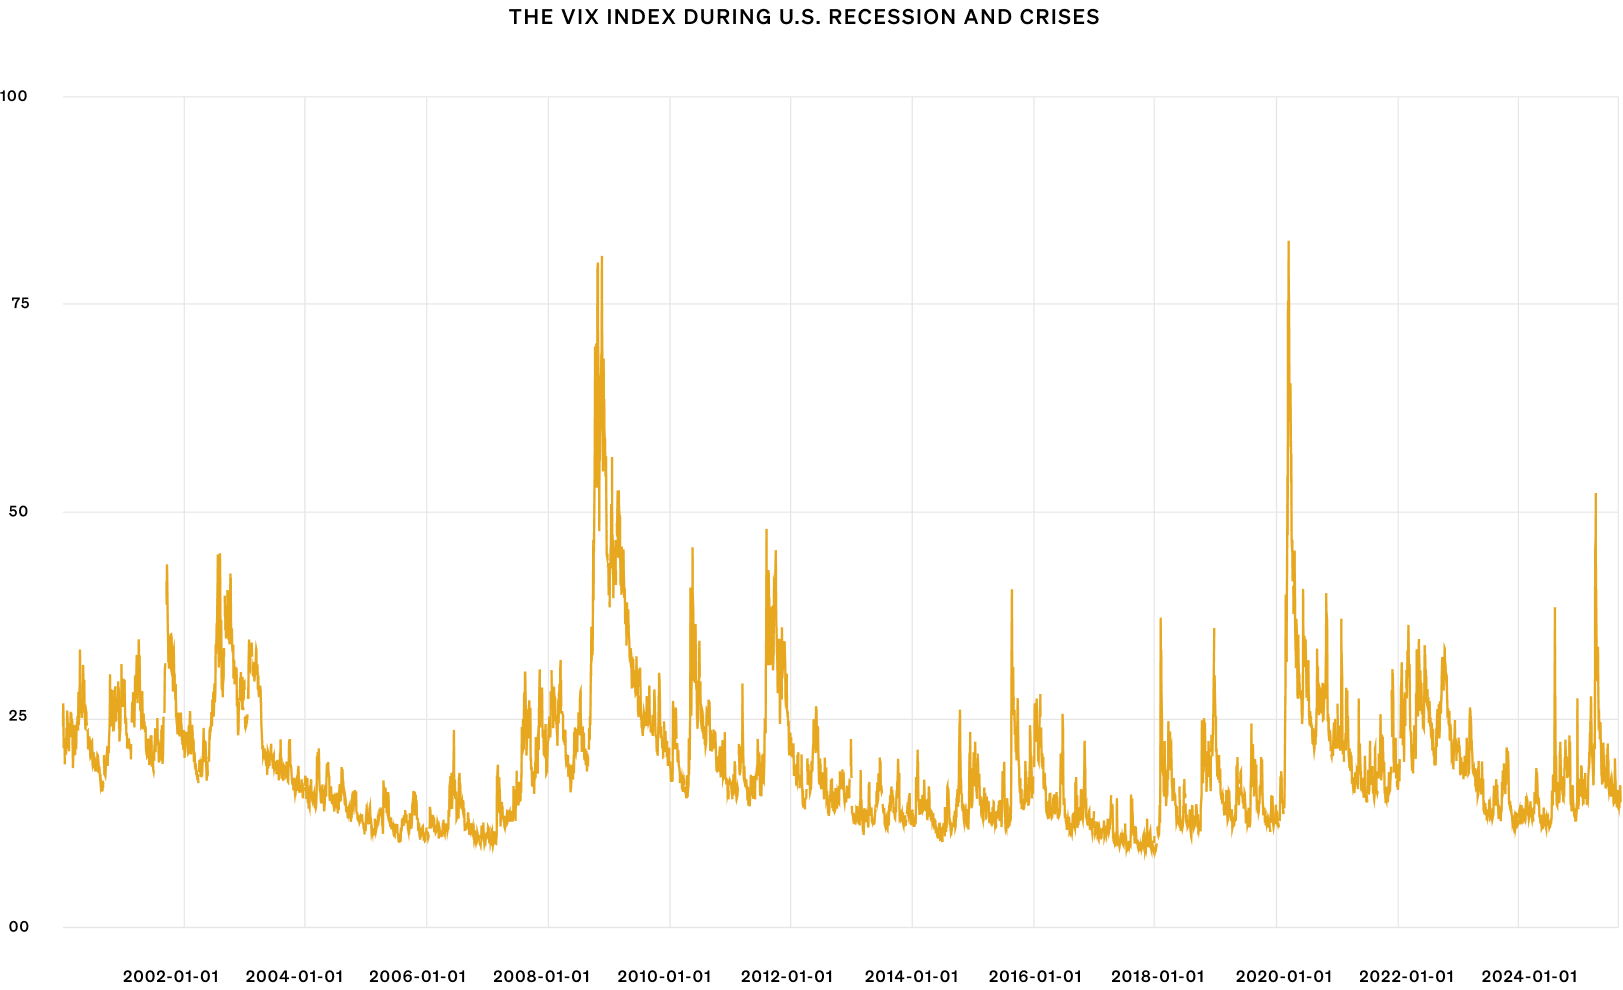
Fear in the market was extreme. The VIX index, which measures volatility spiked to 80.86 in November 2008. It was one of the highest readings ever recorded.
The panic deepened when Lehman Brothers went bankrupt on September 15, 2008, followed by the Federal Reserve’s $85 billion bailout of AIG just a day later. These events made investors worry about a total collapse of the financial system.
In this fear, investors rushed to safe-haven assets, and gold became their top choice. This wave of fear-driven demand was the initial spark that sent gold prices climbing.
Ultra-loose monetary policy (interest rate cuts + money printing)
In this crisis time, to save the system, the U.S. Federal Reserve (and other central banks) slashed interest rates to 0% and began quantitative easing (QE) — printing trillions of dollars to buy bonds and inject liquidity. With interest rates at zero and inflation expectations starting to rise, real interest rates turned negative, making cash and bonds unattractive.
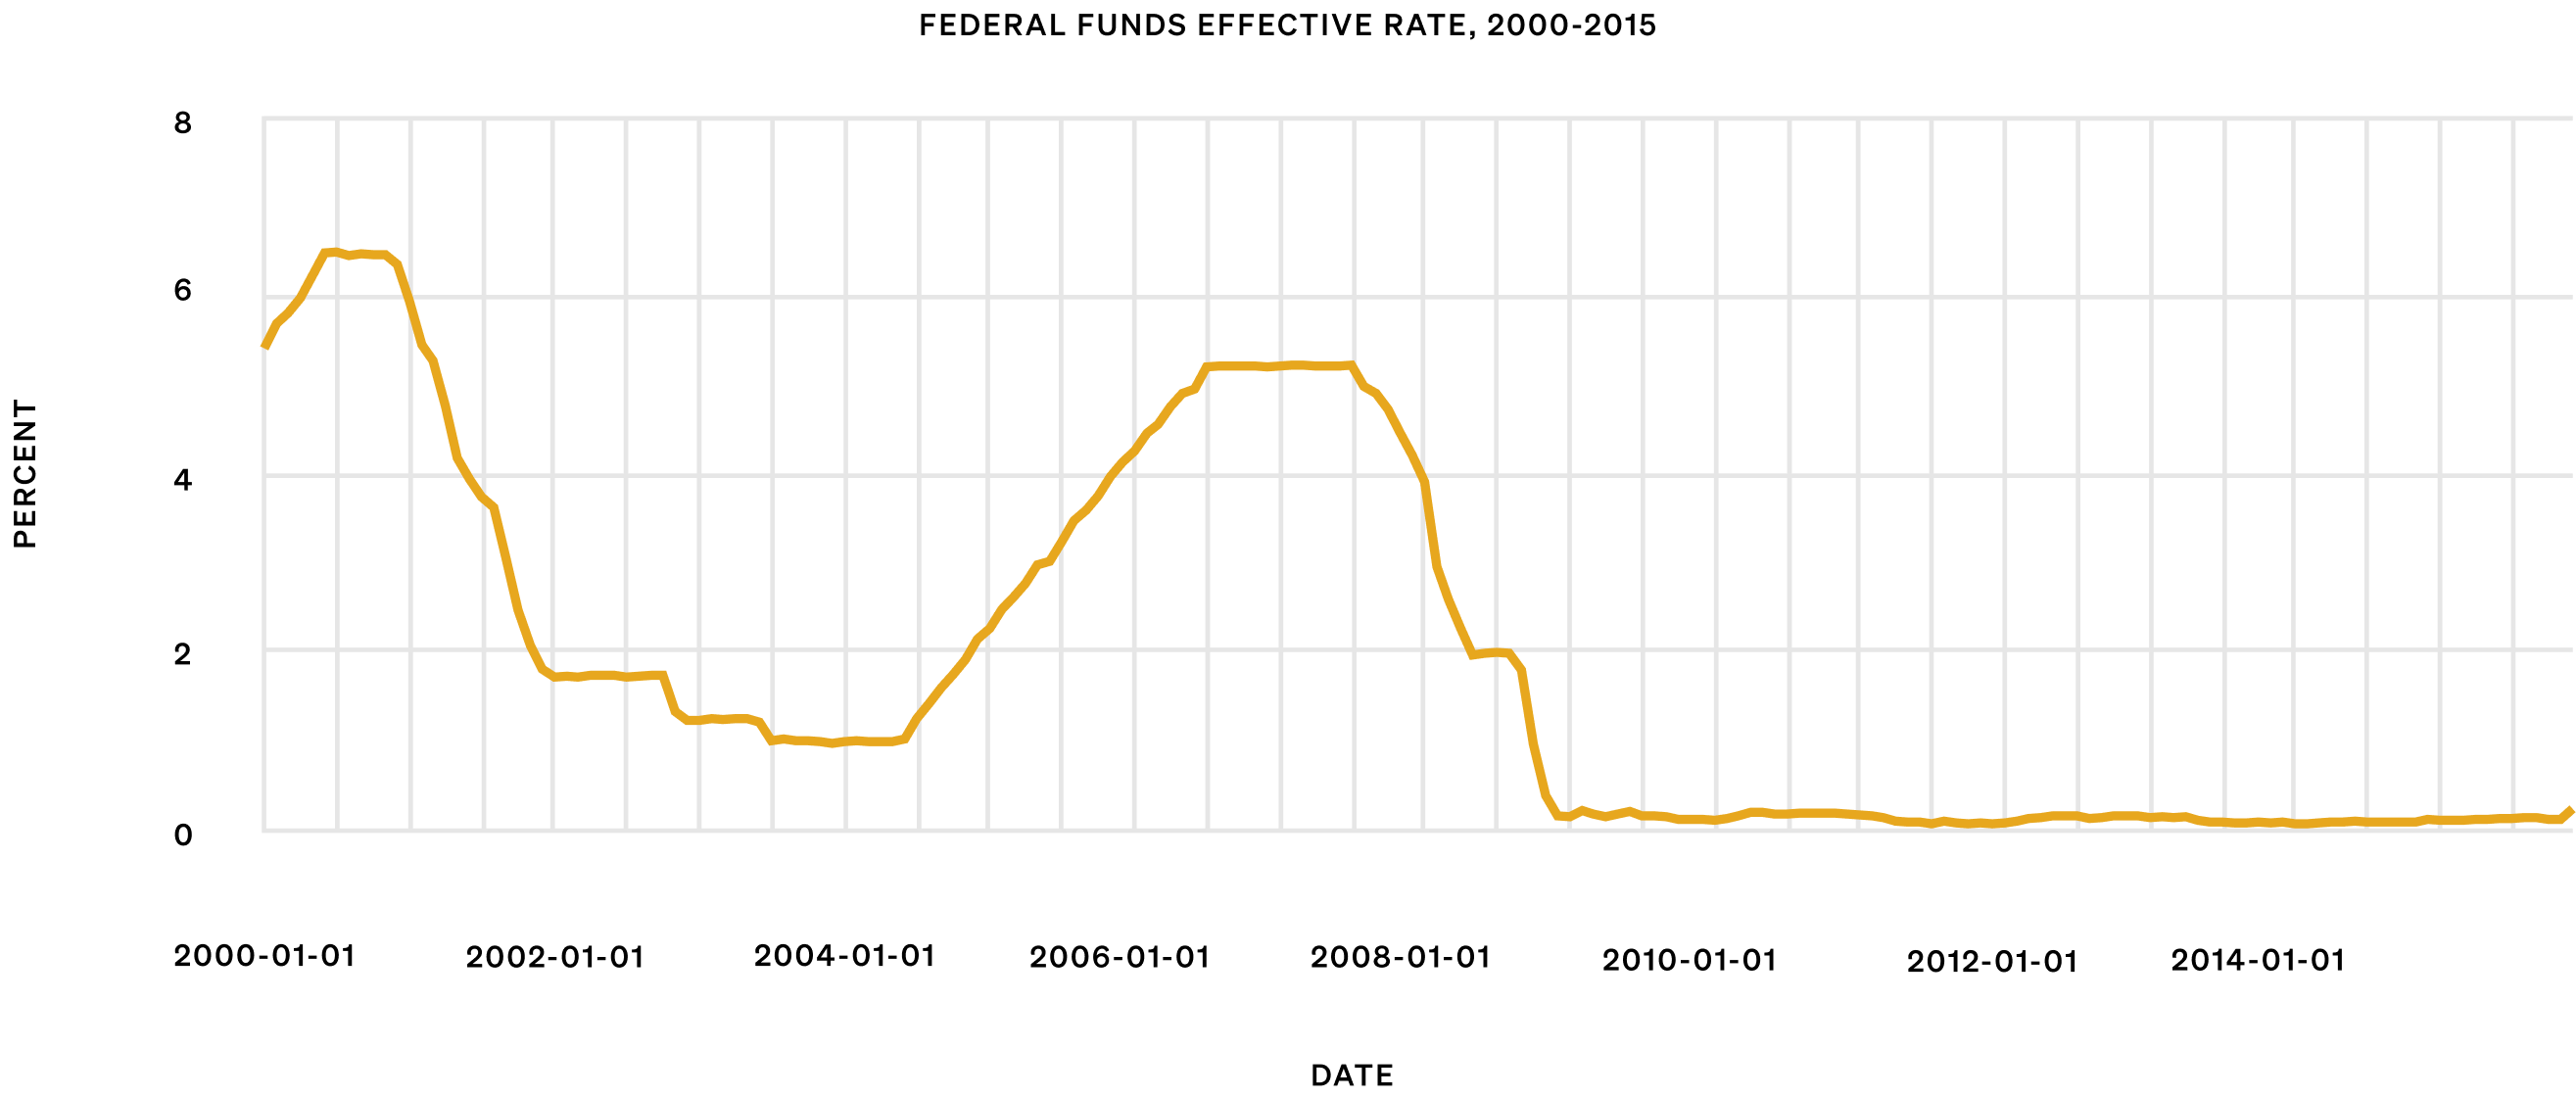
This made gold even more appealing. It doesn’t pay interest, but now neither did anything else — and gold wasn’t being printed. As a result, more investors jumped to buy gold, pushing prices even higher. The Federal Reserve aggressively cut the Federal Funds Rate from 4.75% in September 2007 to a target range of 0-0.25% by December 2008, where it remained for years.
To save the system, the U.S. Federal Reserve (and other central banks) slashed interest rates to 0% and began quantitative easing (QE) — printing trillions of dollars to buy bonds and inject liquidity. With interest rates at zero and inflation expectations starting to rise, real interest rates turned negative, making cash and bonds unattractive.
This made gold even more appealing. It doesn’t pay interest, but now neither did anything else — and gold wasn’t being printed. The result: more investors piled into gold, pushing prices even higher.
Quantifying Monetary Easing:
To prevent a total collapse of the financial system, the U.S. Federal Reserve and other central banks cut interest rates to 0% and launched quantitative easing (QE) — creating trillions of dollars to buy bonds and stabilize markets.
The Federal Funds Rate fell from 4.75% in September 2007 to a target range of 0–0.25% by December 2008, where it stayed for years.
It was historic. The Federal Reserve’s balance sheet, which had been under $1 trillion for decades, expanded to more than $2.8 trillion by late 2011. This massive injection of liquidity pushed interest rates lower across the economy and made borrowing cheaper.
But it also had a side effect. With interest rates at zero and inflation expectations starting to rise, real interest rates turned negative. This meant holding cash or bonds resulted in a loss of purchasing power over time.
Gold suddenly became far more attractive. It does not pay interest, but in an environment where cash and bonds also paid almost nothing, gold offered protection against currency debasement. Investors around the world responded by pouring money into gold, driving prices higher.
Inflation fears + De-dollarization trend
Even though inflation in developed countries stayed around 2–3%, people feared it would rise because of all the money printing during the 2008 crisis. In emerging markets like India, China, and Brazil, rising commodity prices added to these fears.
At the same time, trust in the U.S. financial system weakened. Countries like China, Russia, and India started buying gold and cutting their dependence on the dollar.
Central banks, which had been selling gold for decades, became net buyers in 2010 — purchasing over 70 tonnes that year and more than 450 tonnes by 2011.
Investors also rushed to gold ETFs like SPDR Gold Shares (GLD), whose holdings nearly doubled from 700 tonnes in 2008 to over 1,300 tonnes in 2009 and peaked above 1,600 tonnes by 2011.
The U.S. Dollar Index fell from 88 in 2009 to below 73 in 2011, making gold cheaper globally and further boosting demand. Just like in the 1930s and the 1970s, the core driver of 2008 gold rally was the same. The root cause remained a loss of faith in the system and a search for safety. Gold once again became the preferred asset when trust in paper money was under question.