Stagnation
Markets That Moved, But Went Nowhere
Let’s take a moment and shift our focus.
So far, we’ve seen how small and mid-cap segments take the lead during strong rallies. We’ve seen how large-caps quietly move forward even when the rest of the market feels stuck. But what happens when nothing really moves at all?
Which part of the market has gone through the longest stretch of time without giving investors any meaningful return?
To understand this, we studied the longest stagnation periods across different segments — small-caps, mid-caps, and large-caps. These are the stretches where the index gave almost no returns.
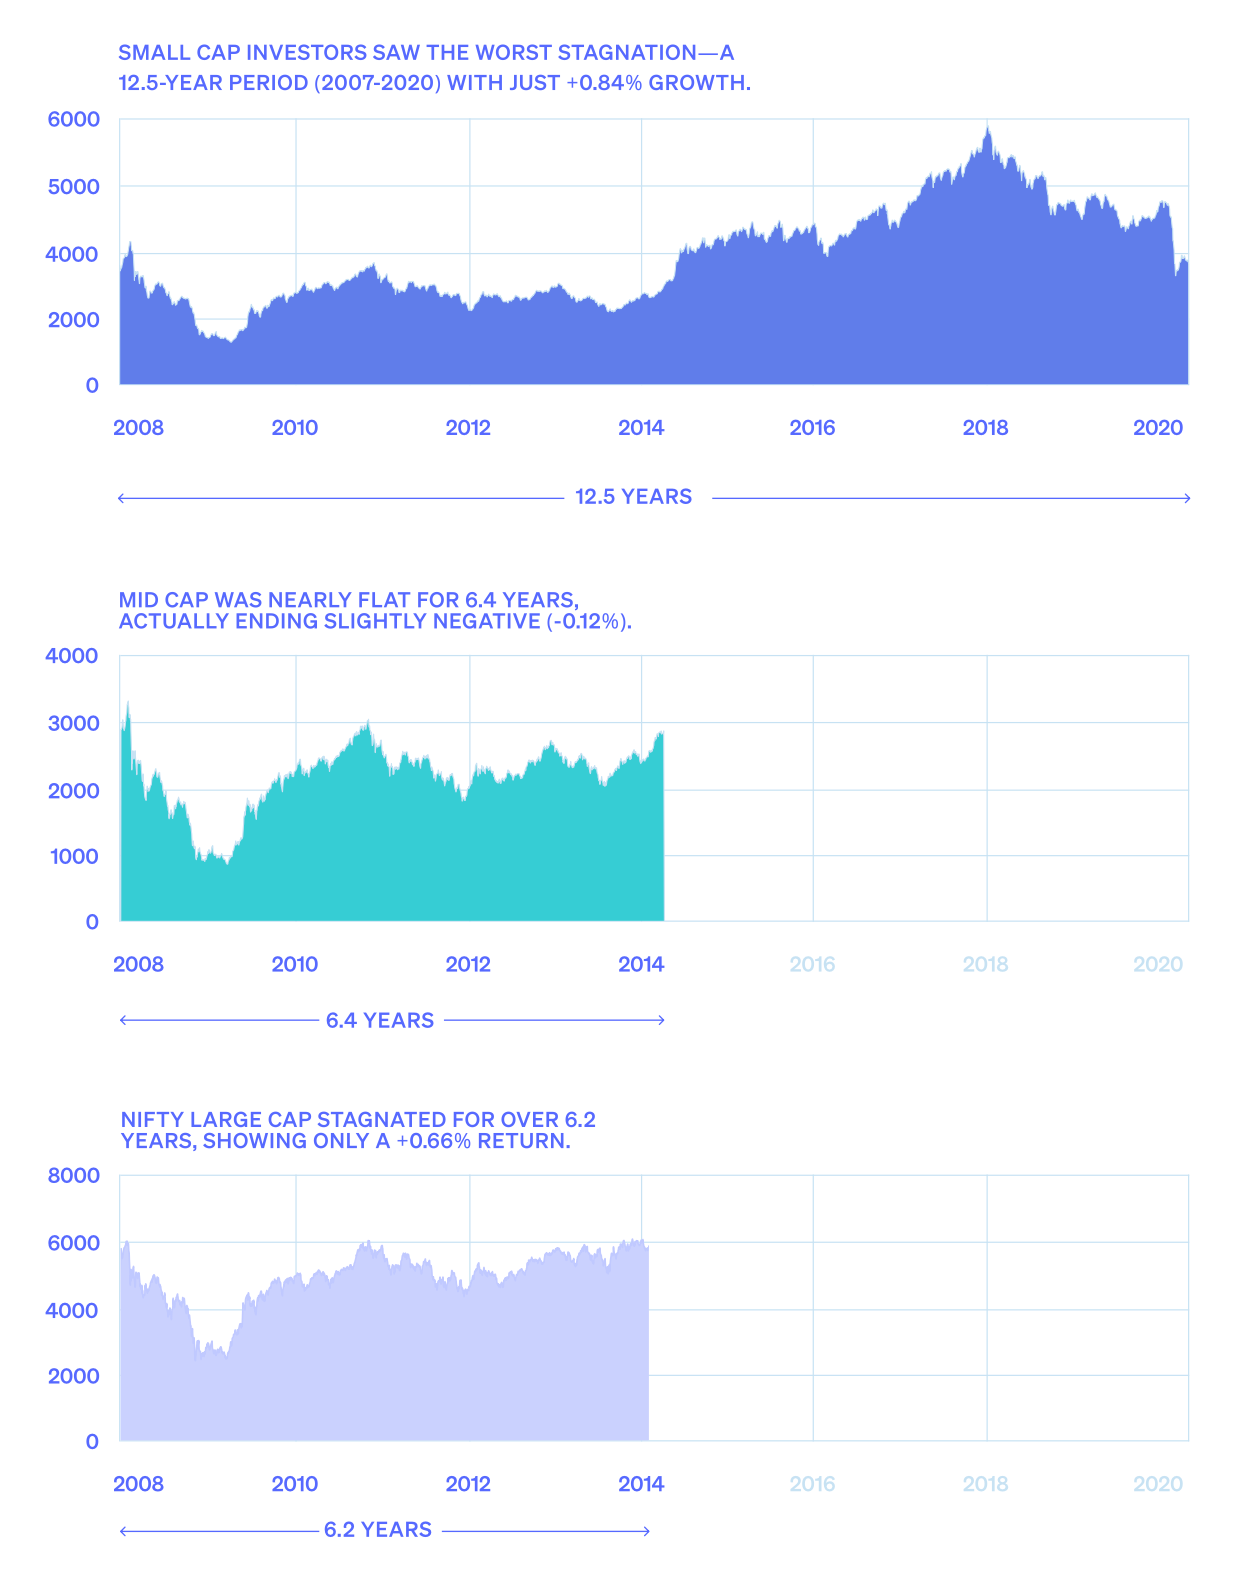
The first chart at the top shows the performance of the Smallcap 250 index from 2007 to 2020 — a 12.5-year period.
While the line goes up and down many times, it ends at almost the same level it started at.
So, even after more than a decade, the total return was just +0.84%.
The second chart in the middle shows the largest stagnation period of Midcap 150 index — 2008 to 2014 — a period of 6.4 years. Here too, the end result is –0.12%.
The third chart at the bottom shows the Nifty 50 index’s longest stagnation period which was around 6.2 years with a return of +0.66%.
One segment stood out very clearly in this— small-caps and the 12.5 year period.
From the peak of 2007 — just before the global financial crisis, till the COVID crash in 2020, the small-cap index basically went nowhere. That’s a stretch of 12.5 years. And over that entire period, the total return was just +0.84%.
Imagine investing Rs 1 lakh at the start of that phase and just sitting on it for over 12 years. It would have grown to just Rs 1,00,840 That’s it. Practically no wealth creation.
And this is before accounting for inflation. Because once you do, it’s worse. That Rs 1,00,840 after 12.5 years In real terms would have lost value.
In this case, COVID was enough to wipe out whatever tiny gains had been built over the years before it.
Is this cherry picking data?
Yes. If you had just invested one year before that point in time or after, you would have much better returns.
Similarly, if you had withdrawn money a year before 2020 or a year after, you would still be making higher returns.
But still, the point remains — there was this 12.5 year period where the returns were nearly 0%.
When you compare all three indices , the difference becomes obvious.
During the same 12.5 year period in which small cap gave no returns:
Large-caps rose 50.3%.
Mid-caps rose +69.99% — despite going through their own stagnation phases.
This tells us that not all market phases are the same. And not all segments perform the same way during those phases.
“The key is to consider both the earnings growth you expect and the valuation you’re paying for a business. For example, in 2024, many small-cap, mid-cap, and even some large-cap companies were trading at 100 times P/E for two or three years forward. Even today, a P/E of 70 to 80 has become the norm. For these businesses with such high valuations, I would predict that their returns over the next five years could be flat or even negative, despite the companies doing well”
- Chandraprakash Padiyar (Tata AMC, Fund Manager)
Active vs Passive
Which Approach Works Better for Small & Mid-Caps?
With ETFs, index funds, and low-cost investing becoming more accessible than ever, a common question has started to come up more often.
Why should anyone pay higher fees for actively managed mutual funds when index funds are cheaper?
To answer this, we first need to understand how passive investing actually works.
A passive fund simply mirrors a market index.
For example, a Nifty 50 index fund buys the same 50 companies that make up the index, in the exact same proportions.
There’s no human judgment involved. No one is picking which stock to buy or avoid.
It’s a rule-based system — designed to track, not outperform. And because there’s minimal decision-making, the fees are also lower.
In large-cap markets, where businesses are already well-researched and widely followed, passive funds tend
to do fine.
In fact, they often match — or even beat — a lot of actively managed large-cap funds. But when you shift the focus to small and mid-cap stocks, the picture starts to change.
Small and mid-cap companies have less coverage, fewer analysts, scattered public info, and varied corporate governance compared to large-caps.
This is where a fund manager’s expertise can prove very useful — they can invest in good companies and avoid the bad ones.
Competent active managers deeply understand companies— meeting management, reading balance sheets, assessing promoter intent, and spotting early winners.
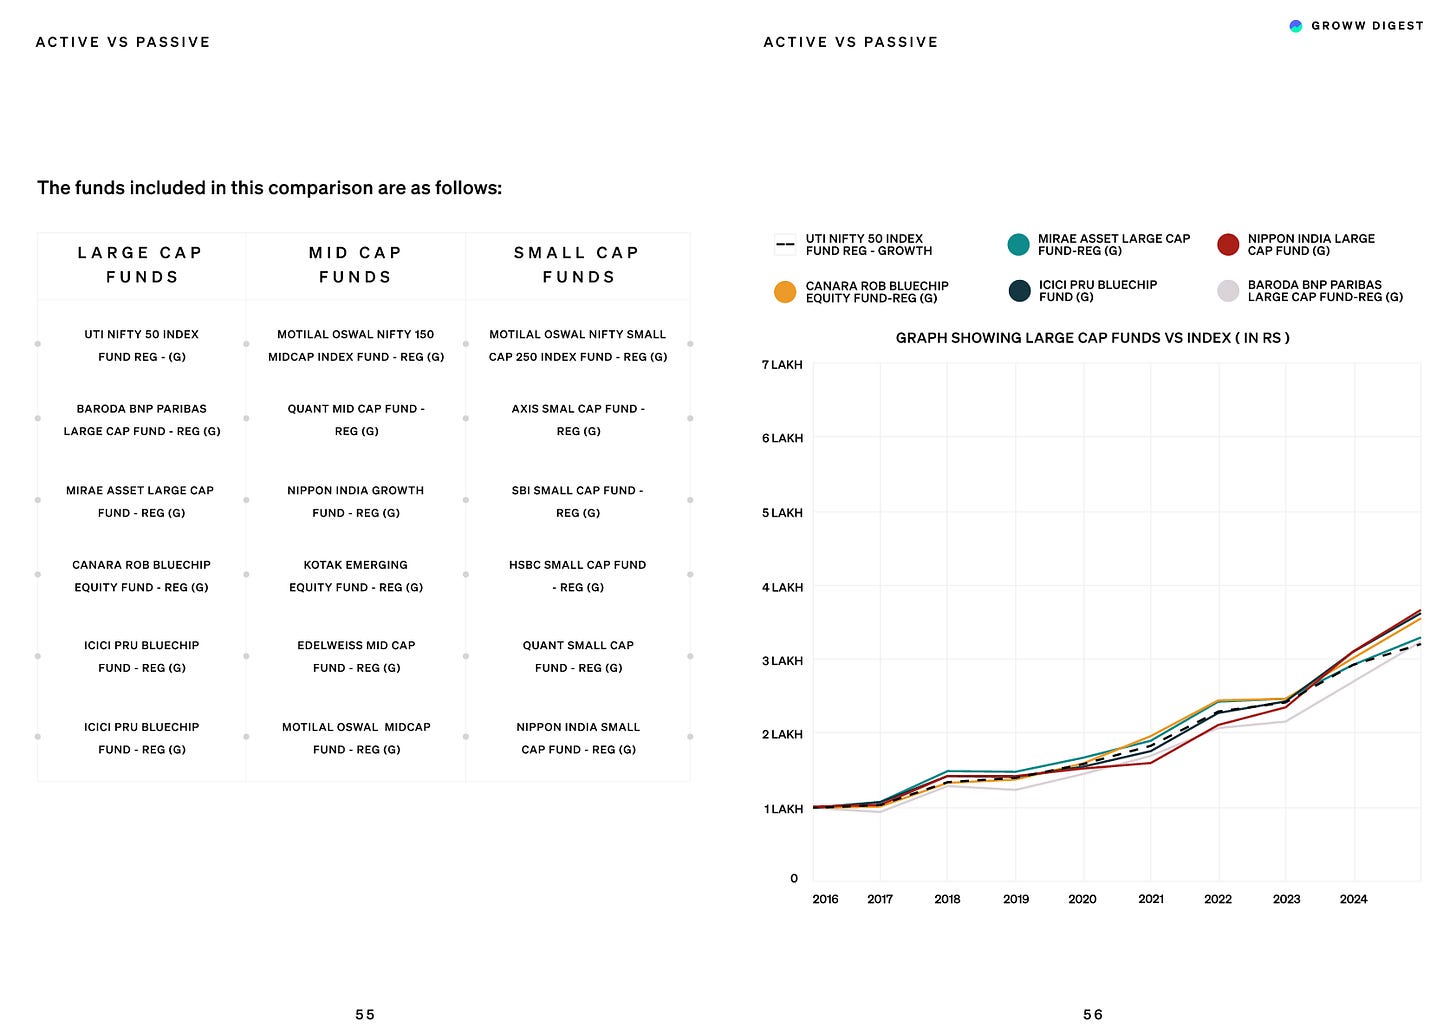
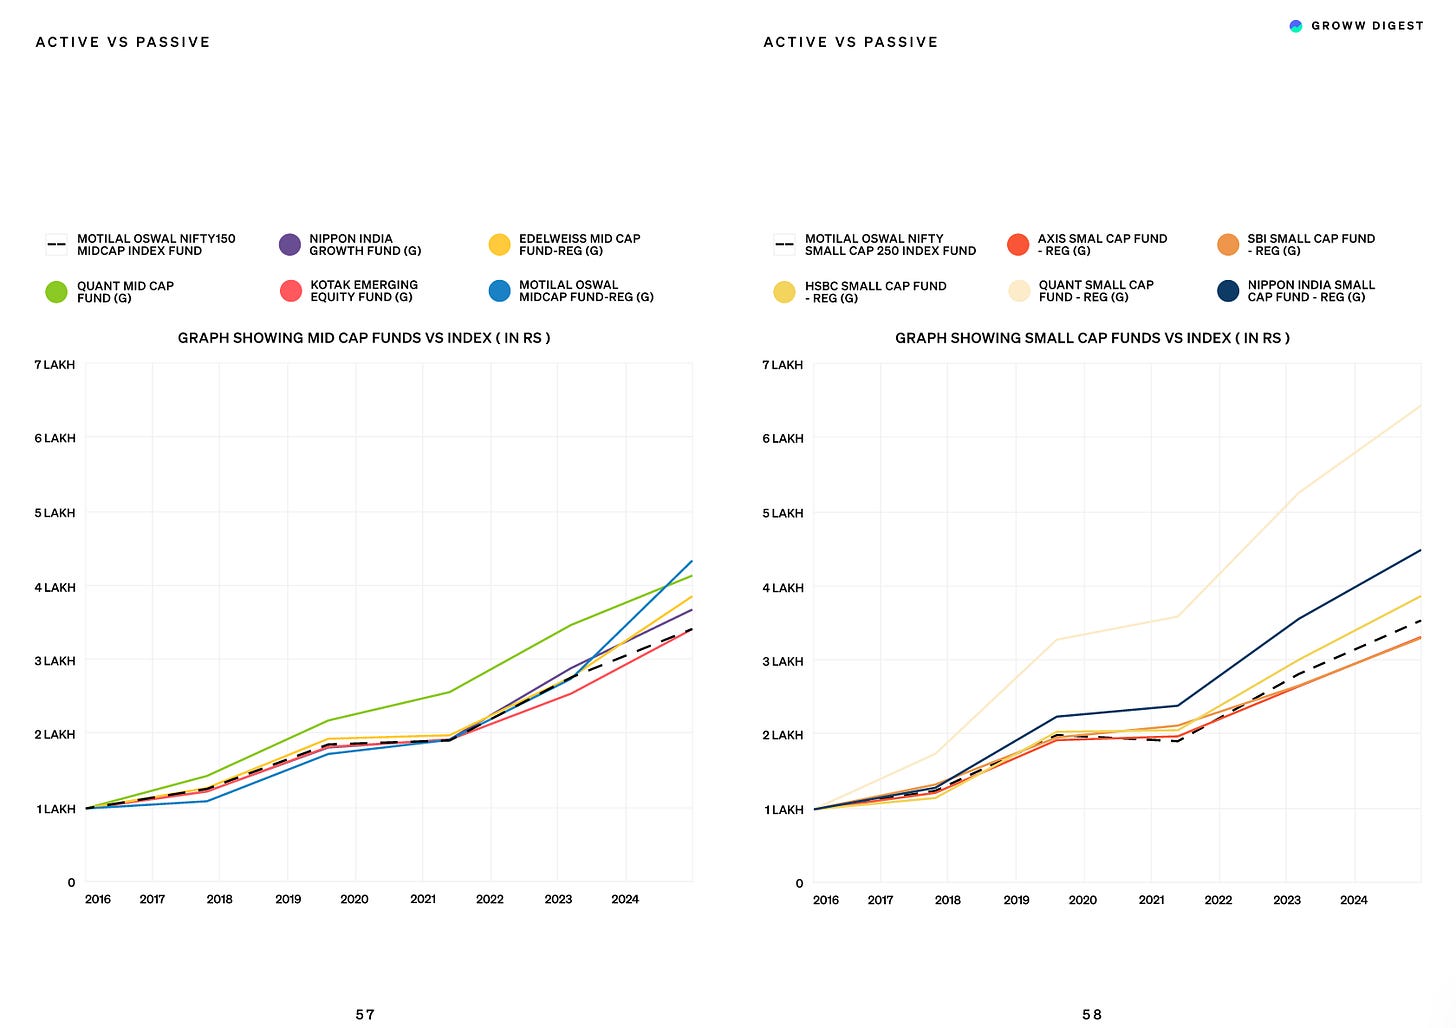
To test this idea, we looked at performance — comparing 5 of India’s oldest active mutual funds in each segment with their respective benchmark - indices.
What the data showed was clear.
In the large-cap space, passive funds performed very competitively. Most active funds struggled to consistently beat the benchmark indices.
But in mid-caps, the edge started to appear. Active funds showed better outperformance.
And in small-caps, the contrast was even stronger. Active funds offered the highest potential for outperformance — mostly because the space rewards good stock selection.
“I don't believe that simply investing in a small-cap index will yield better results for investors over the next few years. In fact, given current market conditions, one needs to be highly selective when choosing small-cap stocks. However, from a broader market perspective, the risk-reward profile currently appears more favorable in large caps compared to mid- and small-cap indices. That said, thoughtful stock selection will always have the potential to outperform.”
-Chandraprakash Padiyar (Tata AMC, Fund Manager)


