

On 14 November 2019.
Airtel announced its September quarter results. It reported a loss of Rs 23,045 crore.
Turns out, most of this loss came from one-time items. The company reported this separately as exceptional items. Without these items, the loss was Rs 1,123 crore.
But here’s what happened next.
Over the following 20 trading days, starting from the first full trading day after the results, Airtel’s stock rose 8.8%, compared with the Nifty 50’s 1.6%.
Now, let’s look at IndiGo.
On 4 February 2022, the airline reported a profit of Rs 129.79 crore for the December quarter. This was its first quarterly profit after seven consecutive quarters of losses.
But over the next 20 trading days, IndiGo’s stock fell 26.3%, while the Nifty 50 fell 7.0%. Russia’s invasion of Ukraine on 24 February 2022 also happened during this period.
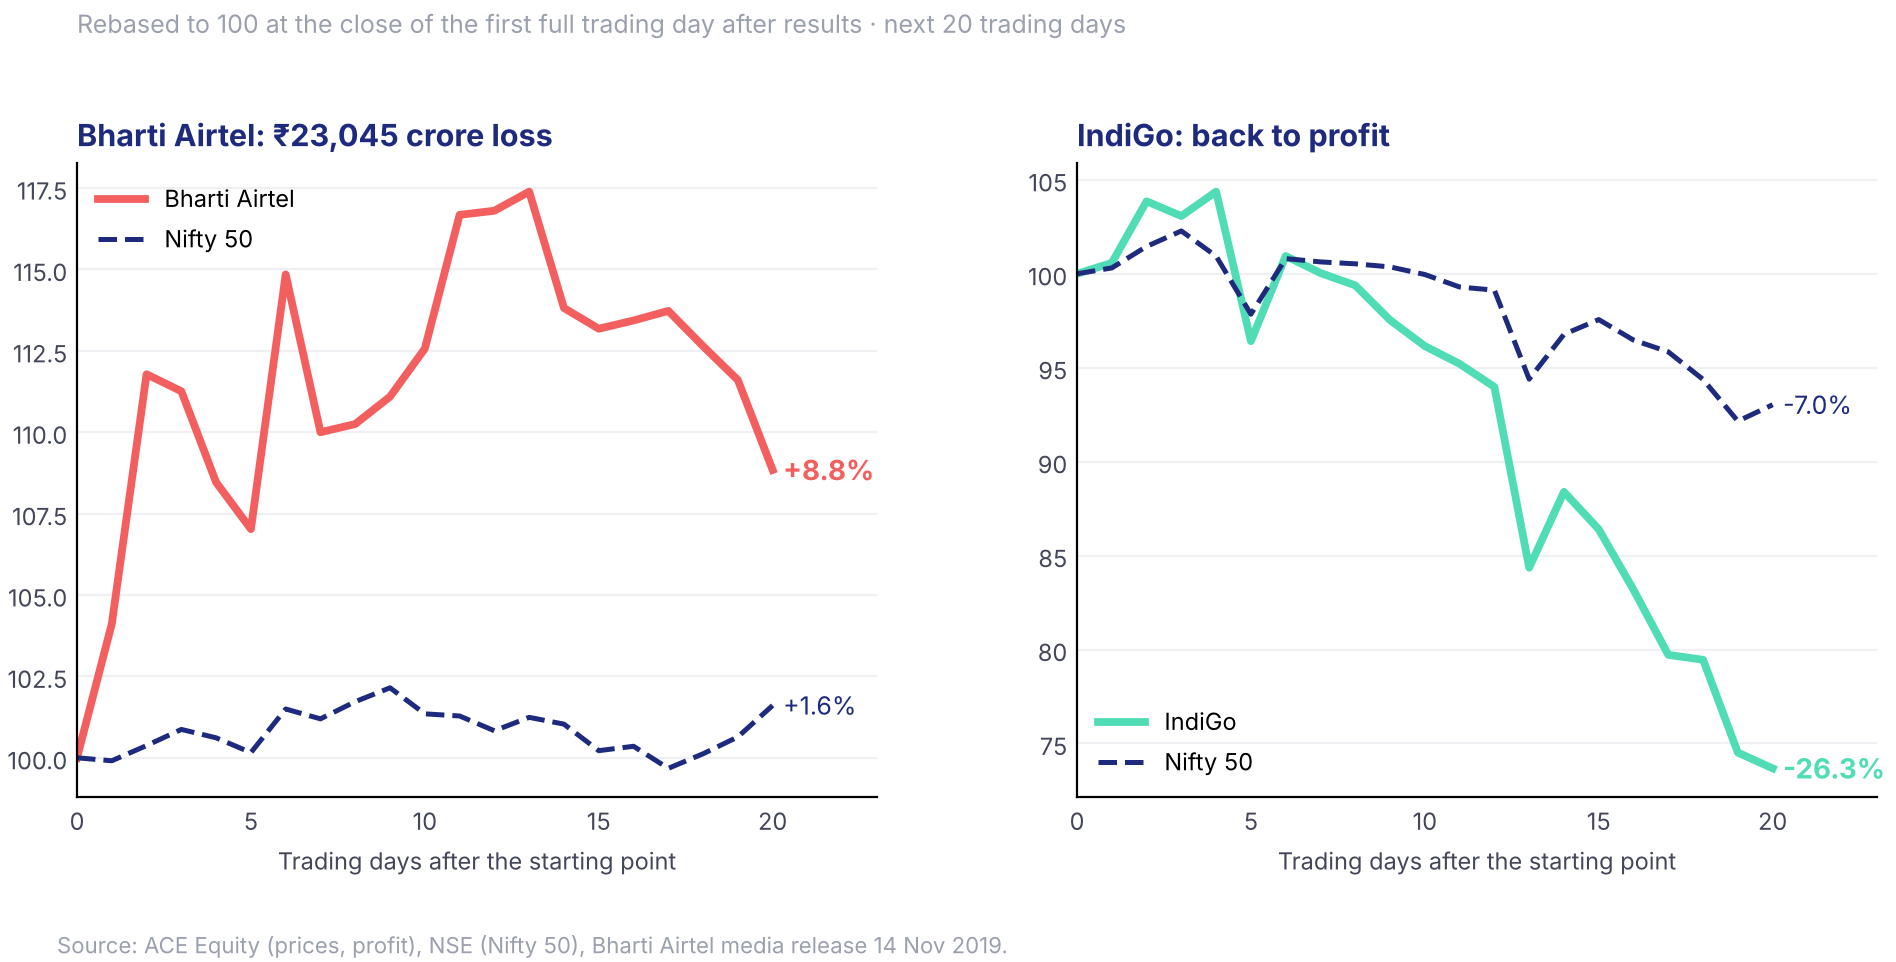
These are two very different examples of how the relation between the stock price and the results can be.
One company reported a loss, but its stock rose. Another returned to profit, but its stock fell.
Of course, these examples don’t tell us why the stocks moved the way they did. But they do raise an interesting question, something related to last week’s What If report.
Last week, we looked at whether companies with faster profit growth also saw their stock prices perform better. We found that the connection between quarterly profit growth and stock returns wasn’t very reliable, especially over shorter periods.
But there was something we hadn’t looked at. And that were companies that had reported losses.
So this week, we thought, why not look at losses?
If a company reports a loss, does its stock usually perform badly?
The study
Like last week, we picked the companies in today’s Nifty 50 and studied their quarterly results from June 2016 to March 2026.
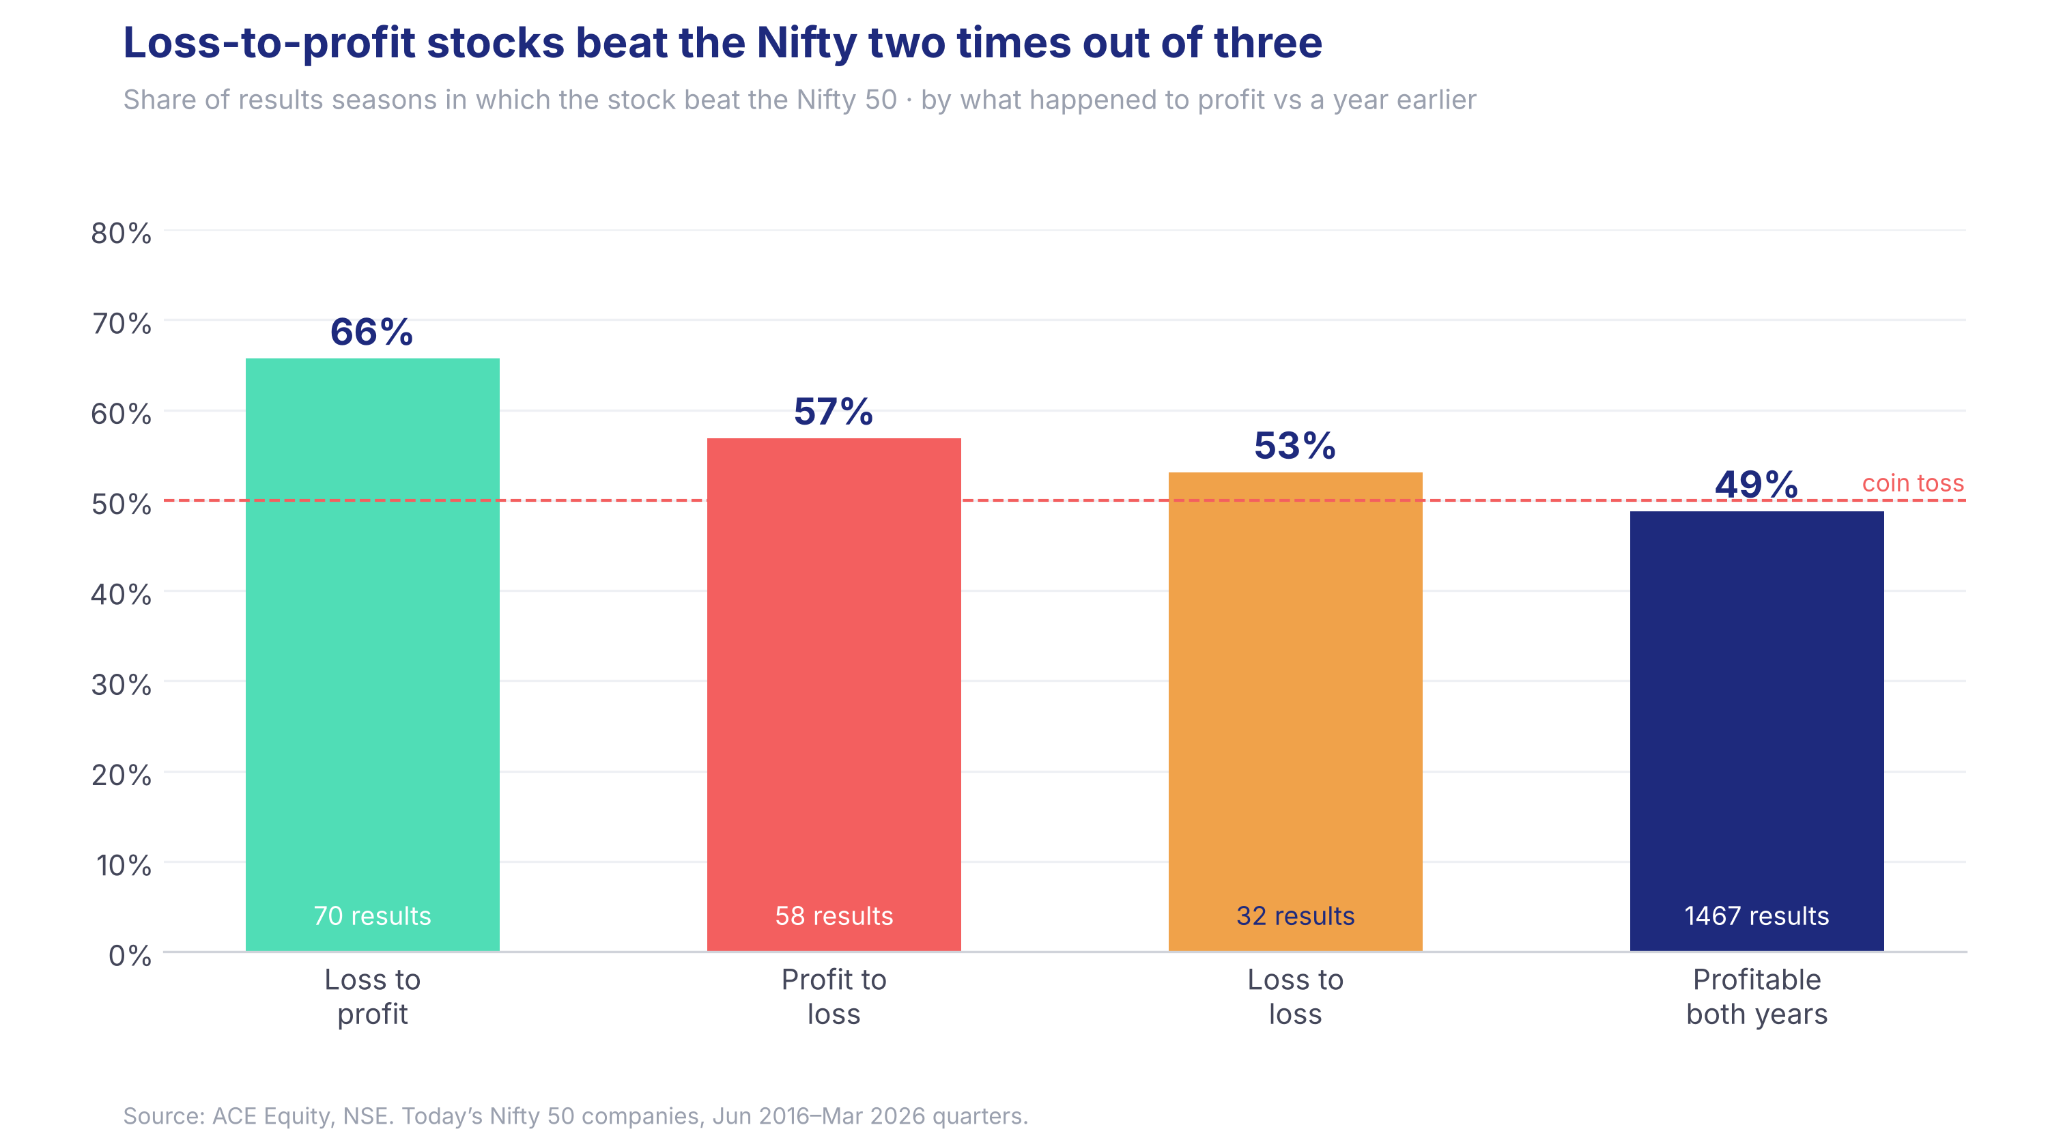
We found 160 cases across 25 companies where a company had reported a loss either in the quarter we were studying or in the same quarter a year earlier. We divided them into three groups.
Loss to profit (70 cases): A loss last year, a profit this year.
Profit to loss (58 cases): A profit last year, a loss this year.
Loss to loss (32 cases): Losses in both years.
One thing to remember: we’re comparing results with the same quarter a year earlier, not the previous quarter.
In fact, in 57 of the 70 loss-to-profit cases, the company was already profitable in the previous quarter.
We also included 1,467 cases where companies were profitable in both years. This gave us something to compare the loss-related cases with.
To understand why we have so many cases, here’s the math:
We studied 50 companies over 40 quarters (10 years).
That’s 50 × 40 = 2,000 possible quarterly observations.
For each quarter, we compared the company’s profit with the same quarter a year earlier.
After excluding quarters with missing data, or where a merger or demerger broke the comparison, we had 1,627 usable cases.
Of these, 160 involved losses, while 1,467 involved profits in both years.
So, one company could appear multiple times in the study, depending on its quarterly results.
Next, we checked how these stocks performed during the results season, around the announcement, and over the following week, month, three months and year.
For the announcement period, we compared closing prices from the trading day before the results date to the next trading day after it. This accounts for after-market announcements but could also capture earlier price movements or other news.
We compared every stock’s return with the Nifty over the same period.
For example, if a stock rose 5% while the Nifty rose 8%, it still performed worse than the Nifty by 3 percentage points.
With that, let’s look at what we found.
What happened when a loss turned into a profit?
Let’s start with companies that had reported a loss in the same quarter last year but made a profit this year.
We found 70 such cases. Of these, 46 (66%) beat the Nifty 50 during the results season (that’s about two out of three).
In comparison, companies that were profitable in both years beat the Nifty in only 716 of 1,467 cases (49%).
We also checked whether this difference was simply because we were looking at different companies. So we looked at ordinary profitable quarters from the same 25 companies. The result was similar, with only 336 of 683 cases (49%) beating the Nifty.
So, in our study, companies moving from a loss to a profit beat the Nifty more often than those that remained profitable.
But the catch here is that the results season starts before companies announce their numbers. So investors wouldn’t have known which companies would move from a loss to a profit when the season began.
And even among the loss-to-profit cases, about one in three failed to beat the Nifty. So while there was a pattern, it wasn’t reliable enough to predict stock returns.
We looked at the other side too, where companies moved from making a profit to reporting a loss.
What happened when a profit turned into a loss?
We found 58 cases where a company had made a profit in the same quarter last year but reported a loss this year.
You might expect these stocks to perform badly. But 33 of these 58 cases (57%) beat the Nifty during the results season.
One possible explanation is what happened in 2020, when Covid caused a sharp market fall followed by a recovery. The Nifty fell 38% from its January 2020 high to its low on 23 March before recovering 46% by the end of July.
Of our 58 profit-to-loss cases, 24 came from the quarters ending March, June and September 2020. During these three quarters, 17 of 24 cases beat the Nifty.
But outside these quarters, only 16 of 34 cases beat the Nifty. And when we looked specifically at what happened around the results announcements, the difference was even clearer.
Outside those three 2020 quarters, only 10 of 34 profit-to-loss cases beat the Nifty around their results dates. The remaining 24 performed worse.
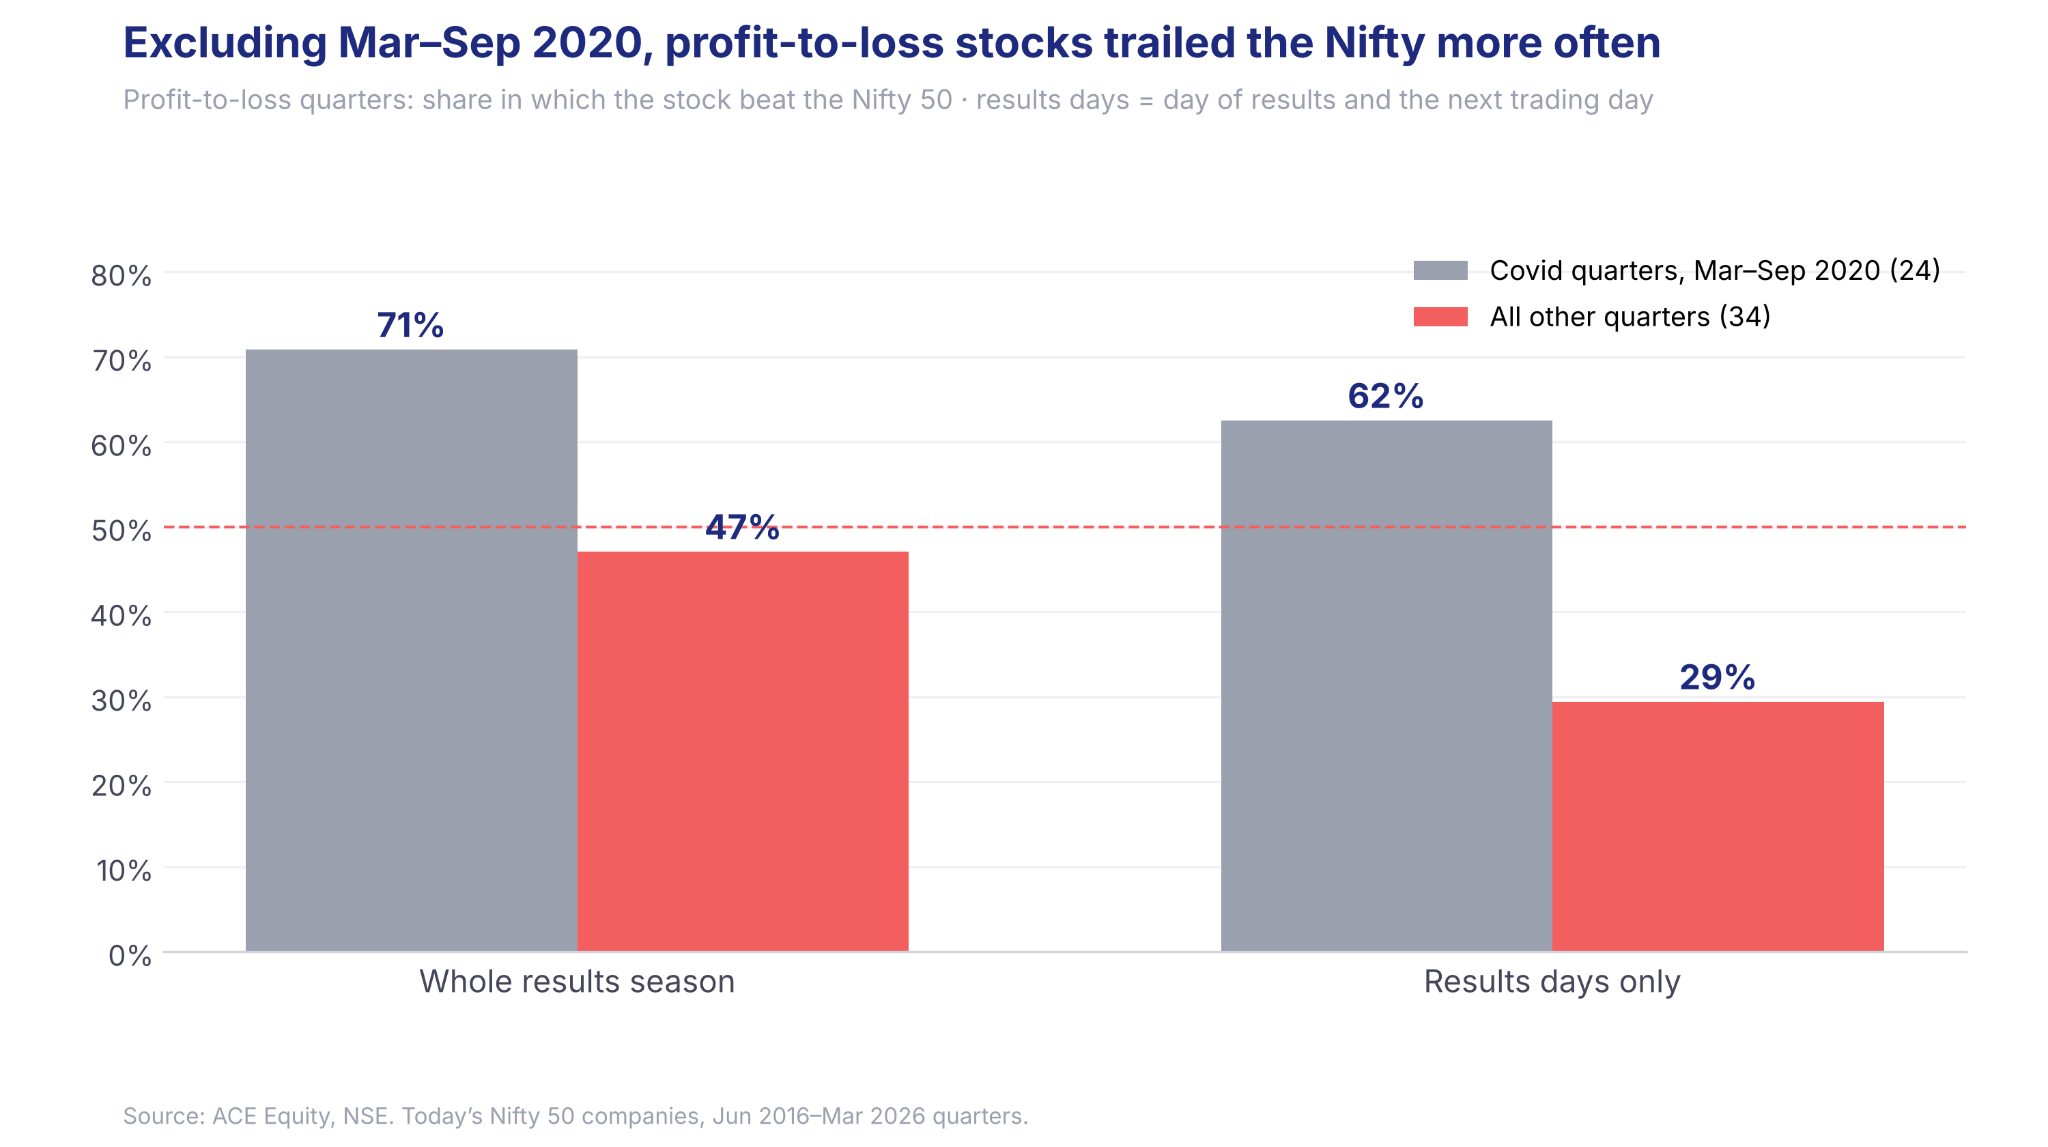
So, even when a company moved from a profit to a loss, its stock didn’t always perform worse than the Nifty.
But 2020 made a big difference to the findings. Outside those three quarters, companies reporting a loss after a profit were more likely to underperform around their announcements.
This tells us how misleading it can be to look at returns over an entire results season. The broader market could be falling or recovering for reasons unrelated to a company’s results.
So, for the rest of the study, we excluded those three unusual quarters to see if there are patterns more clearly.
We didn’t exclude the entire Covid period, so other quarters from 2020 and 2021 are still included.
Had the share price already moved before the results?
We saw that companies moving from a loss to a profit beat the Nifty more often during the results season.
But did their stocks perform better after the results were announced, or had they already been doing well?
To check this, we looked at stock returns before and around the results dates, excluding those three unusual quarters from 2020, that is.
Of the 67 loss-to-profit cases, 43 had already beaten the Nifty between the end of the quarter and the day before the results. Around the results announcement itself, 38 of 67 cases beat the Nifty.
Remember, many of these companies were already profitable in the previous quarter. So the improvement wasn’t necessarily new information.
Now, let’s look at companies that moved from a profit to a loss.
Before the results, 21 of 34 cases had beaten the Nifty. But around the announcement, only 10 of 34 did.
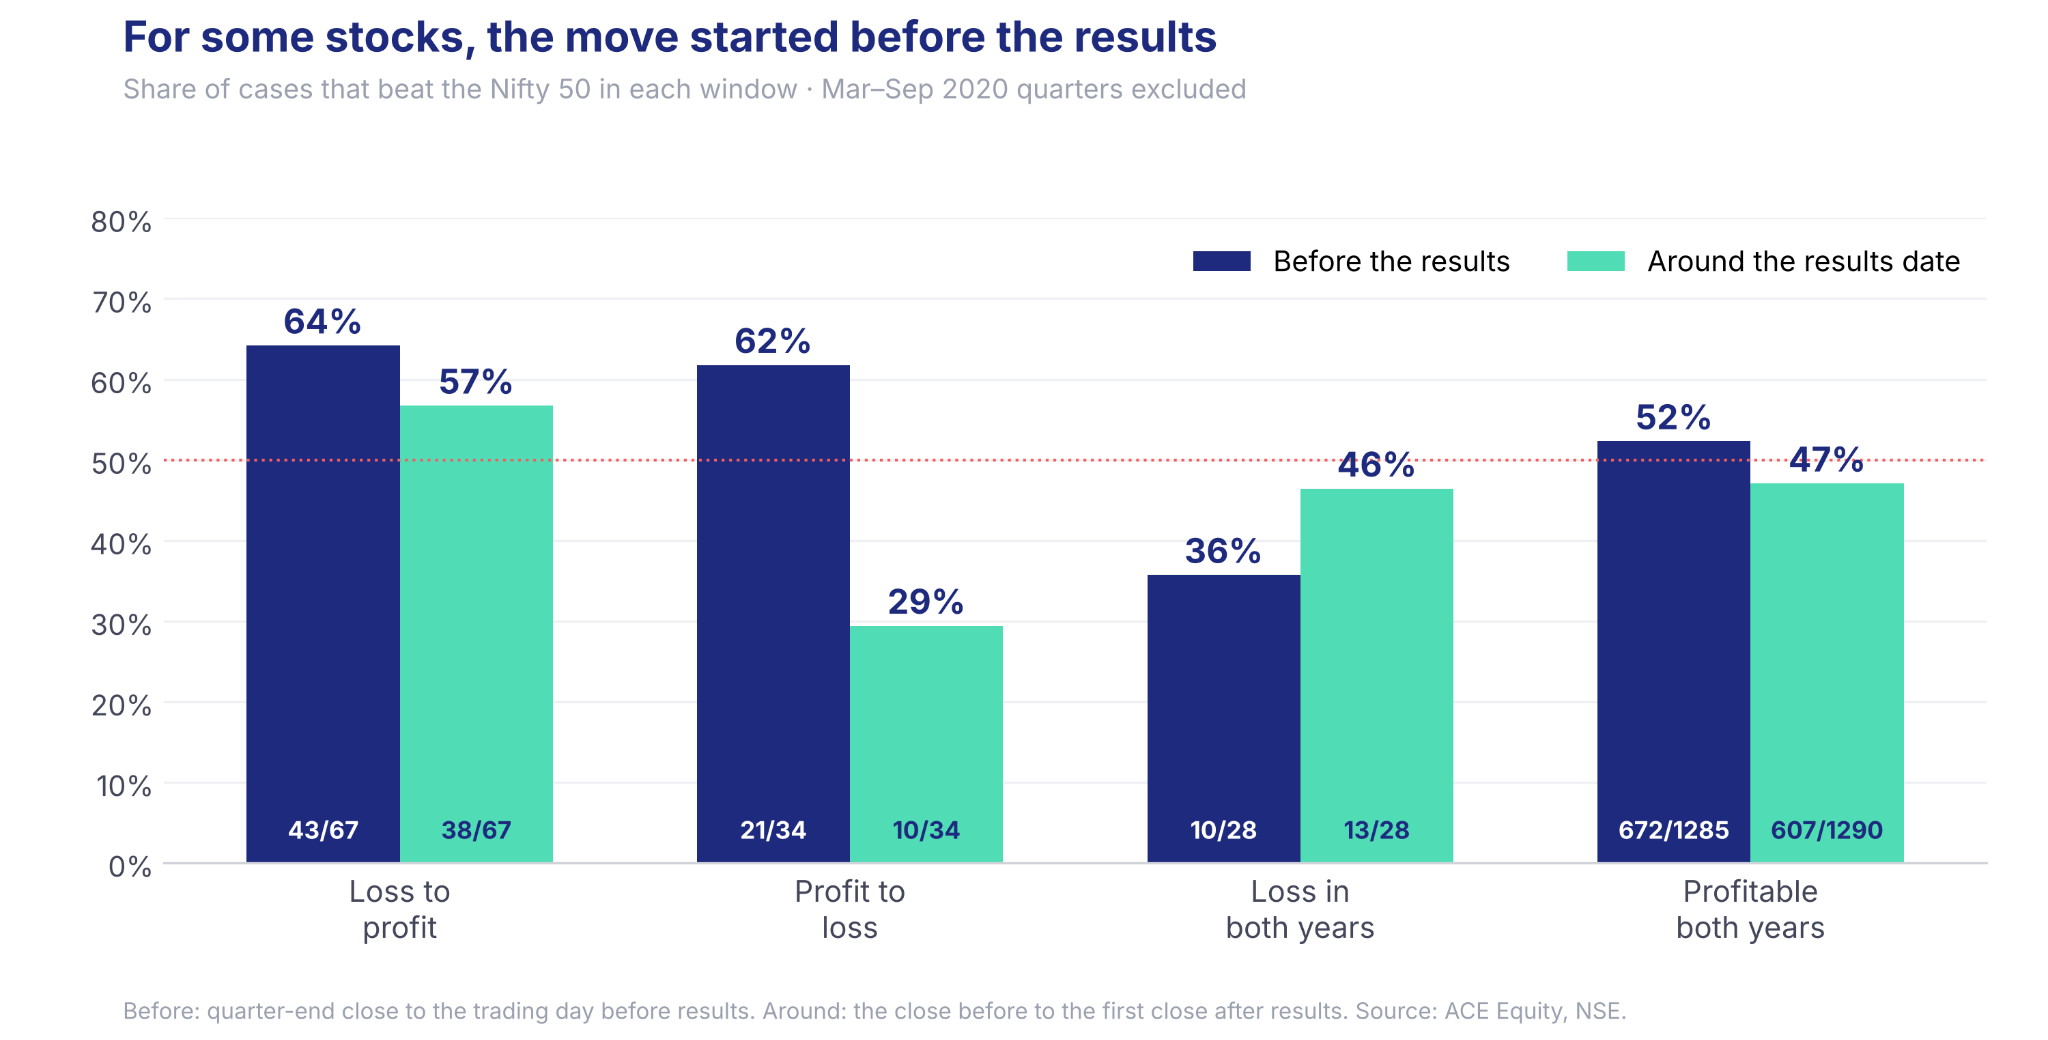
This tells us something interesting. Many companies moving from a loss to a profit had already beaten the Nifty before announcing their results.
Meanwhile, companies moving from a profit to a loss were more likely to underperform around their announcements, even though most had beaten the Nifty before that.
But can we say the results caused these movements?
Not really, because we don’t know exactly when investors learned about the company’s performance or what else influenced the stock price.
So once again, knowing whether a company reported a profit or loss wouldn’t necessarily have helped us predict its stock’s movement.
Here we’ve only looked at what happened before and around the announcements. Now let’s look at the months after the results were made public.
What happened in the months that followed?
So far, we’ve looked at what happened before and around the results announcements. We also wanted to see whether the difference between the groups became clearer in the months that followed.
In the first month after the results, 38 of 67 loss-to-profit cases (57%) beat the Nifty. For profit-to-loss cases, 18 of 34 (53%) did. So there wasn’t much of a difference.
But over the following year, the numbers looked different.
Of the 66 loss-to-profit cases, 45 (68%) beat the Nifty. For profit-to-loss cases, only 14 of 32 (44%) did.
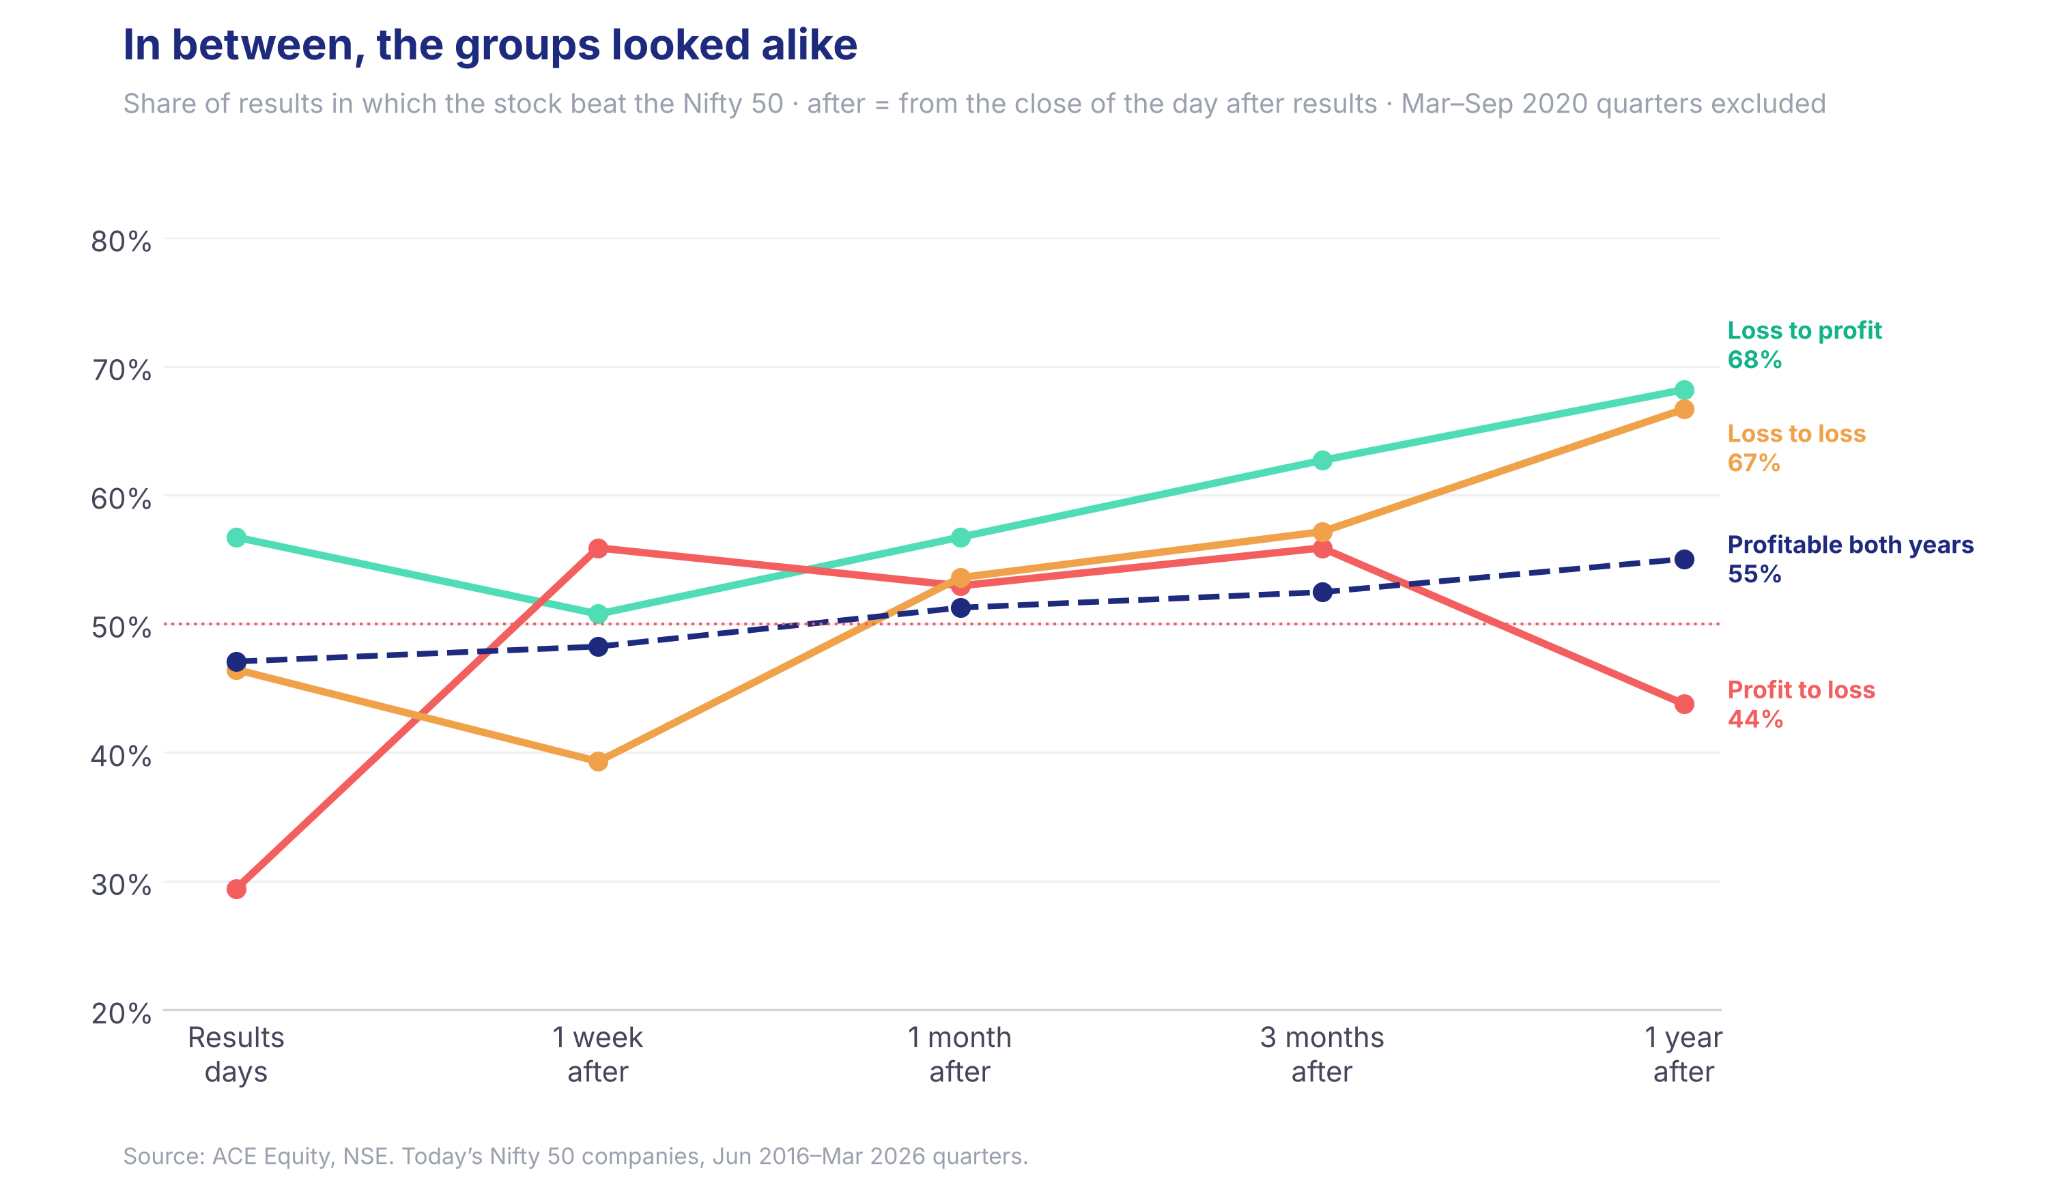
The chart shows how often each group beat the Nifty over different periods after the results.
Notice how the groups were fairly close after one month, but the difference became larger after a year.
However, there’s something interesting here. Even among companies that continued making losses, 18 of 27 cases (67%), from just nine companies, beat the Nifty over the following year, almost the same as the loss-to-profit group.
We also compared the loss-to-profit group with ordinary profitable quarters from the same 25 companies. Here, 320 of 530 cases (60%) beat the Nifty over the following year, compared with 68% for the loss-to-profit group.
So while companies moving from a loss to a profit had a better record, it wasn’t a particularly reliable pattern. Nearly one in three still failed to beat the Nifty, and even companies that continued making losses sometimes performed just as well.
There’s another limitation. A lot can happen in a year, including more quarterly results, company announcements and changes in the broader market. So we can’t say that returning to profit caused the stock to perform better.
And that led us to look at something else: whether companies that returned to profit managed to stay profitable, and whether that made any difference.
What if the improvement didn’t last?
A company might report a profit after a loss, but that doesn’t mean it will continue making profits. So we checked whether the companies in our loss-to-profit group remained profitable for the next two quarters.
Of the 66 cases we could follow, 54 stayed profitable for the next two quarters. Among these, 39 beat the Nifty over the following year.
The remaining 12 slipped back into a loss, and only six of them beat the Nifty. This seems to suggest that continuing to make profits might matter.
But what if a company was still making losses, only those losses were getting smaller?
We found 12 such cases. Of these, 10 beat the Nifty over the following year.
Now compare that with companies that were still profitable, but whose profits had fallen by at least 50%. Only 30 of these 51 cases beat the Nifty.
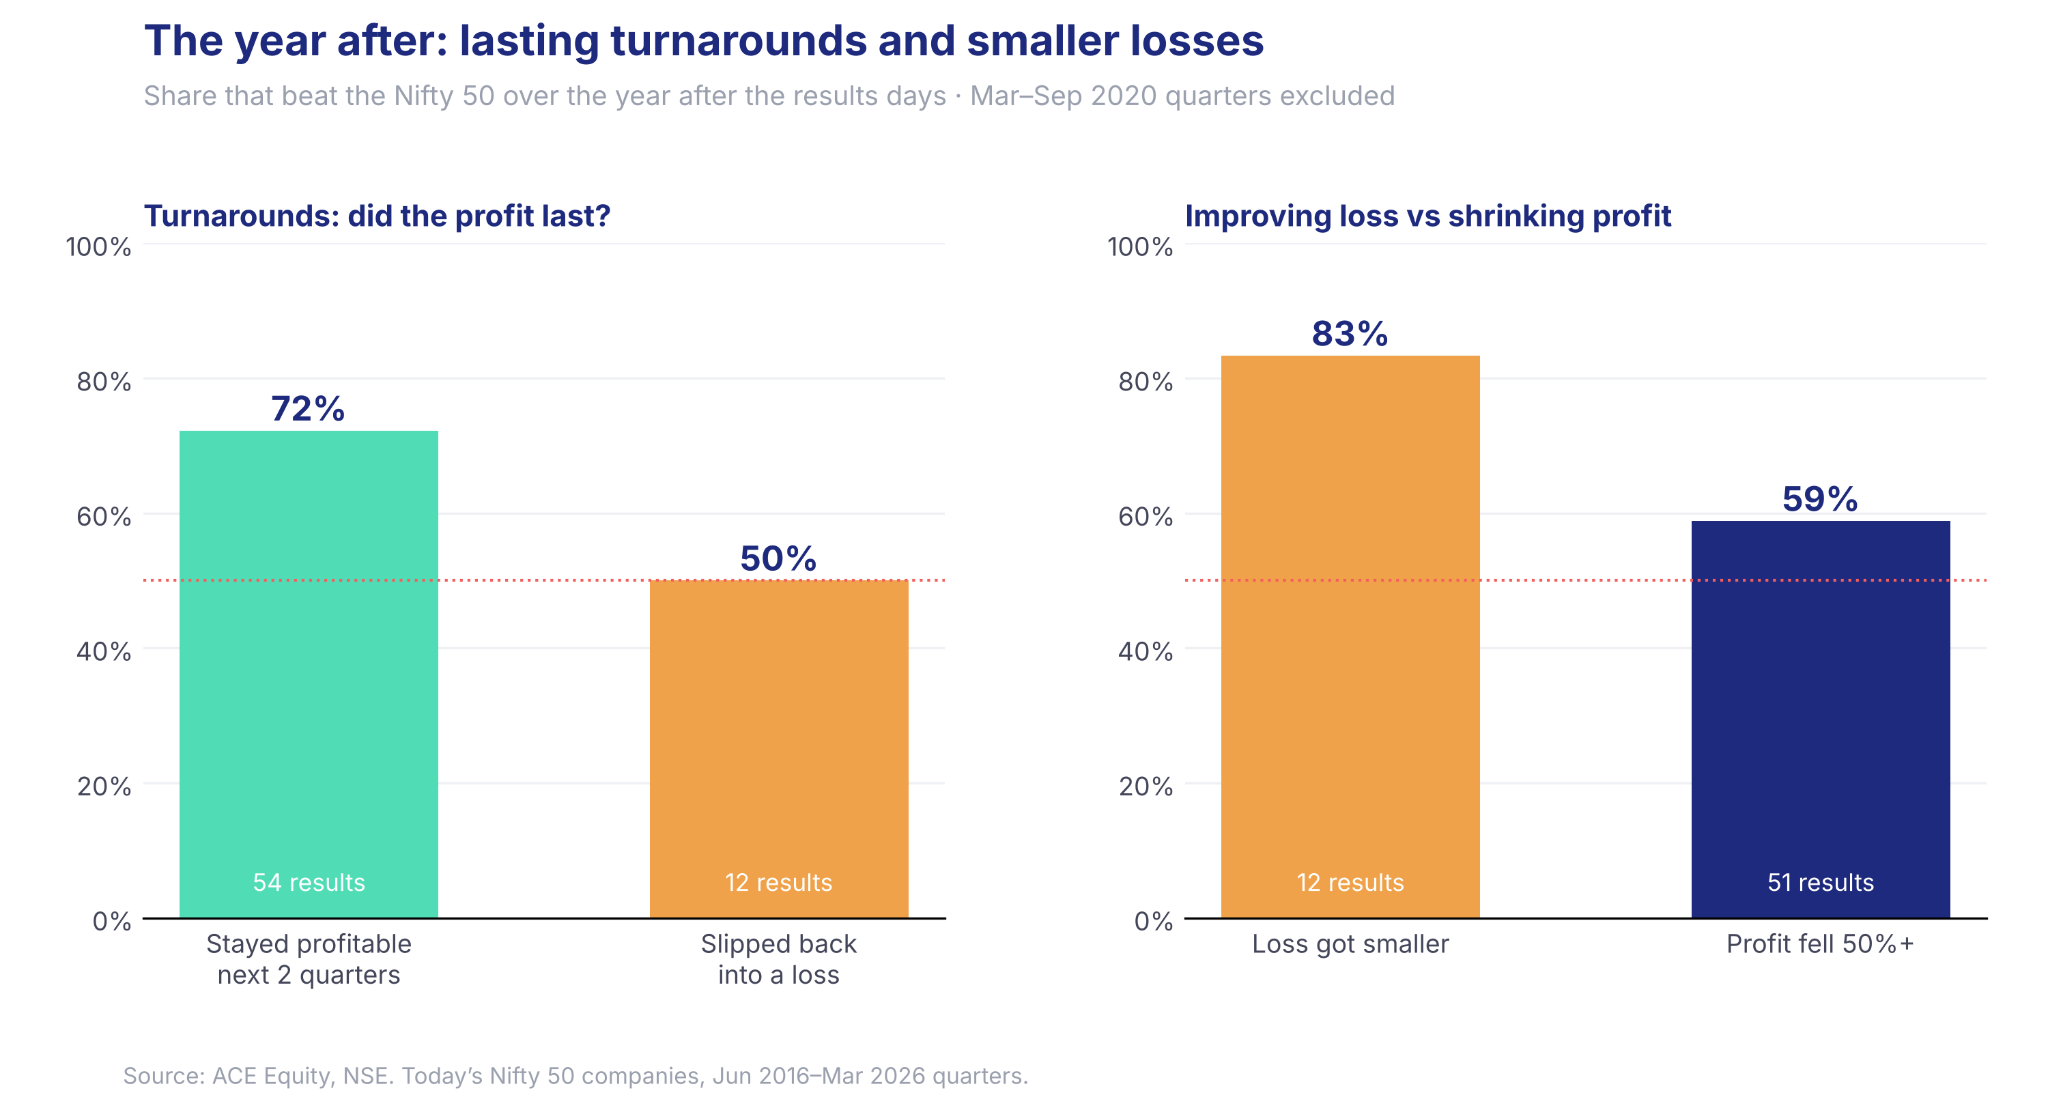
A company could still be making losses, but its stock might perform well. Meanwhile, another company could be profitable but see its stock underperform.
But these were small groups, especially the 12 cases where losses became smaller. That makes it difficult to draw a reliable conclusion.
There’s another limitation here. When a company first reports a profit, we don’t know whether it will remain profitable over the next two quarters. We only find that out later.
So while these numbers show some interesting patterns, they wouldn’t necessarily help someone make an investment decision at the time.
And this brings us to another question. Why can two companies report similar results but see their stock prices move in completely different directions?
Why can the same kind of result lead to different stock returns?
Remember Airtel’s Rs 23,045 crore loss from the beginning of this story? Without exceptional items, that loss was only Rs 1,123 crore.
So the headline loss and the loss before those items told us very different things. And Airtel wasn’t the only example.
In the March 2023 quarter, Axis Bank reported a standalone loss of Rs 5,728 crore. But the bank also reported exceptional items of Rs 12,490 crore related to its acquisition of Citibank’s India consumer business.
Excluding those items, Axis Bank said it would have made a profit of Rs 6,625 crore.
There were other examples too. Sun Pharma reported a loss of Rs 2,277 crore in the March 2022 quarter, after exceptional items of Rs 3,936 crore.
Grasim also reported a loss in the September 2018 quarter after a one-time charge of Rs 2,003 crore related to its investment in Vodafone Idea.
Now, consider the opposite situation.
Tata Motors reported a profit for the December 2022 quarter after making a loss in the same quarter a year earlier. Over the following year, its stock beat the Nifty by 84.3 percentage points.
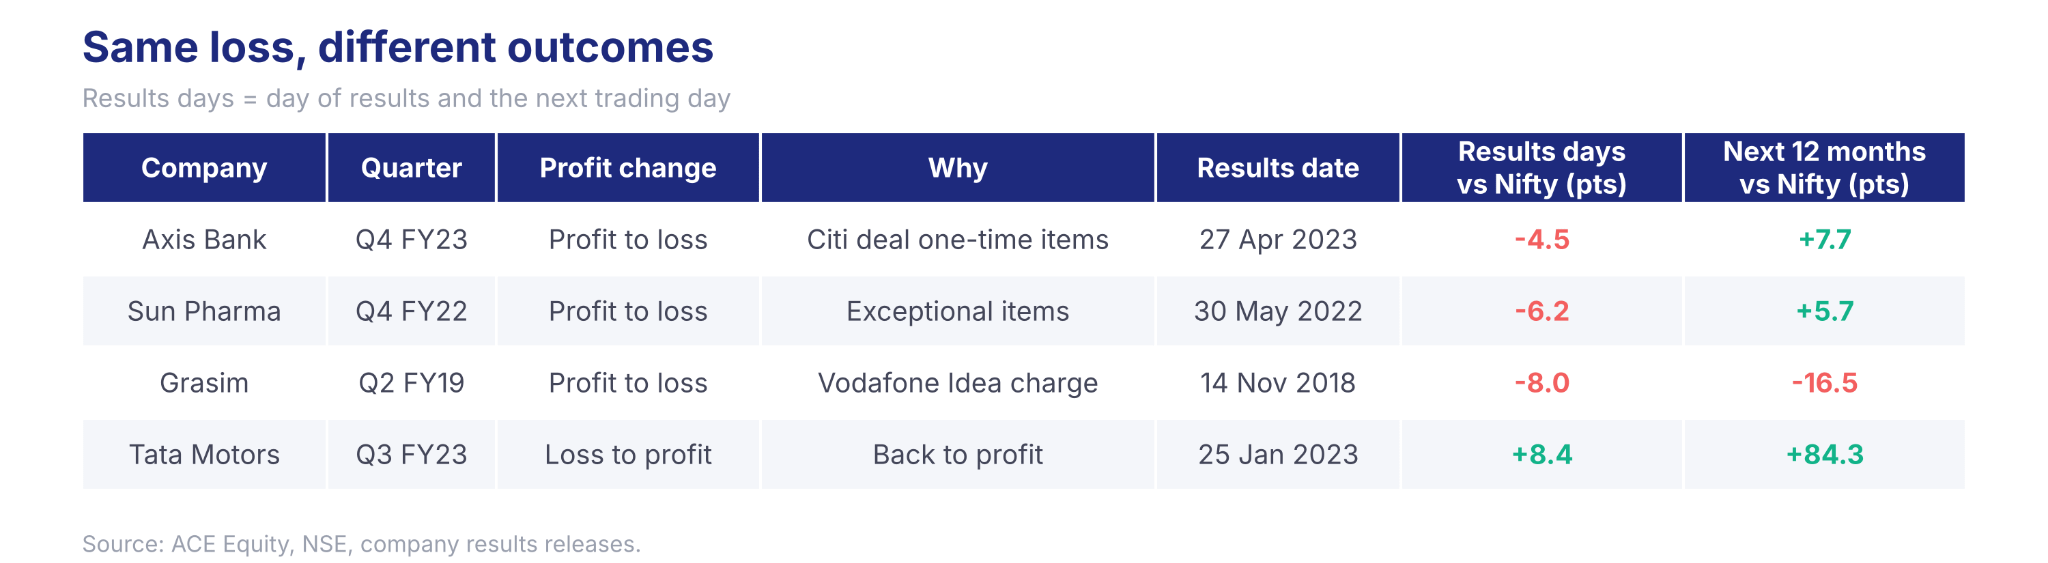
So, why are we looking at all these examples?
Because a headline profit or loss doesn’t always tell us the full story. A loss could come from a one-time charge, a company could be recovering from a difficult period, or its stock could be moving because of something else happening in the business or the broader market.
There’s also the question of what investors expected before the results. A company might report a loss, but what if investors were expecting an even bigger loss?
We didn’t have historical analyst expectations for every result in our study. So we couldn’t check whether the numbers surprised investors or whether the results themselves caused the stock prices to move.
This makes it even harder to draw a direct connection between a company’s quarterly profits or losses and what happens to its stock next.
Conclusion
We started this report wanting to understand whether a company reporting a profit or a loss would affect its stock performance.
Looking at both last week’s study on profits and this week’s study on losses, the takeaway is that the connection wasn’t as clear as we might have expected.
While we found some interesting patterns, none were reliable enough to predict what a stock would do next.
A company reporting a loss doesn’t necessarily mean its stock will fall. And returning to profit doesn’t guarantee that its stock will rise.
That’s because a company’s stock price depends on much more than its quarterly results.
Investors’ expectations, how the business is performing, and what’s happening in the broader market can all play a role.
So, rather than looking at a profit or loss alone, it’s important to understand what led to those numbers and what they mean for the business.
And that’s perhaps the biggest takeaway from these two studies.
Quarterly results can tell us how a company performed, but they can’t reliably tell us how its stock will perform next.
Note
Companies studied: We used today’s Nifty 50 companies, excluding those that left the index over the years. This creates survivorship bias.
Profit comparisons: We compared results with the same quarter a year earlier, not the previous quarter.
Sample size: We studied 160 loss-related cases. Half came from just five companies, and 70 were announced in 2020 or 2021. We excluded only three quarters, not the entire Covid period.
Information available: Some comparisons used information investors wouldn’t have known at the time, such as future profits.
Results dates: We used NSE’s calendar and company filings, but couldn’t independently verify every announcement date or its exact time. Some 2016 comparison results were announced after the study’s results-season cutoff.
Profit and loss data: We used ACE Equity data, which can include one-time items and non-controlling interests.
Stock returns: We excluded dividends. Other company news and market movements could also affect returns, so the study doesn’t prove that results caused stock-price movements.
Airtel rising after a loss while IndiGo fell on a profit really stayed with me.