

The Supply-Demand Interplay
The price of any commodity, including gold, is ultimately shaped by the balance between supply and demand forces.
At first glance, it might seem straightforward: in times of economic or geopolitical instability, demand for gold should surge and surpass available supply, while in periods of relative stability, demand would naturally ease, allowing supply to dominate.
However, the reality is often more nuanced. By closely examining recent market data, investor behavior, and broader macro-economic trends, we can uncover deeper insights into how strongly this assumption holds up and whether gold truly behaves in line with these conventional expectations.
The Gold Demand - What drives it?
Over the period from 2010 to 2024, the global supply of gold has remained relatively stable. This consistency is attributed to steady mine production and a smaller, but consistent, contribution from recycled gold.
Gold supply has also shown only a little change even in response to fluctuations in its market price.
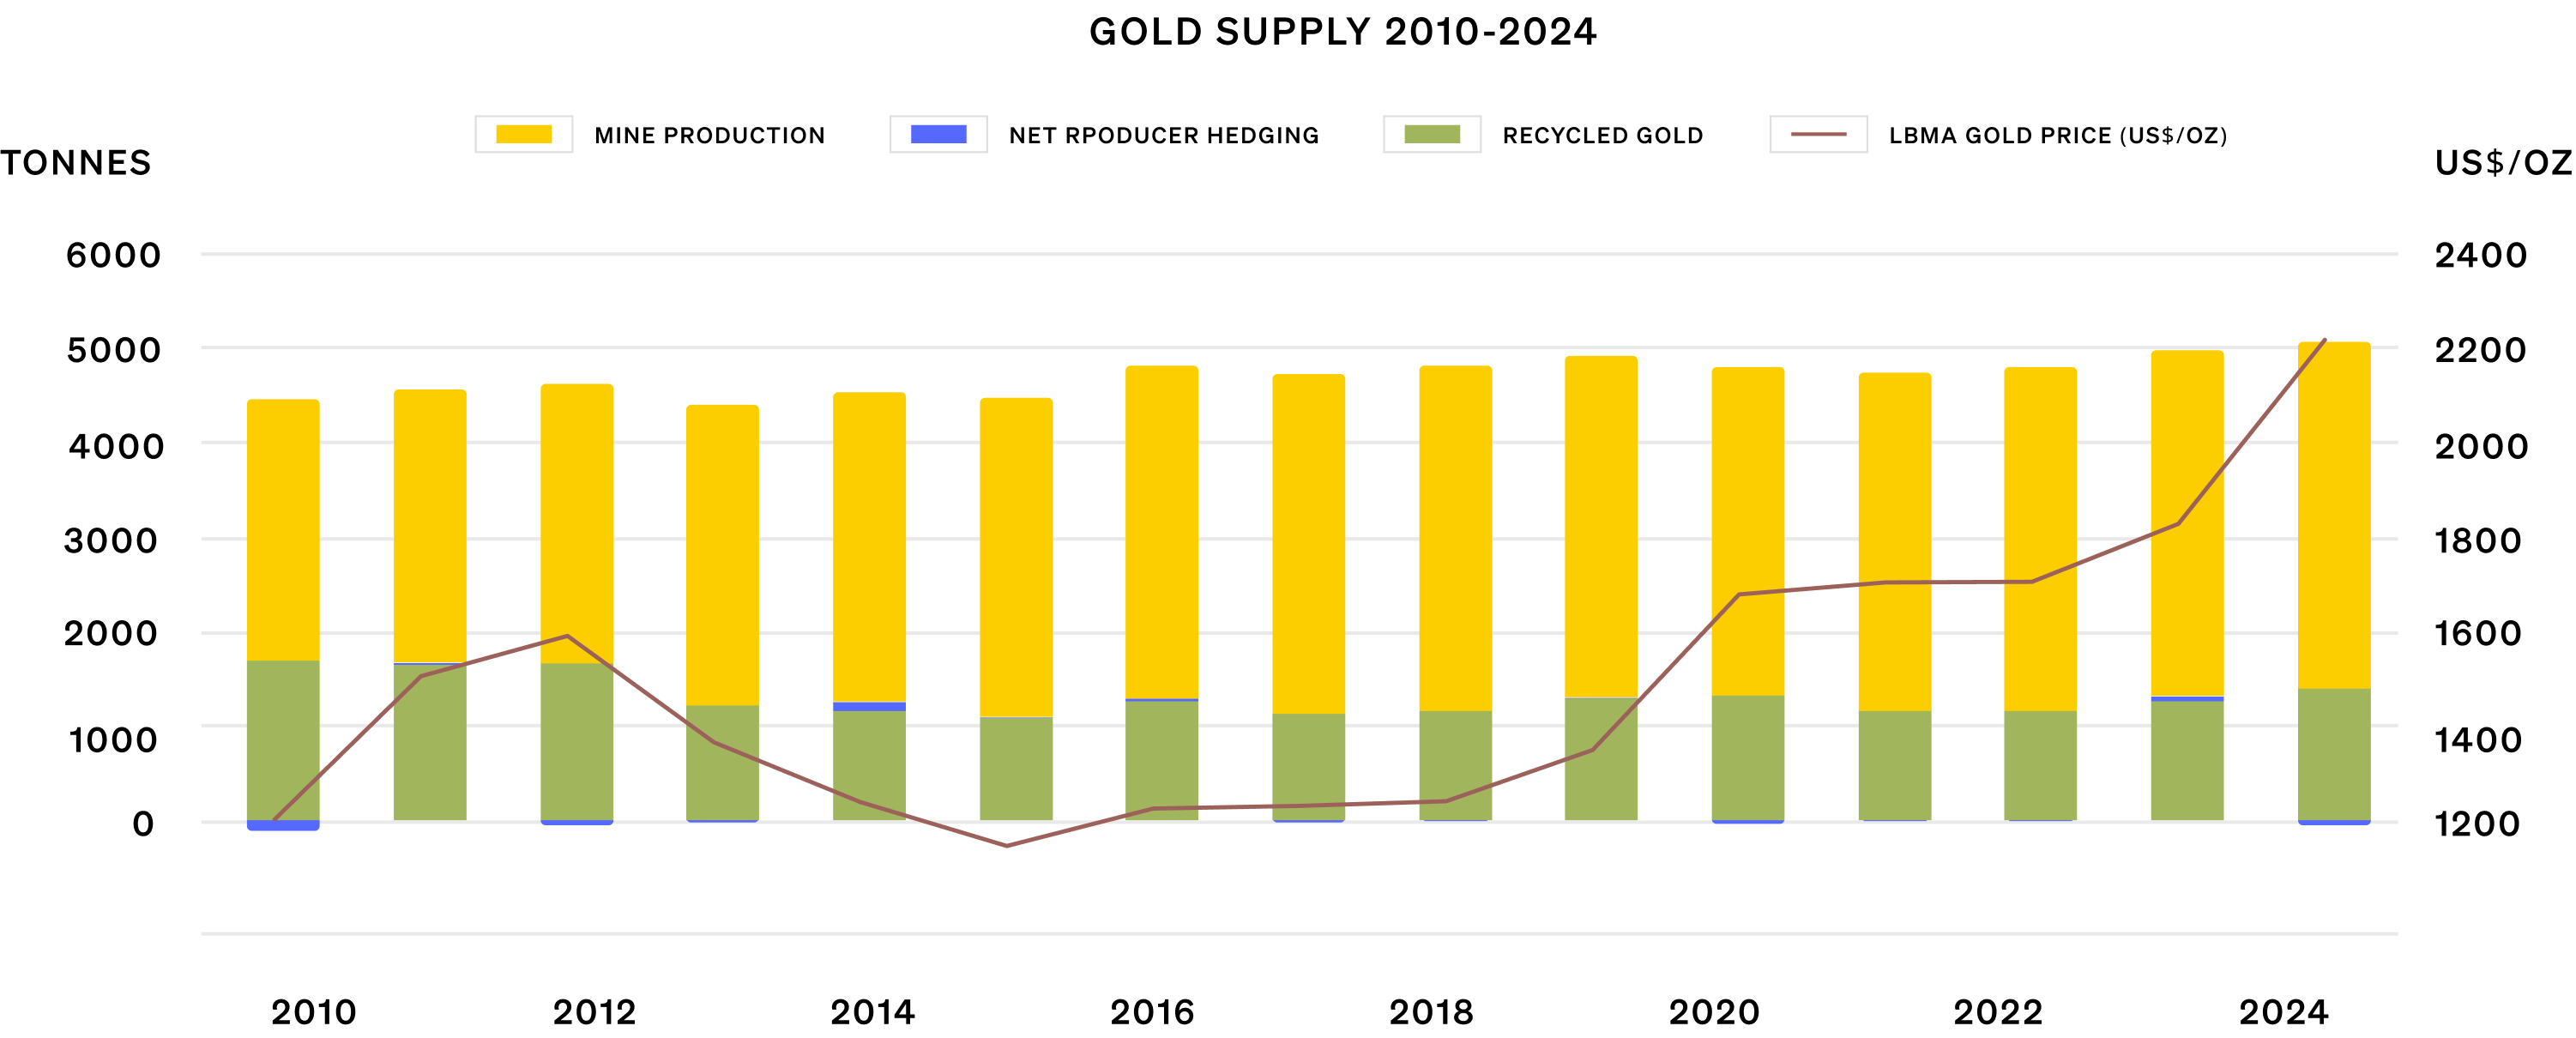
Opposite to that, fluctuations in gold demand have been the primary driver of its price changes.
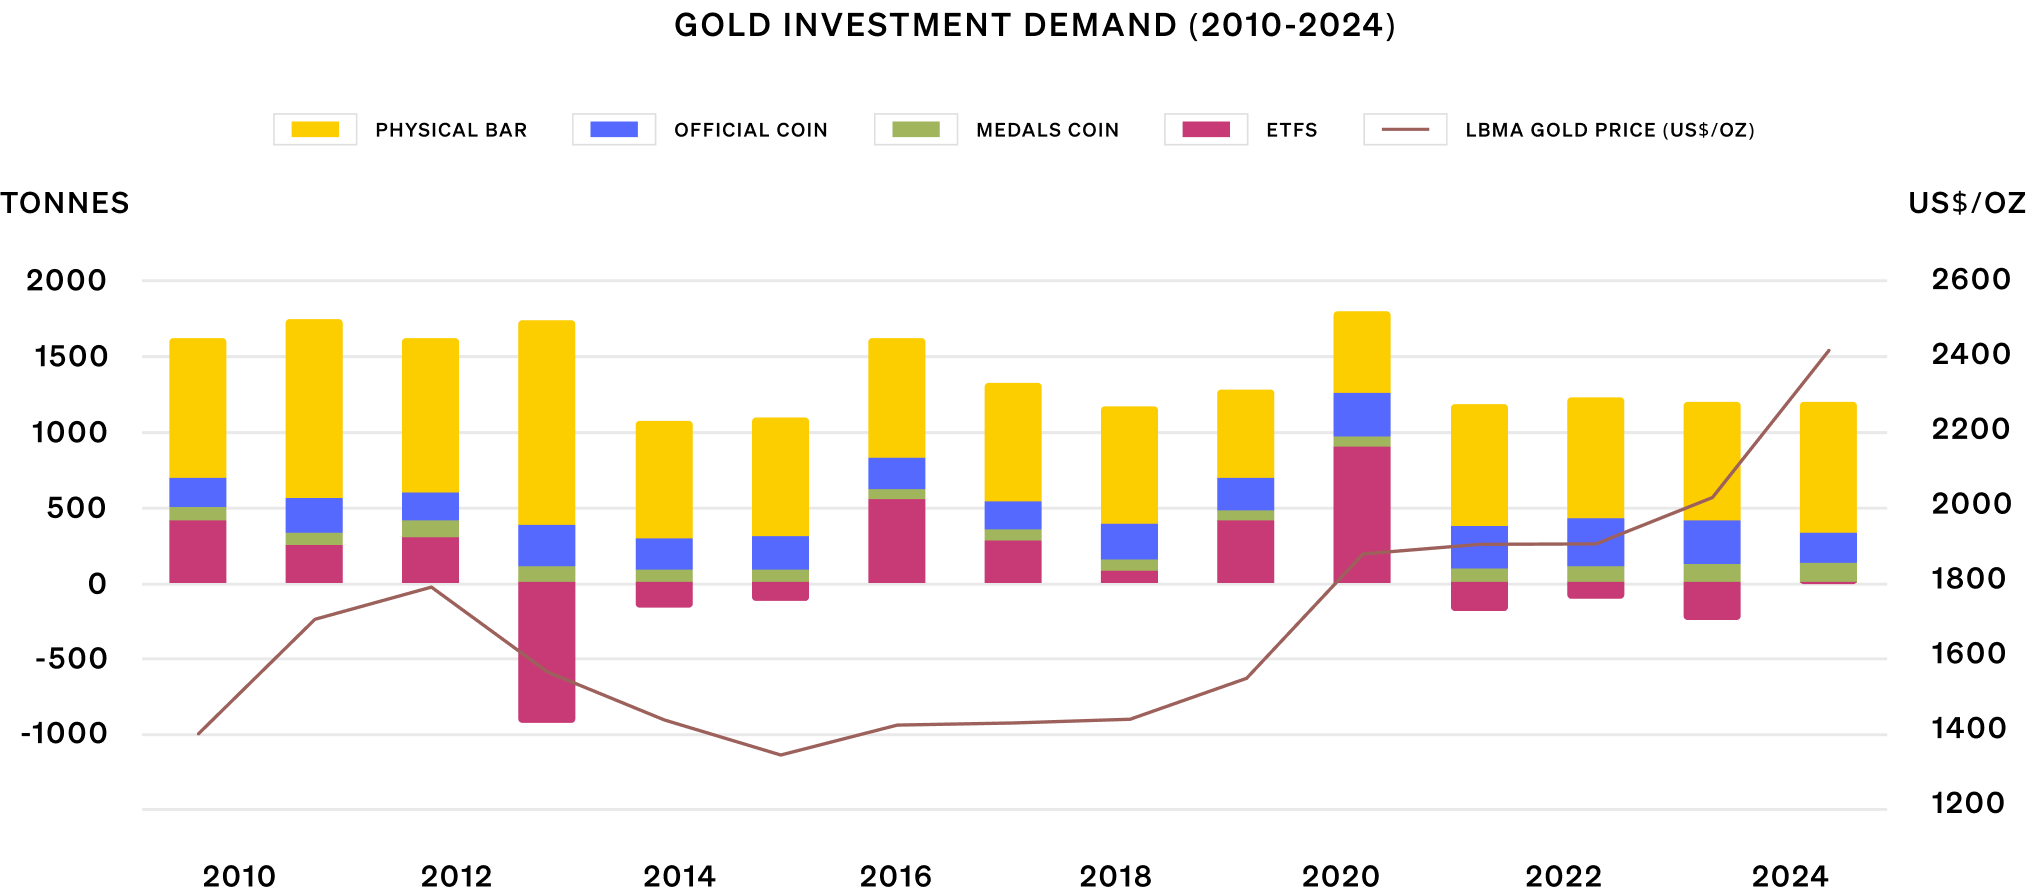
Investment Demand
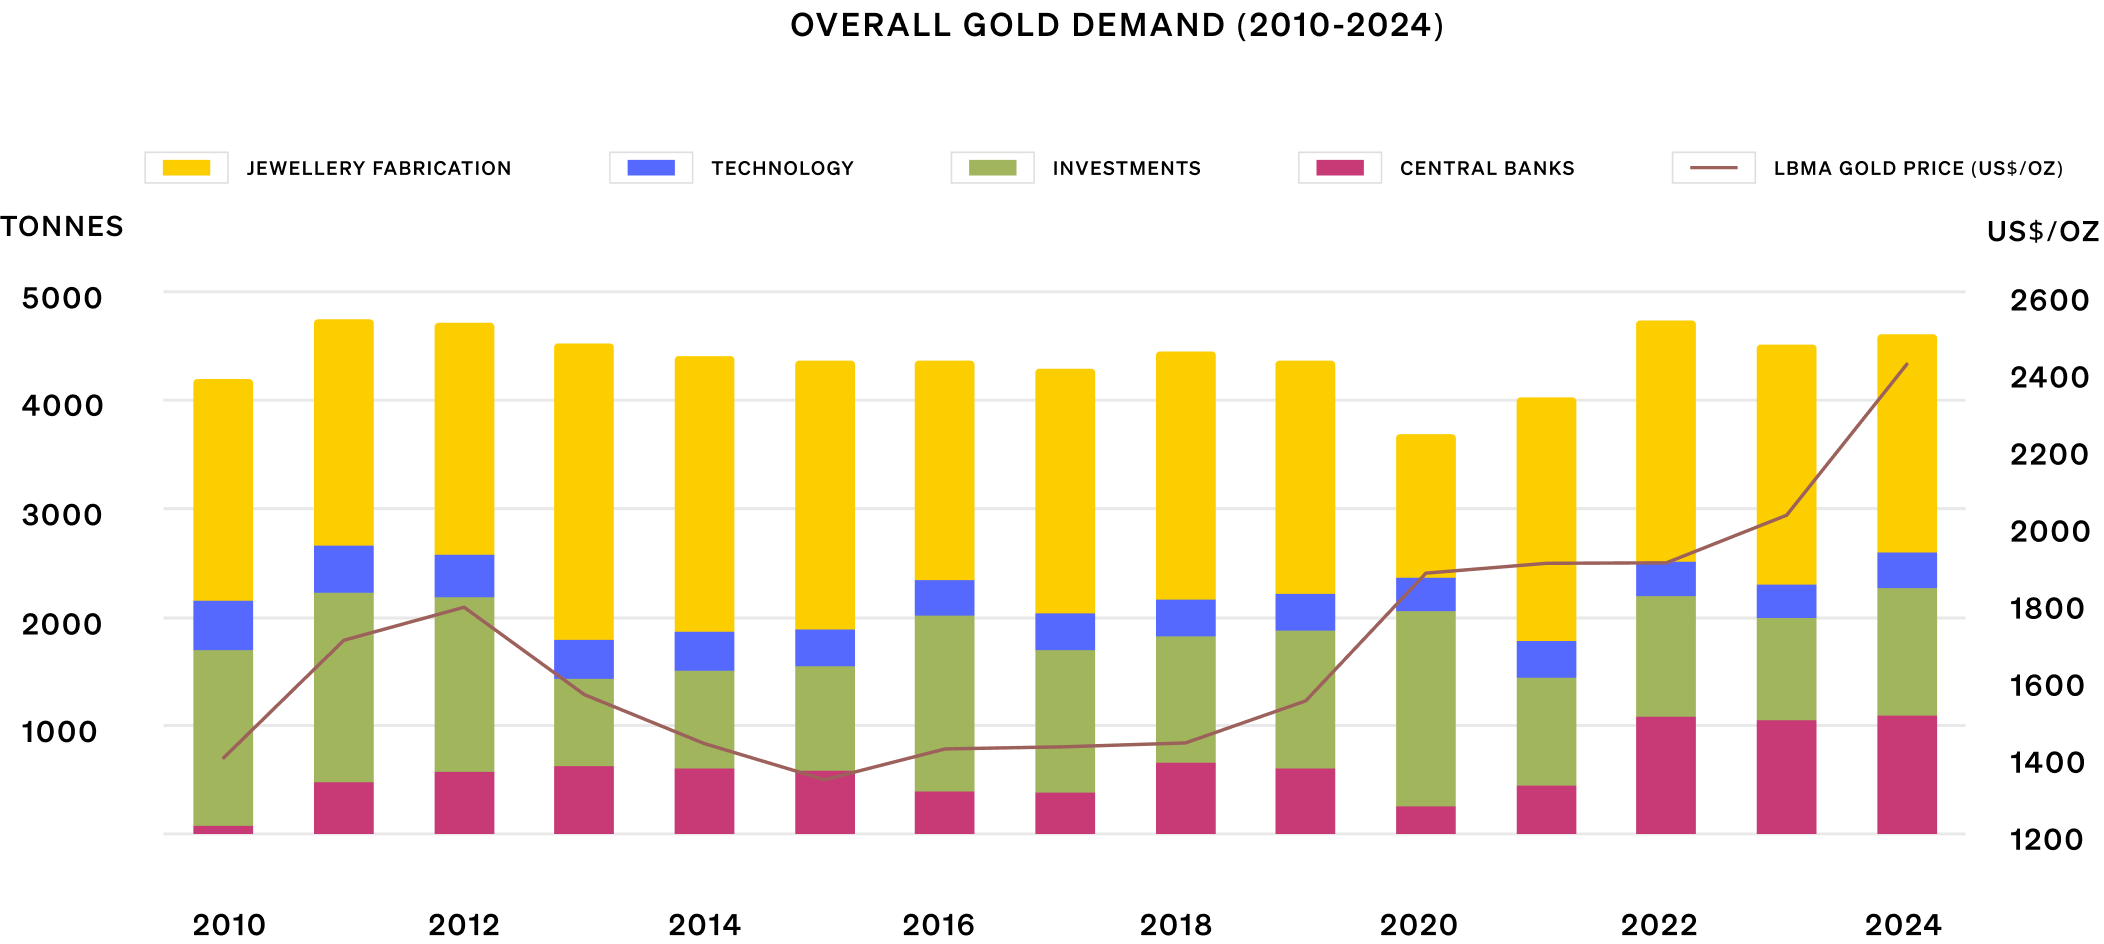
Central Bank Purchases
Jewellery and Technology Demand
The gold market is defined by a relatively stable and limited supply.
Demand, however, is significantly moved by global stability and current economic sentiments.
As a result, gold’s long-term price reflects its dual nature as both a physical commodity and a reliable financial asset, especially during times of global uncertainty.
Gold Production - Trends from 2010-2024
Over the past 15 years, global gold mining has exhibited a pattern of stability at the top of the producer rankings, while experiencing shifts among lower-ranked nations. Analyzing these long-term trends from 2010 to 2024 provides a clearer picture of the world’s gold-producing landscape.
Leading Producers:
China has consistently held the position of the world’s largest gold producer throughout the entire 2010 to 2024 period. Its production increased from 351 tonnes in 2010 to over 380 tonnes in 2024, maintaining an undisputed Rank 1.
Australia and Russia have consistently occupied the 2nd and 3rd positions, respectively, with their production levels often closely compared with each other.
Australia’s output peaked around 2019, followed by a moderate decline.
Ranking Shifts:
South Africa, which was a top 5 producer in 2010, exited the top tier by 2012 and has not re-entered it since.
The US has experienced a steady decline in its gold output, falling from 231 tonnes in 2010 to just 158 tonnes in 2024, gradually affecting its position in the global rankings.
Opposite to that, Canada has moved in an upward trajectory. Starting outside the top 5 in 2010, Canada gradually increased its production and became a consistent top-5 producer from 2016 onwards.
Stability and Volatility:
While the top 3 producers (China, Australia, and Russia) have demonstrated significant consistency in their output, positions 4 and 5 have shown greater volatility, with Canada and the US frequently rotating these spots based on short-term production trends.
Collectively, the top 5 gold-producing countries continue to dominate global production, highlighting a concentrated supply base.

Gold Reserves (2010-2024)
Do the countries producing the most gold also hold the most in their reserves?
The top 10 countries in gold reserve rankings have largely maintained their presence over the last 15 years, primarily experiencing shifts in their specific positions rather than a change in the composition of the top tier.
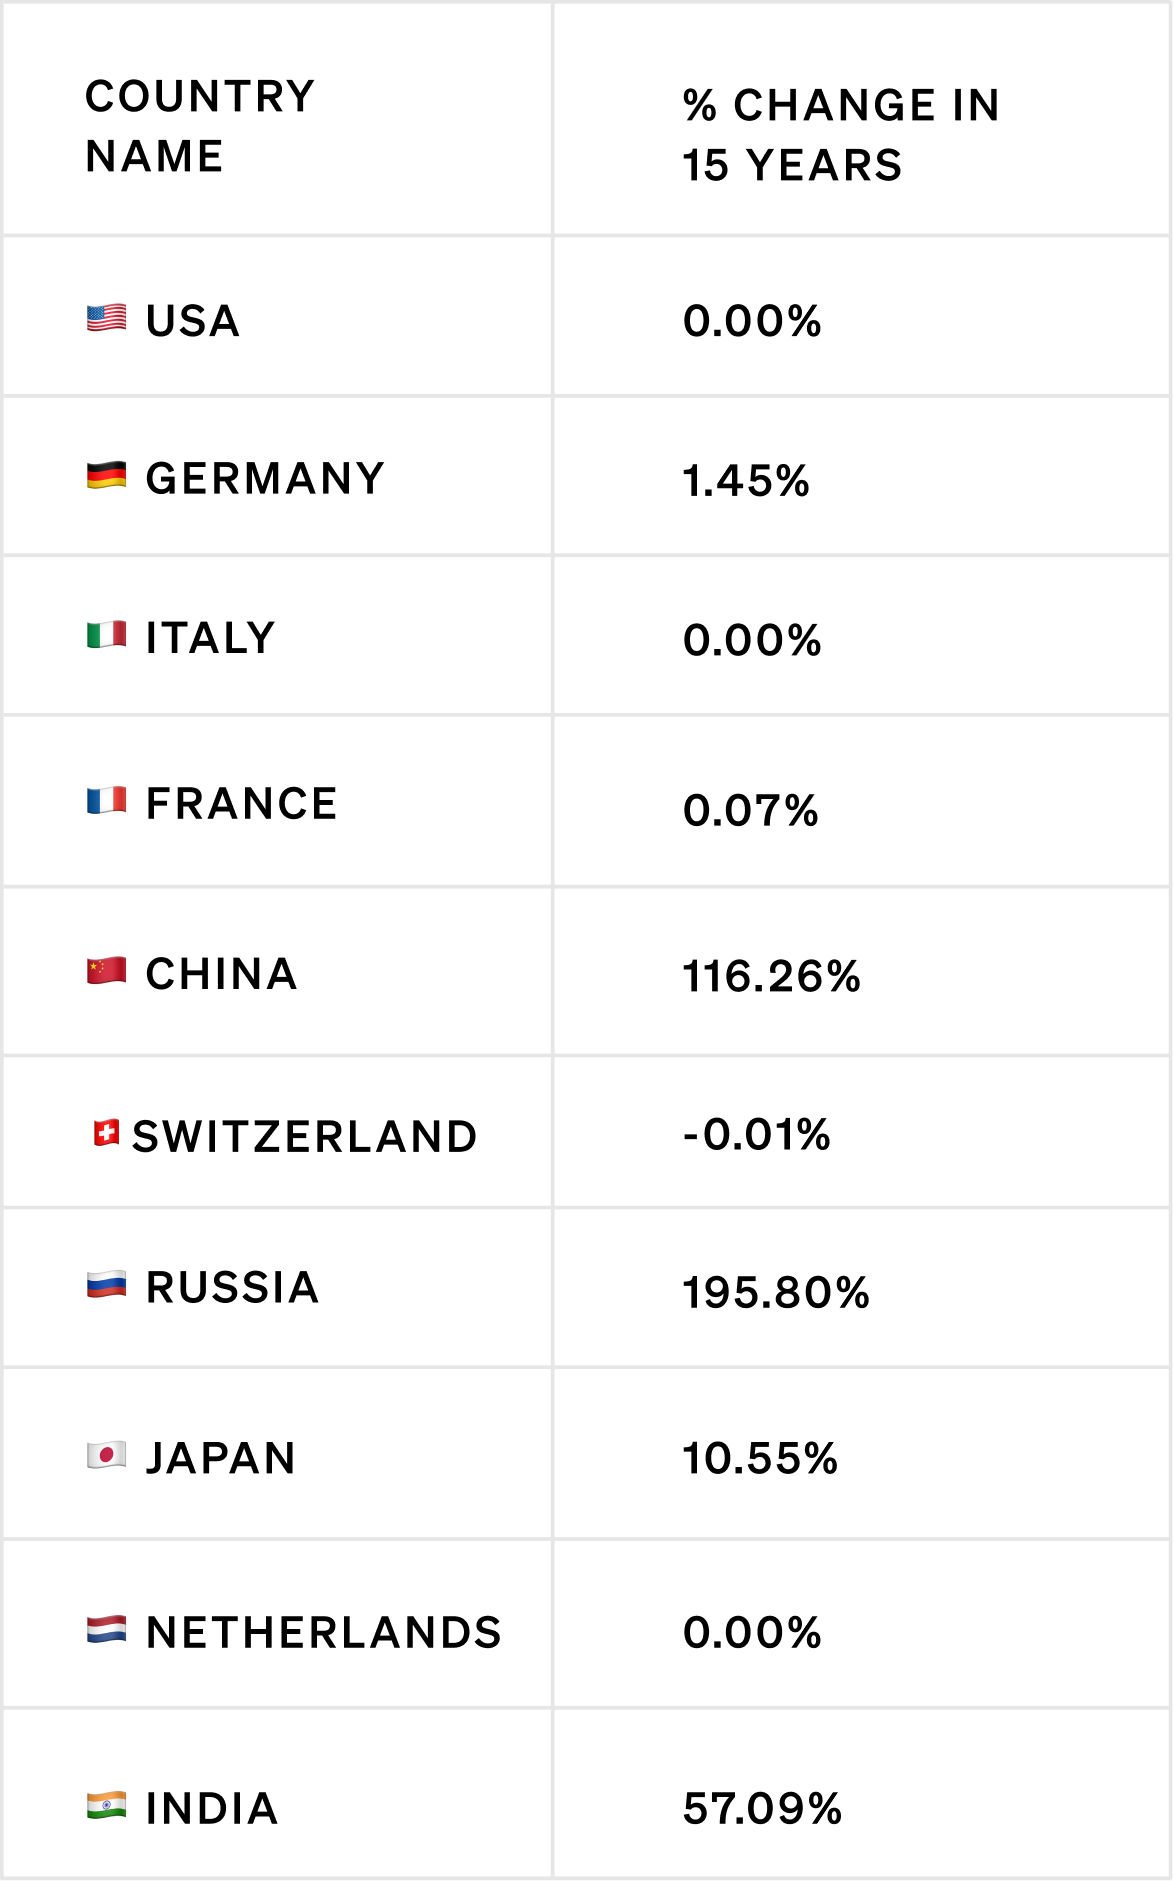
The US has consistently held the top spot in gold reserves, followed by Germany, Italy, and France.
China and Russia have shown the most significant movements. China steadily climbed the ranks, surpassing Switzerland and Russia to stand at 5th place. Russia also saw a rise between 2013 and 2019 but was later overtaken by China.
India improved its position from 10th to 8th over these years.
Russia showed a substantial growth in its gold reserves, with an impressive increase of 195.8% over the 15-year period, followed by China and India.
To Sum Up
From January 2024 to mid-2025, gold prices didn’t just move up by chance. They climbed steadily on the back of some powerful global forces. Geopolitical tensions created uncertainty, central bank policies shaped liquidity, and persistent inflation pushed investors to look for safety.
Add to that the ongoing trend of de-dollarization, and gold naturally found itself in the spotlight as a reliable store of value.
What’s interesting is that supply has remained relatively stable, while central banks, especially in emerging economies, kept buying consistently.
At the same time, investor sentiment swung back and forth, which added to the price fluctuations. On the production side, China, Australia, and Russia continued to dominate as the world’s largest suppliers, anchoring the physical side of the market.
All of this reinforces gold’s unique role. It’s not just another shiny metal.
It’s both a commodity with tangible supply & demand dynamics and a financial hedge that people turn to when the world feels uncertain.
In today’s climate, gold is less about short-term speculation and more about long-term confidence, acting like a barometer of how secure, or insecure, the global system feels at any given moment.